Abstract
Background: The predictive value of both atrial natriuretic peptide (ANP) and B-type natriuretic peptide (BNP) is well known. This study evaluated the prognostic value of a novel natriuretic peptide index (NPI) combining ANP and BNP.
Methods and Results: This study included 849 consecutive patients with coronary artery disease who underwent successful percutaneous coronary intervention (PCI). Patients were followed up clinically for up to 3 years or until the occurrence of major adverse cardiac events (MACE). The primary endpoint was a composite of all-cause death and non-fatal myocardial infarction. The NPI (pg/mL) was defined as  . MACE occurred in 73 patients (8.6%) during the follow-up period. Receiver operating characteristic curve analysis showed the highest area under the curve for NPI (0.779) compared with ANP and BNP (0.773 and 0.755, respectively). A risk analysis of MACE occurrence adjusted for the multivariable model showed the highest hazard ratio (HR) for NPI (1.33; 95% confidence interval [CI] 1.18–1.51; P<0.001) compared with ANP and BNP (HR 1.25 [95% CI 1.13–1.39] and 1.30 [95% CI 1.13–1.49], respectively; P<0.001). The NPI was a significant independent predictor of MACE, among other clinical parameters, in the multivariable analysis.
Conclusions: Compared with ANP and BNP, the NPI was more effective in predicting future adverse events after PCI.
Natriuretic peptides are classified into 3 types of ligands: atrial natriuretic peptide (ANP), B-type natriuretic peptide (BNP), and C-type natriuretic peptide (CNP), with ANP and BNP being clinically significant. ANP and BNP are predominantly secreted from the atrium1 and ventricle,2 respectively, with the former being secreted in response to atrial wall stretch and baroreceptor reflex.3 BNP secretion is stimulated by ventricular wall stretching.4
It has been reported that ANP is also secreted from the ventricle and is regulated by the stimulation of the ventricular wall stress.3,5 Further of note, this ventricular-derived ANP was found to be increased in patients with severe heart failure (HF).6 The physiological effects of natriuretic peptides are numerous and include diuresis, natriuresis, vasodilation, inhibition of the renin-angiotensin-aldosterone system, and sympathetic inhibition.1,7 Furthermore, ANP or BNP themselves have been shown to inhibit myocardial hypertrophy and ventricular fibrotic remodeling,8,9 and play cardioprotective roles via multiple natriuretic peptide receptors.10–12
Natriuretic peptides not only exert physiological effects, but also act as clinical markers. ANP and BNP are powerful prognostic indicators and are widely used as clinical markers of cardiovascular disease.2,13–16 For example, patients with higher plasma ANP concentrations after experiencing myocardial infarction (MI) have a poor long-term prognosis.17 Also in MI, BNP is secreted in larger amounts than ANP from both the infarcted myocardium15 and the surviving myocardium after being stimulated by ventricular wall stress.18 Elevated natriuretic peptide levels are predictors of poor prognosis independently or with left ventricular ejection fraction (LVEF), regardless of the cause of hemodynamic compromise.19,20 Furthermore, BNP is a predictor of poor prognosis not only in patients with various cardiovascular diseases, but also in the general population.21
Given that ANP and BNP are powerful clinical markers, the significance of the simultaneous measurement of ANP and BNP was discussed by Ruskoaho and its usefulness pointed out: BNP reflects prolonged cardiac overload and ANP reflects acute rapid volume load or hemodynamic change by releasing ANP stored in the atrium.22 This may be due to the fact that ANP mainly reflects the cardiac preload, whereas BNP reflects the cardiac afterload.23 Attempts have been made to integrate these 2 markers by calculating the ratio of ANP to BNP; however, the usefulness of the ANP/BNP ratio remains controversial. Many studies have reported the beneficial nature of the ratio,24–26 whereas others have challenged it.27
The natriuretic peptide index (NPI), which is a combined index of ANP and BNP, is a novel index that can eliminate these problems. To the best of our knowledge, there are no studies in the literature that have used this index. Hence, our original study using this novel index may provide new knowledge.
Methods
Study Patients
This study was a retrospective analysis of patients who underwent percutaneous coronary intervention (PCI) at the University of Yamanashi Hospital between October 2012 and May 2019. In all, 1,094 consecutive patients who underwent PCI for coronary artery disease were included in this study. To be eligible for inclusion, patients had to have undergone PCI and be ≥20 years of age. Patients in whom PCI was unsuccessful, those on hemodialysis, and those who failed to participate in follow-up were excluded. After the PCI procedure, patients were prospectively followed up clinically for up to 3 years or until an event occurred.
The study protocol conformed to the principles set out in the 1975 Declaration of Helsinki. The requirement for informed consent was waived by the Institutional Review Board due to the retrospective nature of the analysis.
Study Protocol
This study analyzed the predictive value of the NPI for the first major adverse cardiac event (MACE), which was evaluated prospectively for up to 3 years from the index date. The index date was defined as the date of PCI, when the patients were initially treated during the study period. The primary endpoint was the combination of all-cause mortality and non-fatal MI. If the first hospitalization for MI culminated in death because of progressive pump failure or sudden cardiac death during the follow-up period, the event was considered death. Non-fatal MI was diagnosed by typical ischemic chest pain with a creatine kinase-MB concentration at least twice the upper limit of normal, a troponin T concentration >0.1 ng/mL, or characteristic ischemic changes apparent on the electrocardiogram at the time of the event.
Hypertension was defined as systolic blood pressure ≥140 mmHg, diastolic blood pressure ≥90 mmHg during hospitalization, or receiving treatment for high blood pressure before admission. Diabetes was defined as a casual glucose concentration ≥200 mg/dL, fasting plasma glucose ≥126 mg/dL, HbA1c ≥6.5% (National Glycohemoglobin Standardization Program), or treatment with antidiabetic drugs before admission. Peripheral artery disease (PAD) was defined as an ankle-brachial index <0.9 or a history of peripheral artery revascularization. Stroke was defined as a history of symptomatic brain dysfunction attributable to a vascular etiology. Chronic obstructive pulmonary disease was defined as airflow limitation on spirometry or under inhalation therapy.
Blood samples were collected from a peripheral vein in the early morning a few days before discharge from hospital. Drug prescriptions were obtained at discharge after the index PCI. Medications were prescribed at the discretion of physicians. Patients received standard medical treatment after admission,28 which continued throughout the follow-up period. Instructions regarding optimal lifestyle changes and diets were provided before discharge and were continued throughout the follow-up period. Clinical follow-up information was obtained through clinical visits, telephone surveys, validated questionnaires, and discussions with the referring physicians. All endpoint data were carefully checked by the investigators for accuracy, consistency, and completeness of follow-up. One investigator (T.H.) verified all the data, performed the statistical analyses, and ensured data file security.
Exposure and Laboratory Measurements
Plasma concentrations of ANP and BNP were measured using an immunoradiometric assay (Shionogi Pharmaceutical, Osaka, Japan). In this study, the NPI (pg/mL) was originally defined and calculated as follows:
NPI = 
Low-density lipoprotein cholesterol levels were calculated using the Friedewald formula.29 The estimated glomerular filtration rate (eGFR; mL/min/1.73 m2) was calculated using the following formula:30
eGFR = 194 × serum creatinine−1.094 × age−0.287 × 0.739 (if female)
Echocardiography was performed by the time of discharge. In patients with unstable conditions, such as acute coronary syndrome (ACS), echocardiography was performed during the stable period just before discharge after revascularization. Patients with stable angina were examined between just before admission and prior to discharge, regardless of the timing of revascularization. The left ventricle dimensions and LVEF were calculated using the motion-mode method with the Teichholz formula.
Statistical Analysis
Data are expressed as median with interquartile range (IQR), frequencies and percentages, or hazard ratios (HR) with 95% confidence intervals (CI). Continuous variables were tested using the Shapiro-Wilk test for normality and compared using the Wilcoxon rank-sum test. Categorical variables were compared between groups using Pearson’s Chi-squared analysis or Fisher’s exact test, as appropriate. Receiver operating characteristic (ROC) curve analysis was performed to compare the predictive power for each natriuretic peptide indicator and to calculate the cut-off value of the NPI. The NPI cut-off value was determined using Youden’s index from the ROC analysis for event occurrence. Correlations between clinical variables and event-free survival were tested using the Kaplan-Meier method, log-rank tests, and Cox proportional hazard regression. In Cox proportional hazard regression analysis, each continuous variable was divided by its standard deviation to calculate the HR. During multivariable analysis, backward stepwise Cox regression was used for variable selection. In the multivariable model, the following major cardiovascular risk factors were included in the Thrombolysis In Myocardial Infarction risk score (TRS) for secondary prevention as covariates:31 age per 5 years, hypertension, diabetes, PAD, stroke, current smoking, previous HF, coronary artery graft bypass, eGFR, and NPI. Statistical significance was defined as P<0.05. All statistical analyses were performed using SPSS version 25 (IBM Corp., Armonk, NY, USA).
Results
Study Patients
This study initially included 1,094 patients who underwent PCI. Based on the exclusion criteria, 15 patients with failed PCI and 92 hemodialysis patients were excluded. All patients participated in a prospective clinical follow-up assessment of the incidence of MACE after the index date. During the follow-up period, 138 patients discontinued participation. The remaining 849 patients were included in this study (Figure 1). The median follow-up period was 30 months (IQR 13–36 months). During the follow-up period, 73 MACE occurred (72 all-cause deaths, 1 non-fatal MI). Of the 72 total deaths, 11 were cardiac and 61 were non-cardiac (17 cancer deaths, 44 non-cancer deaths). The clinical characteristics of the patients are summarized in Table 1.
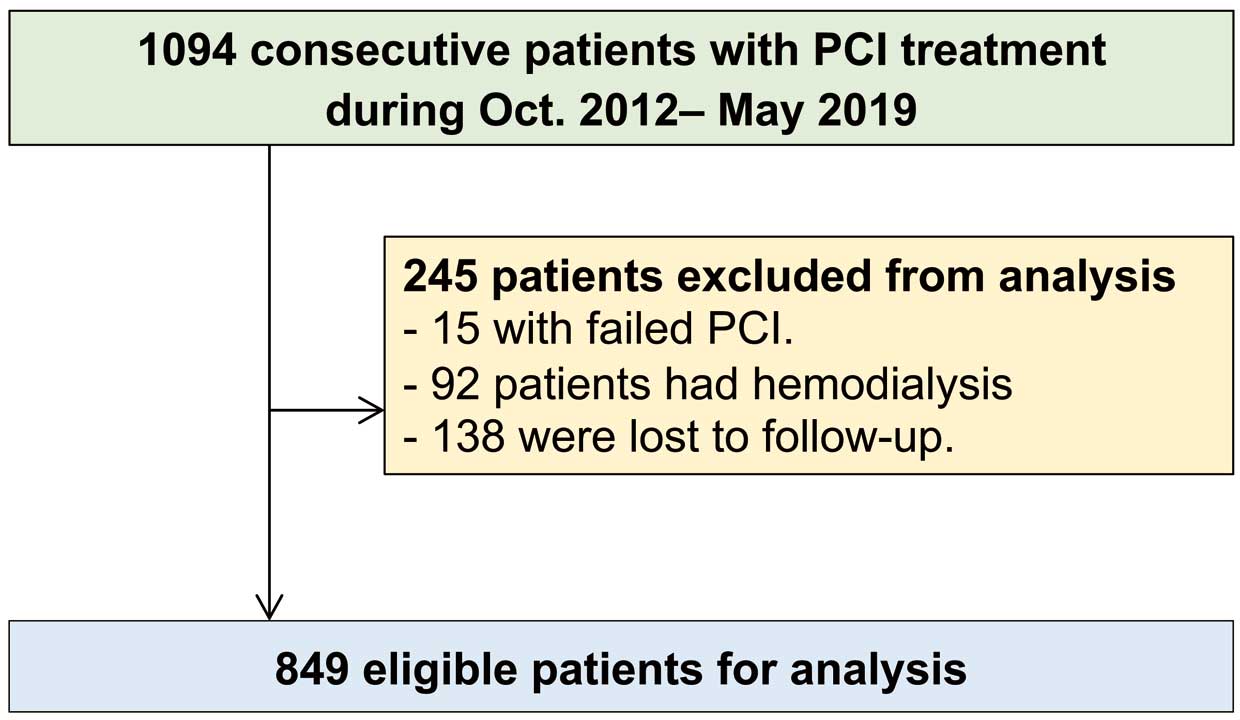
Table 1. Comparisons of Clinical Characteristics Between Patients With and Without MACE
| |
Overall
(n=849) |
With MACE
(n=73) |
Without MACE
(n=776) |
P value |
| Age (years) |
70 [62–78] |
80 [74–85] |
69 [62–76] |
<0.001 |
| Male sex |
679 (80.0) |
57 (78.1) |
622 (80.2) |
0.65 |
| BMI (kg/m2) |
23.7 [21.3–26.1] |
22.1 [20.0–24.5] |
23.8 [21.5–26.1] |
<0.001 |
| Hypertension |
592 (69.7) |
59 (80.8) |
533 (68.7) |
0.03 |
| Diabetes |
335 (39.5) |
32 (43.8) |
303 (39.0) |
0.45 |
| PAD |
41 (4.8) |
9 (12.3) |
32 (4.1) |
0.006 |
| Stroke |
86 (10.1) |
9 (12.3) |
77 (9.9) |
0.54 |
| COPD |
49 (5.8) |
5 (6.8) |
44 (5.7) |
0.60 |
| Chronic AF |
40 (4.7) |
4 (5.5) |
36 (4.6) |
0.77 |
| Paroxysmal AF |
34 (4.0) |
3 (4.1) |
31 (4.0) |
1.00 |
| Previous HF |
116 (13.7) |
21 (28.8) |
95 (12.2) |
<0.001 |
| Previous PCI |
155 (18.3) |
18 (24.7) |
137 (17.7) |
0.15 |
| Previous CABG |
19 (2.2) |
3 (4.1) |
16 (2.1) |
0.22 |
| Current smoking |
245 (28.9) |
19 (26.0) |
226 (29.1) |
0.69 |
| Hemoglobin (g/dL) |
14 [12–15] |
12 [10–14] |
14 [12–15] |
<0.001 |
| FBG (mg/dL) |
97 [87–118] |
93 [86–121] |
97 [87–118] |
0.25 |
| HbA1c (%) |
6.1 [5.7–6.7] |
6.0 [5.7–6.9] |
6.1 [5.7–6.7] |
0.65 |
| TG (mg/dL) |
125 [95–164] |
106 [85–140] |
126 [97–167] |
0.001 |
| HDL-C (mg/dL) |
41 [35–48] |
38 [31–46] |
41 [35–49] |
0.04 |
| LDL-C (mg/dL) |
115 [94–139] |
104 [77–122] |
116 [95–140] |
<0.001 |
| eGFR (mL/min/1.73 m2) |
65 [53–77] |
52 [42–63] |
66 [54–78] |
<0.001 |
| ANP (pg/mL) |
36 [20–70] |
77 [48–144] |
33 [19–63] |
<0.001 |
| BNP (pg/mL) |
77 [29–227] |
264 [108–623] |
69 [27–192] |
<0.001 |
| NPI (pg/mL) |
53 [26–122] |
154 [74–267] |
50 [23–104] |
<0.001 |
| Renin (ng/mL/h) |
1.8 [0.7–4.7] |
1.8 [0.7–6.0] |
1.8 [0.6–4.6] |
0.61 |
| Aldosterone (pg/mL) |
91 [64–130] |
81 [55–111] |
91 [65–130] |
0.10 |
| Aldosterone renin ratio |
48.8 [20.9–123.3] |
41.5 [15.6–85.0] |
49.3 [21.4–124.0] |
0.10 |
| Dopamine (ng/mL) |
0.010 [0.010–0.012] |
0.013 [0.010–0.029] |
0.010 [0.010–0.011] |
<0.001 |
| Norepinephrine (ng/mL) |
0.23 [0.16–0.34] |
0.32 [0.20–0.48] |
0.23 [0.16–0.33] |
<0.001 |
| Epinephrine (ng/mL) |
0.019 [0.010–0.031] |
0.027 [0.015–0.042] |
0.018 [0.010–0.030] |
0.001 |
| hs-Troponin T (pg/mL) |
0.036 [0.008–0.543] |
0.049 [0.018–0.385] |
0.035 [0.008–0.562] |
0.65 |
| hs-CRP (mg/dL) |
0.19 [0.05–0.77] |
0.49 [0.06–1.05] |
0.19 [0.05–0.75] |
0.09 |
| Echocardiography |
| LVEF (%) |
63 [52–71] |
53 [42–66] |
63 [52–71] |
<0.001 |
| LA diameter (mm) |
36 [32–40] |
38 [34–41] |
36 [32–40] |
0.002 |
| LVESD (mm) |
30 [26–36] |
34 [27–42] |
30 [26–36] |
0.002 |
| LVEDD (mm) |
47 [42–51] |
49 [44–53] |
46 [42–51] |
0.04 |
| Mitral peak E wave velocity (cm/s) |
62 [51–78] |
67 [53–88] |
61 [51–77] |
0.05 |
| Mitral peak A wave velocity (cm/s) |
75 [60–89] |
87 [73–106] |
73 [59–88] |
<0.001 |
| NYHA HF classification |
|
|
|
0.001 |
| Class I |
443 (52.2) |
28 (38.4) |
415 (53.5) |
|
| Class II |
195 (23.0) |
14 (19.2) |
181 (23.3) |
|
| Class III |
123 (14.5) |
18 (24.7) |
105 (13.5) |
|
| Class IV |
88 (10.4) |
13 (17.8) |
75 (9.7) |
|
| Medications |
| Aspirin |
827 (97.4) |
72 (98.6) |
755 (97.3) |
1.00 |
| Warfarin |
129 (15.2) |
14 (19.2) |
115 (14.8) |
0.31 |
| DOAC |
30 (3.5) |
1 (1.4) |
29 (3.7) |
0.51 |
| β-blocker |
347 (40.9) |
33 (45.2) |
314 (40.5) |
0.46 |
| CCB |
343 (40.4) |
22 (30.1) |
321 (41.4) |
0.06 |
| ACEI/ARB |
429 (50.5) |
42 (57.5) |
387 (49.9) |
0.22 |
| Statin |
534 (62.9) |
31 (42.5) |
503 (64.8) |
<0.001 |
| Insulin |
47 (5.5) |
2 (2.7) |
45 (5.8) |
0.42 |
| DPP4-I |
126 (14.8) |
7 (9.6) |
119 (15.3) |
0.23 |
| Loop diuretics |
127 (15.0) |
20 (27.4) |
107 (13.8) |
0.003 |
| Spironolactone |
62 (7.3) |
8 (11.0) |
54 (7.0) |
0.24 |
| Thiazide |
21 (2.5) |
3 (4.1) |
18 (2.3) |
0.42 |
| Amiodarone |
13 (1.5) |
5 (6.8) |
8 (1.0) |
0.003 |
| Digitalis |
4 (0.5) |
1 (1.4) |
3 (0.4) |
0.30 |
| PCI variables |
| ACS |
485 (57.1) |
37 (50.7) |
448 (57.7) |
0.27 |
| Rota |
39 (4.6) |
7 (9.6) |
32 (4.1) |
0.07 |
| IABP |
50 (5.9) |
11 (15.1) |
39 (5.0) |
0.002 |
| Use of DES |
603 (71.0) |
42 (57.5) |
561 (72.3) |
0.01 |
| Stent diameter (mm) |
3.0 [2.75–3.5] |
3.0 [2.75–3.5] |
3.0 [2.75–3.5] |
0.33 |
| Stent length (mm) |
22 [16–32] |
22 [16–32] |
22 [16–32] |
0.28 |
Unless indicated otherwise, data are expressed as the median (interquartile range) or n (%). ACEI, angiotensin-converting enzyme inhibitor; ACS, acute coronary syndrome; AF, atrial fibrillation; ANP, atrial natriuretic peptide; ARB, angiotensin II receptor blocker; BMI, body mass index; BNP, B-type natriuretic peptide; CABG, coronary artery bypass graft; CCB, calcium channel blocker; COPD, chronic obstructive pulmonary disease; DES, drug-eluting stent; DOAC, direct oral anticoagulant; DPP4-I, dipeptidyl peptidase-4 inhibitor; eGFR, estimated glomerular filtration rate; FBG, fasting blood glucose; HDL-C, high-density lipoprotein cholesterol; HF, heart failure; hs, high-sensitivity; hs-CRP, high-sensitivity C-reactive protein; IABP, intra-aortic balloon pump; LA, left atrium; LDL-C, low-density lipoprotein cholesterol; LVEDD, left ventricular end-diastolic diameter; LVEF, left ventricular ejection fraction; LVESD, left ventricular end-systolic diameter; MACE, major adverse cardiovascular events; NPI, natriuretic peptide index; NYHA, New York Heart Association; PAD, peripheral artery disease; PCI, percutaneous coronary intervention; Rota, rotational atherectomy; TG, triglyceride.
The age at the index date was significantly higher in patients with MACE. In addition, hypertension, PAD, HF, and low body mass index (BMI) were significantly more prevalent in the MACE than non-MACE group (Table 1). With regard to laboratory measurements, the MACE group had significantly lower hemoglobin levels, lipid profiles, and eGFR than the non-MACE group. Furthermore, the MACE group had significantly higher ANP, BNP, NPI, and catecholamine levels (Table 1). With regard to echocardiographic parameters, LVEF was significantly lower in patients with MACE; in contrast, the left atrial diameter (LAD), left ventricular end-systolic diameter (LVESD), left ventricular end-diastolic diameter (LVEDD), and mitral peak A-wave velocity were significantly larger and higher in patients with MACE. Furthermore, the New York Heart Association (NYHA) HF class was significantly worse in patients with than without MACEs (Table 1). With regard to medications, the use of statins was significantly rarer, whereas the use of loop diuretics and amiodarone was significantly more frequent in the MACE than non-MACE group (Table 1). For PCI variables, the use rate of intra-aortic balloon pumping (IABP) and drug-eluting stents was significantly more common in patients with than without MACE (Table 1).
Predictive Power of NPI for MACE Occurrence
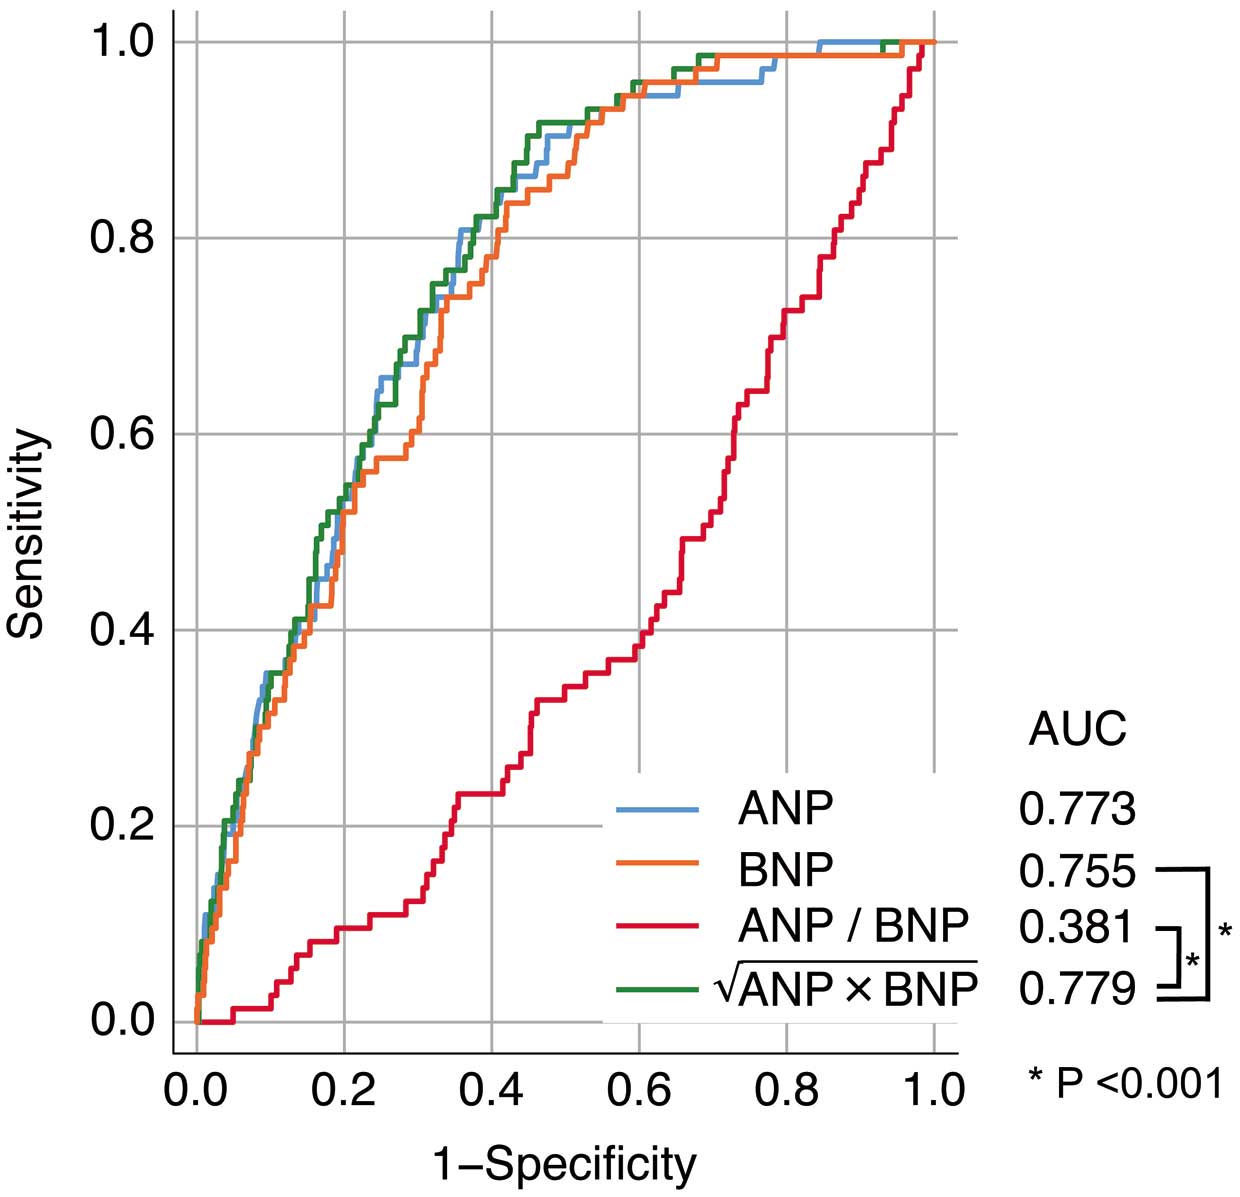
During ROC curve analysis, the area under the curve (AUC) for MACE occurrence was 0.779 for NPI, 0.773 for ANP, 0.755 for BNP, and 0.381 for the ANP/BNP ratio (Figure 2). The AUC for NPI was the highest among the natriuretic peptide indicators. Predictive power differed significantly between NPI and both BNP and the ANP/BNP ratio (P<0.001 for both). However, there was no significant difference in the predictive power between NPI and ANP. The optimal NPI cut-off value for MACE prediction was 54.7 pg/mL.
Comparisons of Clinical Parameters of Patients Divided by NPI Cut-Off Value
Patients were divided into 2 groups based on the NPI cut-off value calculated from the ROC curve analysis. The age at index date, prevalence of hypertension, previous stroke, chronic atrial fibrillation (AF), paroxysmal AF, and previous HF were significantly higher or more frequent in the group with NPI values higher than the cut-off value. Furthermore, males were more frequent and BMI levels were significantly higher in patients with NPI values below the cut-off (Table 2).
Table 2. Clinical Characteristics of Patients According to a NPI Cut-Off Value of 54.7 pg/mL
| |
Under cut-off
(n=435) |
Over cut-off
(n=414) |
P value |
| Age (years) |
66 [60–73] |
75 [66–81] |
<0.001 |
| Male sex |
367 (84.4) |
312 (75.4) |
0.001 |
| BMI (kg/m2) |
24.6 [22.3–26.7] |
22.8 [20.5–24.9] |
<0.001 |
| Hypertension |
283 (65.1) |
309 (74.6) |
0.003 |
| Diabetes |
169 (38.9) |
166 (40.1) |
0.73 |
| PAD |
17 (3.9) |
24 (5.8) |
0.21 |
| Stroke |
35 (8.0) |
51 (12.3) |
0.04 |
| COPD |
20 (4.6) |
29 (7.0) |
0.14 |
| Chronic AF |
1 (0.2) |
39 (9.4) |
<0.001 |
| Paroxysmal AF |
9 (2.1) |
25 (6.0) |
0.004 |
| Previous HF |
17 (3.9) |
99 (23.9) |
<0.001 |
| Previous PCI |
72 (16.6) |
83 (20.0) |
0.21 |
| Previous CABG |
9 (2.1) |
10 (2.4) |
0.82 |
| Current smoking |
131 (30.1) |
114 (27.5) |
0.45 |
| Hemoglobin (g/dL) |
14 [13–15] |
13 [11–14] |
<0.001 |
| FBG (mg/dL) |
97 [87–117] |
97 [87–120] |
0.69 |
| HbA1c (%) |
6.1 [5.7–6.6] |
6.1 [5.7–6.7] |
0.59 |
| TG (mg/dL) |
135 [104–179] |
113 [88–148] |
<0.001 |
| HDL-C (mg/dL) |
42 [36–49] |
40 [33–47] |
0.001 |
| LDL-C (mg/dL) |
118 [97–142] |
112 [90–134] |
0.002 |
| eGFR (mL/min/1.73 m2) |
69 [58–81] |
60 [47–73] |
<0.001 |
| ANP (pg/mL) |
21 [15–31] |
69 [45–104] |
<0.001 |
| BNP (pg/mL) |
29 [16–53] |
237 [118–465] |
<0.001 |
| Renin (ng/mL/h) |
2.1 [0.8–4.8] |
1.5 [0.5–4.7] |
0.007 |
| Aldosterone (pg/mL) |
101 [72–137] |
81 [59–117] |
<0.001 |
| Aldosterone renin ratio |
48.7 [22.3–106.8] |
48.9 [20.3–133.7] |
0.67 |
| Dopamine (ng/mL) |
0.010 [0.010–0.010] |
0.010 [0.010–0.015] |
<0.001 |
| Norepinephrine (ng/mL) |
0.22 [0.14–0.32] |
0.25 [0.17–0.39] |
<0.001 |
| Epinephrine (ng/mL) |
0.015 [0.010–0.027] |
0.022 [0.012–0.035] |
<0.001 |
| hs-Troponin T (pg/mL) |
0.018 [0.006–0.341] |
0.072 [0.014–0.703] |
<0.001 |
| hs-CRP (mg/dL) |
0.13 [0.04–0.55] |
0.35 [0.078–1.08] |
<0.001 |
| Echocardiography |
| LVEF (%) |
67 [59–73] |
55 [42–67] |
<0.001 |
| LA diameter (mm) |
34 [31–38] |
38 [33–42] |
<0.001 |
| LVESD (mm) |
28 [25–32] |
34 [27–41] |
<0.001 |
| LVEDD (mm) |
45 [42–49] |
48 [44–53] |
<0.001 |
| Mitral peak E wave velocity (cm/s) |
59 [50–70] |
67 [52–86] |
<0.001 |
| Mitral peak A wave velocity (cm/s) |
73 [61–86] |
78 [58–94] |
0.03 |
| NYHA HF classification |
|
|
<0.001 |
| Class I |
275 (63.2) |
168 (40.6) |
|
| Class II |
95 (21.8) |
100 (24.2) |
|
| Class III |
36 (8.3) |
87 (21.0) |
|
| Class IV |
29 (6.7) |
59 (14.3) |
|
| Medications |
| Aspirin |
423 (97.2) |
404 (97.6) |
0.83 |
| Warfarin |
24 (5.5) |
105 (25.4) |
<0.001 |
| DOAC |
5 (1.1) |
25 (6.0) |
<0.001 |
| β-blocker |
136 (31.3) |
211 (51.0) |
<0.001 |
| CCB |
213 (49.0) |
130 (31.4) |
<0.001 |
| ACEI/ARB |
204 (46.9) |
225 (54.3) |
0.03 |
| Statin |
313 (72.0) |
221 (53.4) |
<0.001 |
| Insulin |
29 (6.7) |
18 (4.3) |
0.18 |
| DPP4-I |
65 (14.9) |
61 (14.7) |
1.00 |
| SGLT2-I |
1 (0.2) |
1.0 (0.2) |
1.00 |
| Loop diuretics |
14 (3.2) |
113 (27.3) |
<0.001 |
| Spironolactone |
7 (1.6) |
55 (13.3) |
<0.001 |
| Thiazide |
10 (2.3) |
11 (2.7) |
0.83 |
| Amiodarone |
3 (0.7) |
10 (2.4) |
0.05 |
| Digitalis |
0 (0.0) |
4 (1.0) |
0.06 |
| PCI variables |
| ACS |
226 (52.0) |
259 (62.6) |
0.002 |
| Rota |
15 (3.4) |
24 (5.8) |
0.14 |
| IABP |
8 (1.8) |
42 (10.1) |
<0.001 |
| Use of DES |
319 (73.3) |
284 (68.6) |
0.13 |
| Stent diameter (mm) |
3.0 [3.0–3.5] |
3.0 [3.0–3.5] |
0.31 |
| Stent length (mm) |
23 [18–33] |
23 [16–32] |
0.63 |
Unless indicated otherwise, data are expressed as the median (interquartile range) or n (%). SGLT2-I, sodium-glucose cotransporter 2 inhibitor. Other abbreviations as in Table 1.
With regard to laboratory measurements, hemoglobin, lipid profiles, eGFR, renin, and aldosterone levels were significantly lower, whereas ANP, BNP, catecholamine, high-sensitivity cardiac troponin T, and high-sensitivity C-reactive protein (hs-CRP) levels were significantly higher in the group with NPI values higher than the cut-off. Among the echocardiographic parameters, LVEF was significantly lower, whereas LAD, LVESD, LVEDD, mitral peak E wave velocity, and mitral peak A wave velocity were significantly larger and higher in the group with NPI values higher than the cut-off (Table 2). Furthermore, the NYHA class was significantly worse in the group with NPI values higher than the cut-off (Table 2).
With regard to medications, calcium channel blockers and statins were rarely used in the group with NPI values higher than the cut-off. The use of warfarin, direct oral anticoagulants, β-blockers, angiotensin-converting enzyme inhibitors, angiotensin II receptor blockers, loop diuretics, and spironolactone was significantly more frequent in the group with NPI values higher than the cut-off. Finally, ACS and IABP use were significantly higher in the group with NPI values higher than the cut-off (Table 2).
These results were consistent when the patients were divided into ACS and non-ACS groups, and were particularly pronounced in ACS patients (Supplementary Table 1).
Risk Evaluations of Clinical Parameters and MACE Occurrence
In the univariable COX proportional hazard regression analysis, there was a significant increase in risk for elderly patients, those with hypertension, PAD, previous HF, higher ANP, BNP, NPI, renin, or hs-CRP levels, larger LAD or LVESD, higher mitral peak A wave velocity, higher NYHA classifications, and the use of loop diuretics, amiodarone, rotablator, or IABP. In contrast, there was a significant risk reduction for patients with higher BMI, hemoglobin, fasting blood glucose, triglycerides, low-density lipoprotein cholesterol, eGFR, or LVEF levels, and those using calcium channel blockers or statins (Supplementary Table 2).
In the multivariable COX proportional hazard regression analysis, there was a significant increase in risk for elderly patients, those with PAD, current smoking status, and higher NPI levels. Furthermore, there was a significant reduction in risk for patients with higher eGFR levels (Supplementary Table 2).
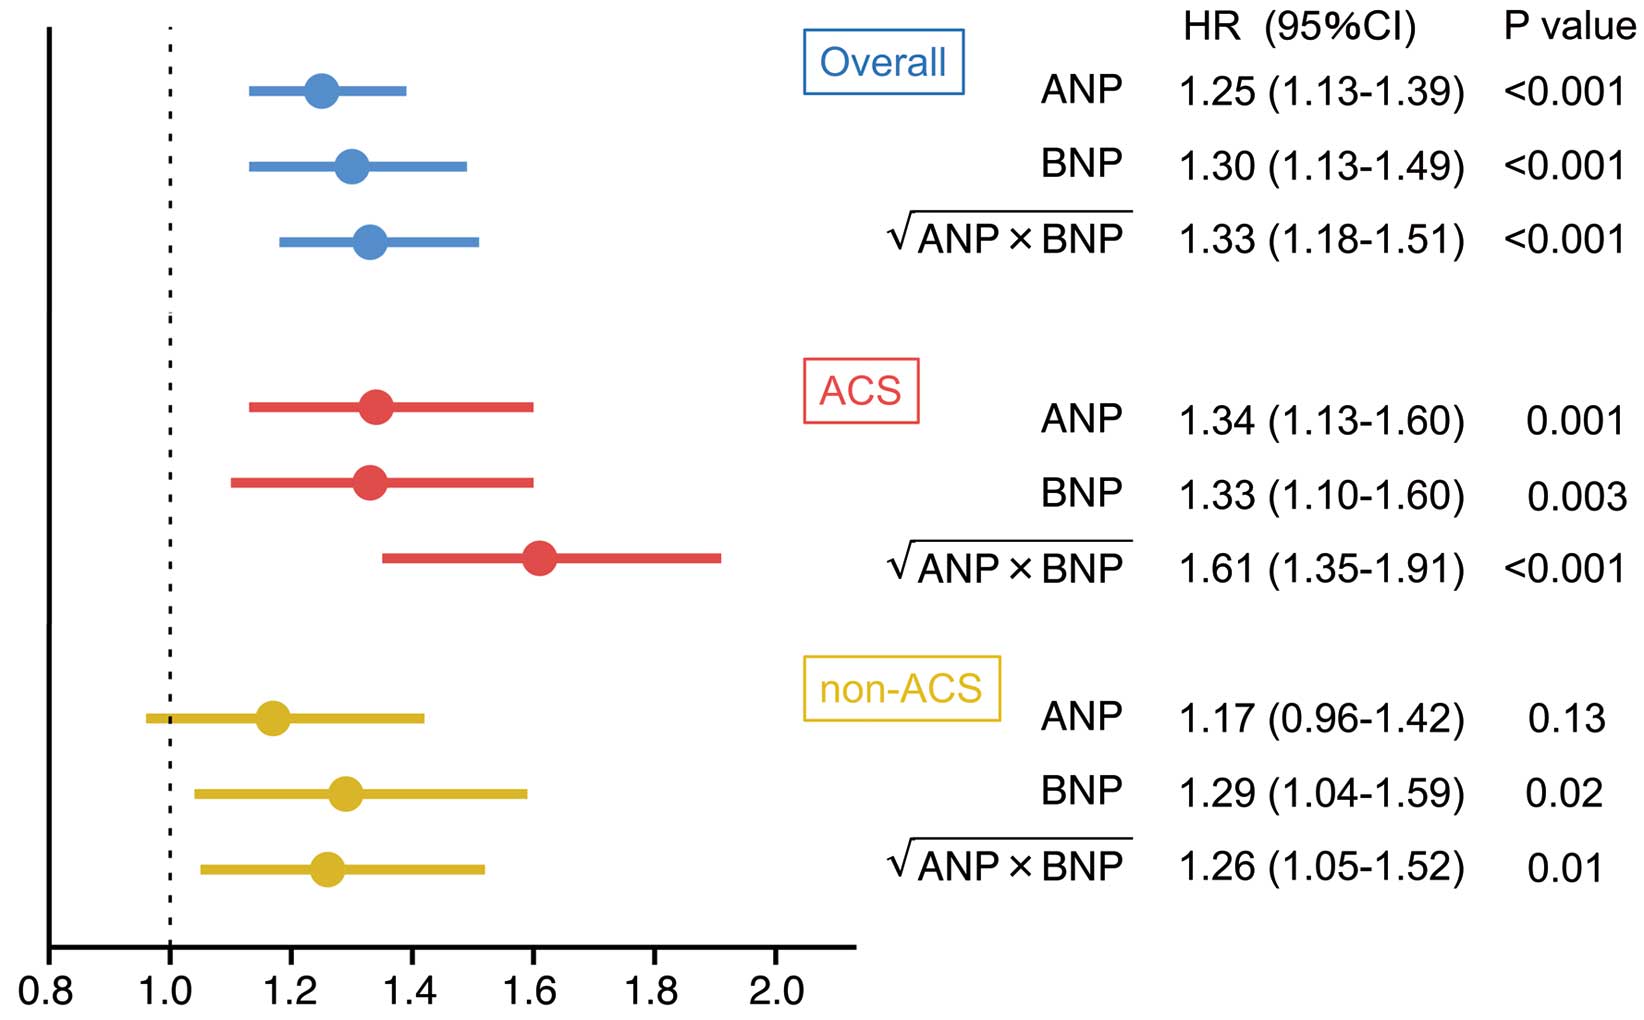
NPI, ANP, and BNP were included in the same multivariable model, and HRs were calculated. NPI had the highest HR (1.33; 95% CI 1.18–1.51; P<0.001) compared with ANP and BNP (HR 1.25 [95% CI 1.13–1.39; P<0.001] and 1.30 [95% CI 1.13–1.49; P<0.001], respectively; Figure 3). Furthermore, NPI was consistently found to be a significant independent predictor when the study group was stratified into ACS and non-ACS patients (HR 1.61 [95% CI 1.35–1.91; P<0.001] and 1.26 [95% CI 1.05–1.52; P=0.01], respectively; Figure 3). The results of multivariable analysis including NPI stratified according to the presence of ACS are presented in Supplementary Table 3.
Relationship Between NPI Levels and MACE Occurrence
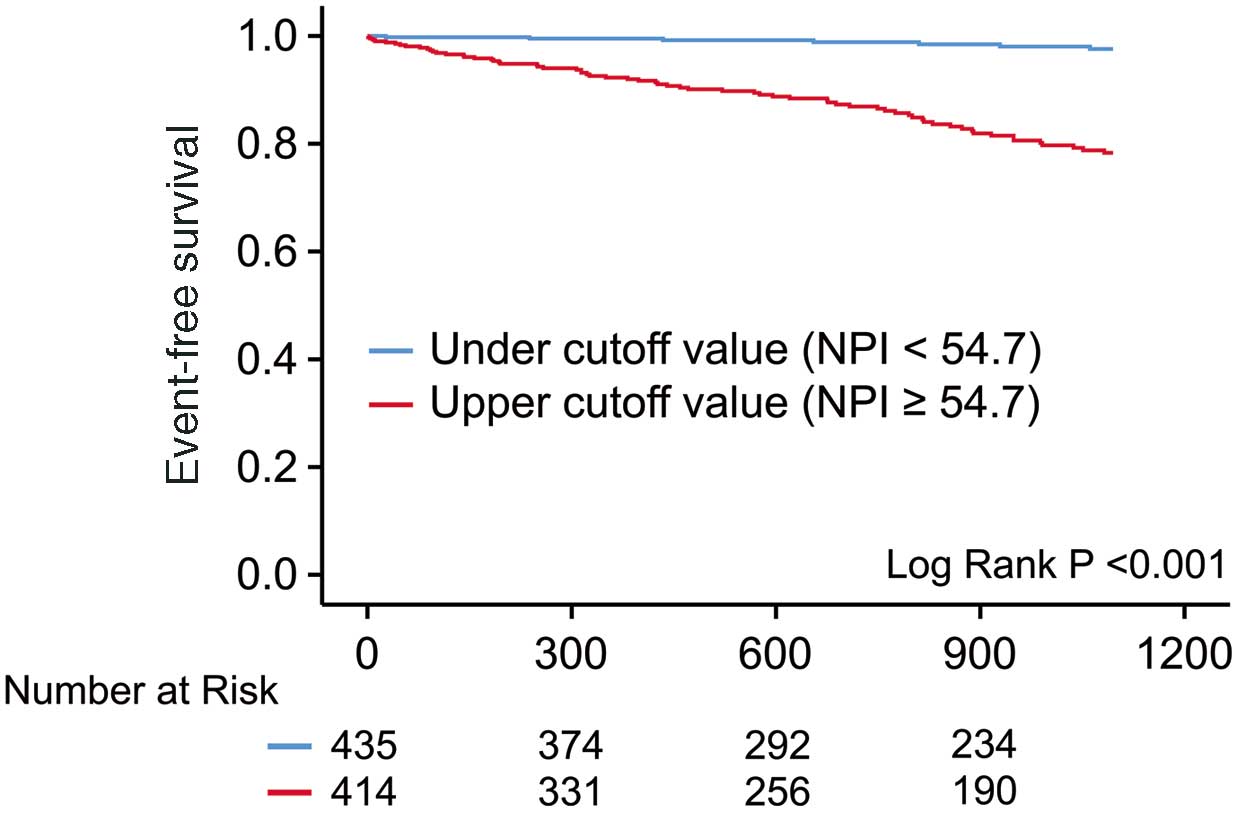
Kaplan-Meier analysis showed a significantly higher incidence of MACE in patients with NPI values higher than the cut-off than in those with NPI values lower than the cut-off (log-rank test, P<0.001). The 3-year event-free survival rates for MACE in the groups with NPI values lower and higher than the cut-off were 98.3% and 84.1%, respectively (Figure 4).
Discussion
In this study, we report the usefulness of NPI as a new index for predicting prognosis after PCI. The proposed novel index integrated both ANP and BNP concentrations, was convenient to calculate, and showed a significant predictive value for MACE occurrence in PCI patients.
Although a previous study tried to integrate these 2 markers by calculating the ratio of ANP to BNP, a serious limitation of the clinical evaluation of the ANP/BNP ratio was the calculation of the ratio itself. It is difficult to numerically separate a group with low ANP and low BNP from a group with high ANP and high BNP. For example, the clinical appearance of a patient with an ANP concentration of 11.6 pg/mL and a BNP concentration of 30.7 pg/mL is very different to that of a patient with an ANP concentration of 665 pg/mL and a BNP concentration of 1,763 pg/mL. However, both patients have an ANP/BNP ratio of 0.38 and would be evaluated as the same using that index. Due to this major drawback, there are fewer reports on ANP/BNP ratios than on ANP or BNP alone, or on the ratio of the N-terminal fragments of pro-ANP or pro-BNP to ANP or BNP. There is considerable variance in ANP and BNP, and taking the product of them results in an even larger variance, which is inconvenient. Taking the square root of the product reduces dispersion and facilitates handling. Furthermore, taking the square root of the product has the advantage of allowing us to consider the same dimensions of ANP and BNP units.
Previous studies have reported the prognostic value of ANP and BNP concentrations after PCI,32,33 and the results for the NPI were consistent with these studies. The association between the NPI and each of the clinical parameters evaluated was significantly related to various factors. In normal subjects, ANP and BNP concentrations increase with age,34,35 and patients with a high NPI in the present study were significantly older, which is consistent with previous reports. The concentrations of natriuretic peptides are also affected by sex, being higher in females,34,35 which was also seen in the present study. Furthermore, BNP is known to be inversely related to BMI,36 and a similar relationship was observed with NPI. In addition, both ANP and BNP concentrations are significantly higher in patients with AF, whether paroxysmal or persistent, than in patients with sinus rhythm37,38 and decrease with a return to sinus rhythm.37 The rate of anticoagulation and the use of β-blockers was also significantly higher in patients with a high NPI. The association between anticoagulants and β-blockers and NPI may be because anticoagulant therapy is often administered to patients with AF and β-blockers may be used as antiarrhythmic agents.
In patients with HF, natriuretic peptides are known to be elevated, and are thus widely used as diagnostic tools,16,22 as well as a markers for prognosis prediction.13,39 In the present study, patients in the high NPI group also had significantly more frequent HF and a poorer NYHA classification. For these reasons, the rate of use angiotensin-converting enzyme inhibitors and angiotensin receptor blockers as anti-HF drugs was higher in the high NPI group. The rate of diuretic use was also higher in the high NPI group for the same reason.
In the present study, hemoglobin levels were significantly lower in the high NPI group. Natriuretic peptide secretion is affected by anemia,39,40 and is significantly higher in anemic patients. This is explained by the increased secretion of natriuretic peptides due to increased venous return as a result of vasodilation caused by anemia,40 which we suspect may apply to the present study as well.
A significant inverse relationship between natriuretic peptides and lipids has been reported previously. This was explained by the fact that natriuretic peptides promote mitochondrial metabolism and energy expenditure in skeletal muscles and adipocytes.41–43 ANP and BNP are known to stimulate catecholamine secretion13,44 and, in the present study, catecholamine levels were significantly higher in patients with high NPI. Furthermore, an inverse relationship between renin-aldosterone concentrations and natriuretic peptide has been reported in healthy subjects.45
Among the echocardiographic findings, there was a significant association between echocardiographic parameters and NPI, which may be due to the stimulation of atrial and ventricular wall stretching,3,4 resulting in elevated natriuretic peptide concentrations. Natriuretic peptides have been reported to be elevated not only in systolic dysfunction, but also in early diastolic dysfunction with normal cardiac contractions,46 which may be reflected by transmitral flow.
Furthermore, natriuretic peptide secretion is enhanced by various severe critical illnesses, as well as by cardiac ischemic injury.47 In the present study, patients with ACS had significantly high NPI than non-ACS patients (median 57.8 [IQR 29.4–12.8] vs. 45.0 [IQR 21.0–100.7], respectively; P<0.001). Even after stratifying patients into ACS and non-ACS groups, the results using the NPI cut-off value were consistent with the overall results. Moreover, patients in intensive care with low BNP concentrations had less cardiogenic shock than patients with high BNP concentrations,48 which may explain the difference in the use of IABP between groups with high and low NPI levels.
In the univariable analysis, NPI was a significant risk indicator for event occurrence after PCI. It was also found to be an independent predictor of other clinical parameters in the multivariable analysis. Evaluation of multivariable models including each natriuretic peptide also showed that NPI was the strongest predictor of adverse events after PCI compared with the natriuretic peptides alone.
ANP and BNP are similar humoral factors but differ slightly in their secretory background and prognostic value. Although both ANP and BNP are powerful indicators, the NPI was found to be more powerful in predicting future adverse events. Similar to ANP and BNP, the NPI may be prognostic not only after PCI, but also in various cardiovascular diseases. This new index is expected to be widely used clinically because it encompasses the advantages of both ANP and BNP as clinical indices. Furthermore, N-terminal pro BNP is regulated by various factors,49 and the relationship between these factors and NPI should be clarified in the future. Finally, this factor is expected to be dynamic during treatment, and further research is needed to better assess at what stage of treatment it should be measured.
Study Limitations
This study has several limitations. First, because it was a retrospective study and not randomized, the possibility of a selection bias should be considered, even when regarding the multivariable analysis. Although the possibility of selection bias cannot be ruled out, the results of this study are consistent with those of previous studies. Second, ANP and BNP concentrations are influenced by a broad range clinical factors, not just those listed above. Therefore, there may be many unmeasured confounders. However, ANP and BNP are well-known prognostic clinical indices, and the NPI, which integrates them, may be an index that efficiently combines the effects of these various unmeasured factors. Further, several established risk factors, including the lipid profile and glucose levels, have an inverse relationship with MACE occurrence. It has also been found that intensive secondary prevention is more likely to be initiated in patients with several risk factors.50 These facts may influence the results of this study. In addition, in this study, some medical treatments were insufficient, such as lipid management at discharge. One of reasons for this is that the study period includes a time when secondary prevention guidelines were not as strict as they are today. In particular, until revisions were made in 2017, previous guidelines for the treatment of secondary prevention of cardiovascular disease stated that the goal for LDL-C control should be <100 mg/dL.51 It is possible that this resulted in the insufficient introduction of the aggressive optimal medical therapy that is now widely used. Strict modern secondary prevention treatment may affect the outcome. Finally, angiotensin receptor-neprilysin inhibitor (ARNI) was not approved in Japan during the study period, which may affect the results now that ARNI is available. Further studies are needed to investigate the association between ARNI and NPI.
Conclusions
NPI was more powerful than ANP and BNP in predicting future adverse events after PCI.
Acknowledgments / Sources of Funding
None.
Disclosures
All authors declare no conflict of interest.
IRB Information
This study was granted an exemption from requiring ethics approval by the University of Yamanashi Ethics Committee because it was a retrospective observational study.
Data Availability
The deidentified participant data will not be shared.
Supplementary Files
Please find supplementary file(s);
https://doi.org/10.1253/circj.CJ-22-0531
References
- 1.
Kangawa K, Matsuo H. Purification and complete amino acid sequence of alpha-human atrial natriuretic polypeptide (alpha-hANP). Biochem Biophys Res Commun 1984; 118: 131–139.
- 2.
Mukoyama M, Nakao K, Hosoda K, Suga S, Saito Y, Ogawa Y, et al. Brain natriuretic peptide as a novel cardiac hormone in humans: Evidence for an exquisite dual natriuretic peptide system, atrial natriuretic peptide and brain natriuretic peptide. J Clin Invest 1991; 87: 1402–1412.
- 3.
Debinski W, Kuchel O, Buu NT. Atrial natriuretic factor is a new neuromodulatory peptide. Neuroscience 1990; 36: 15–20.
- 4.
Blaauw E, van Nieuwenhoven FA, Willemsen P, Delhaas T, Prinzen FW, Snoeckx LH, et al. Stretch-induced hypertrophy of isolated adult rabbit cardiomyocytes. Am J Physiol Heart Circ Physiol 2010; 299: H780–H787.
- 5.
Ruskoaho H, Kinnunen P, Taskinen T, Vuolteenaho O, Leppäluoto J, Takala TE. Regulation of ventricular atrial natriuretic peptide release in hypertrophied rat myocardium: Effects of exercise. Circulation 1989; 80: 390–400.
- 6.
Thibault G, Nemer M, Drouin J, Lavigne JP, Ding J, Charbonneau C, et al. Ventricles as a major site of atrial natriuretic factor synthesis and release in cardiomyopathic hamsters with heart failure. Circ Res 1989; 65: 71–82.
- 7.
Theilig F, Wu Q. ANP-induced signaling cascade and its implications in renal pathophysiology. Am J Physiol Renal Physiol 2015; 308: F1047–F1055.
- 8.
Mori T, Chen YF, Feng JA, Hayashi T, Oparil S, Perry GJ. Volume overload results in exaggerated cardiac hypertrophy in the atrial natriuretic peptide knockout mouse. Cardiovasc Res 2004; 61: 771–779.
- 9.
Tamura N, Ogawa Y, Chusho H, Nakamura K, Nakao K, Suda M, et al. Cardiac fibrosis in mice lacking brain natriuretic peptide. Proc Natl Acad Sci USA 2000; 97: 4239–4244, doi:10.1073/pnas.070371497.
- 10.
Steinhelper ME, Cochrane KL, Field LJ. Hypotension in transgenic mice expressing atrial natriuretic factor fusion genes. Hypertension 1990; 16: 301–307.
- 11.
Lopez MJ, Wong SK, Kishimoto I, Dubois S, Mach V, Friesen J, et al. Salt-resistant hypertension in mice lacking the guanylyl cyclase-A receptor for atrial natriuretic peptide. Nature 1995; 378: 65–68.
- 12.
Tokudome T, Horio T, Kishimoto I, Soeki T, Mori K, Kawano Y, et al. Calcineurin-nuclear factor of activated T cells pathway-dependent cardiac remodeling in mice deficient in guanylyl cyclase A, a receptor for atrial and brain natriuretic peptides. Circulation 2005; 111: 3095–3104.
- 13.
Gottlieb SS, Kukin ML, Ahern D, Packer M. Prognostic importance of atrial natriuretic peptide in patients with chronic heart failure. J Am Coll Cardiol 1989; 13: 1534–1539.
- 14.
Rouleau JL, Packer M, Moyé L, de Champlain J, Bichet D, Klein M, et al. Prognostic value of neurohumoral activation in patients with an acute myocardial infarction: Effect of captopril. J Am Coll Cardiol 1994; 24: 583–591.
- 15.
Morita E, Yasue H, Yoshimura M, Ogawa H, Jougasaki M, Matsumura T, et al. Increased plasma levels of brain natriuretic peptide in patients with acute myocardial infarction. Circulation 1993; 88: 82–91.
- 16.
Mukoyama M, Nakao K, Saito Y, Ogawa Y, Hosoda K, Suga S, et al. Increased human brain natriuretic peptide in congestive heart failure. N Engl J Med 1990; 323: 757–758.
- 17.
Omland T, Bonarjee VV, Lie RT, Caidahl K. Neurohumoral measurements as indicators of long-term prognosis after acute myocardial infarction. Am J Cardiol 1995; 76: 230–235.
- 18.
Sumida H, Yasue H, Yoshimura M, Okumura K, Ogawa H, Kugiyama K, et al. Comparison of secretion pattern between A-type and B-type natriuretic peptides in patients with old myocardial infarction. J Am Coll Cardiol 1995; 25: 1105–1110.
- 19.
Jernberg T, Stridsberg M, Venge P, Lindahl B. N-terminal pro brain natriuretic peptide on admission for early risk stratification of patients with chest pain and no ST-segment elevation. J Am Coll Cardiol 2002; 40: 437–445.
- 20.
Omland T, Persson A, Ng L, O’Brien R, Karlsson T, Herlitz J, et al. N-terminal pro-B-type natriuretic peptide and long-term mortality in acute coronary syndromes. Circulation 2002; 106: 2913–2918.
- 21.
McDonagh TA, Cunningham AD, Morrison CE, McMurray JJ, Ford I, Morton JJ, et al. Left ventricular dysfunction, natriuretic peptides, and mortality in an urban population. Heart 2001; 86: 21–26.
- 22.
Ruskoaho H. Cardiac hormones as diagnostic tools in heart failure. Endocr Rev 2003; 24: 341–356.
- 23.
Yoshimura M, Yasue H, Okumura K, Ogawa H, Jougasaki M, Mukoyama M, et al. Different secretion patterns of atrial natriuretic peptide and brain natriuretic peptide in patients with congestive heart failure. Circulation 1993; 87: 464–469.
- 24.
Sato M, Mikamo A, Kurazumi H, Suzuki R, Murakami M, Kobayashi T, et al. Ratio of preoperative atrial natriuretic peptide to brain natriuretic peptide predicts the outcome of the maze procedure in mitral valve disease. J Cardiothorac Surg 2013; 8: 32.
- 25.
Sato T, Iwai-Takano M, Misaka T, Yoshihisa A, Ishibashi T, Takeishi Y. Change of ANP/BNP by exercise is an index of cardiac functional reserve in patient with chronic heart failure. J Card Fail 2009; 15(Suppl): S153.
- 26.
Nagaya N, Nishikimi T, Okano Y, Uematsu M, Satoh T, Kyotani S, et al. Plasma brain natriuretic peptide levels increase in proportion to the extent of right ventricular dysfunction in pulmonary hypertension. J Am Coll Cardiol 1998; 31: 202–208.
- 27.
Shiroto H, Tomita H, Hagii J, Metoki N, Fujita A, Kamada T, et al. Impact of atrial natriuretic peptide value for predicting paroxysmal atrial fibrillation in ischemic stroke patients. J Stroke Cerebrovasc Dis 2017; 26: 772–778.
- 28.
Expert Panel on Detection, Evaluation, and Treatment of High Blood Cholesterol in Adults. Executive summary of the third report of the National Cholesterol Education Program (NCEP) Expert Panel on Detection, Evaluation, And Treatment of High Blood Cholesterol In Adults (Adult Treatment Panel III). JAMA 2001; 285: 2486–2497.
- 29.
Clearfield M, Pearce M, Nibbe Y, Crotty D, Wagner A. The “New Deadly Quartet” for cardiovascular disease in the 21st century: Obesity, metabolic syndrome, inflammation and climate change: How does statin therapy fit into this equation? Curr Atheroscler Rep 2014; 16: 380.
- 30.
Matsuo S, Imai E, Horio M, Yasuda Y, Tomita K, Nitta K, et al. Revised equations for estimated GFR from serum creatinine in Japan. Am J Kidney Dis 2009; 53: 982–992.
- 31.
Bohula EA, Morrow DA, Giugliano RP, Blazing MA, He P, Park JG, et al. Atherothrombotic risk stratification and ezetimibe for secondary prevention. J Am Coll Cardiol 2017; 69: 911–921.
- 32.
Kragelund C, Grønning B, Køber L, Hildebrandt P, Steffensen R. N-terminal pro-B-type natriuretic peptide and long-term mortality in stable coronary heart disease. N Engl J Med 2005; 352: 666–675.
- 33.
Squire IB, O’Brien RJ, Demme B, Davies JE, Ng LL. N-terminal pro-atrial natriuretic peptide (N-ANP) and N-terminal pro-B-type natriuretic peptide (N-BNP) in the prediction of death and heart failure in unselected patients following acute myocardial infarction. Clin Sci (Lond) 2004; 107: 309–316.
- 34.
Clark BA, Elahi D, Epstein FH. The influence of gender, age, and the menstrual cycle on plasma atrial natriuretic peptide. J Clin Endocrinol Metab 1990; 70: 349–352.
- 35.
Redfield MM, Rodeheffer RJ, Jacobsen SJ, Mahoney DW, Bailey KR, Burnett JC. Plasma brain natriuretic peptide concentration: Impact of age and gender. J Am Coll Cardiol 2002; 40: 976–982.
- 36.
McCord J, Mundy BJ, Hudson MP, Maisel AS, Hollander JE, Abraham WT, et al. Relationship between obesity and B-type natriuretic peptide levels. Arch Intern Med 2004; 164: 2247–2252.
- 37.
Inoue S, Murakami Y, Sano K, Katoh H, Shimada T. Atrium as a source of brain natriuretic polypeptide in patients with atrial fibrillation. J Card Fail 2000; 6: 92–96.
- 38.
Therkelsen SK, Groenning BA, Kjaer A, Svendsen JH, Boje Jensen G. ANP and BNP in atrial fibrillation before and after cardioversion – and their relationship to cardiac volume and function. Int J Cardiol 2008; 127: 396–399.
- 39.
Latini R, Masson S, Anand I, Salio M, Hester A, Judd D, et al. The comparative prognostic value of plasma neurohormones at baseline in patients with heart failure enrolled in Val-HeFT. Eur Heart J 2004; 25: 292–299.
- 40.
Fukuta H, Ohte N, Mukai S, Saeki T, Kobayashi K, Kimura G. Anemia is an independent predictor for elevated plasma levels of natriuretic peptides in patients undergoing cardiac catheterization for coronary artery disease. Circ J 2008; 72: 212–217.
- 41.
He WT, Mori M, Yu XF, Kanda T. Higher BNP levels within physiological range correlate with beneficial nonfasting lipid profiles in the elderly: A cross-sectional study. Lipids Health Dis 2016; 15: 3.
- 42.
Miyashita K, Itoh H, Tsujimoto H, Tamura N, Fukunaga Y, Sone M, et al. Natriuretic peptides/cGMP/cGMP-dependent protein kinase cascades promote muscle mitochondrial biogenesis and prevent obesity. Diabetes 2009; 58: 2880–2892.
- 43.
Spannella F, Giulietti F, Bordicchia M, Burnett JC, Sarzani R. Association between cardiac natriuretic peptides and lipid profile: A systematic review and meta-analysis. Sci Rep 2019; 9: 19178.
- 44.
Grimm G, Resl M, Heinisch BB, Hülsmann M, Luger A, Clodi M, et al. B-Type natriuretic peptide increases cortisol and catecholamine concentrations in healthy subjects. J Appl Physiol (1985) 2017; 122: 1249–1254.
- 45.
Adesanya CO, Anjorin FI, Sada IA, Parry EH, Sagnella GA, MacGregor GA. Atrial natriuretic peptide, aldosterone, and plasma renin activity in peripartum heart failure. Br Heart J 1991; 65: 152–154.
- 46.
Lubien E, DeMaria A, Krishnaswamy P, Clopton P, Koon J, Kazanegra R, et al. Utility of B-natriuretic peptide in detecting diastolic dysfunction: Comparison with Doppler velocity recordings. Circulation 2002; 105: 595–601.
- 47.
Sabatine MS, Morrow DA, de Lemos JA, Omland T, Desai MY, Tanasijevic M, et al. Acute changes in circulating natriuretic peptide levels in relation to myocardial ischemia. J Am Coll Cardiol 2004; 44: 1988–1995.
- 48.
Tung RH, Garcia C, Morss AM, Pino RM, Fifer MA, Thompson BT, et al. Utility of B-type natriuretic peptide for the evaluation of intensive care unit shock. Crit Care Med 2004; 32: 1643–1647.
- 49.
Choi HI, Lee MY, Oh BK, Lee SJ, Kang JG, Lee SH, et al. Effects of age, sex, and obesity on N-terminal pro B-type natriuretic peptide concentrations in the general population. Circ J 2021; 85: 647–654.
- 50.
Steinberg BA, Cannon CP, Hernandez AF, Pan W, Peterson ED, Fonarow GC. Medical therapies and invasive treatments for coronary artery disease by body mass: The “obesity paradox” in the Get With The Guidelines database. Am J Cardiol 2007; 100: 1331–1335.
- 51.
Kinoshita M, Yokote K, Arai H, Iida M, Ishigaki Y, Ishibashi S, et al. Japan Atherosclerosis Society (JAS) guidelines for prevention of atherosclerotic cardiovascular diseases 2017. J Atheroscler Thromb 2018; 25: 846–984.