Abstract
Background:
The influence of glucose fluctuations (GF) on cardiovascular complications of diabetes mellitus (DM) has been attracting much attention. In the present study, whether GF increase susceptibility to ischemia/reperfusion in the heart was investigated.
Methods and Results:
Male rats were randomly assigned to either a control, DM, and DM with GF group. DM was induced by an injection of streptozotocin, and glucose fluctuation was induced by starvation and insulin injection. One sequential program comprised 2 hypoglycemic episodes during 4 days. The isolated hearts were subjected to 20-min ischemia/30-min reperfusion. The infarct size was larger in hearts with GF than those with sustained hyperglycemia. Activities of catalase and superoxide dismutase were decreased, and expressions of NADPH oxidase and thioredoxin-interacting protein were upregulated by GF accompanied by an increase of reactive oxygen species (ROS). Swollen mitochondria with destroyed cristae were observed in diabetic hearts; they were further devastated by GF. Microarray analysis revealed that the expressions of microRNA (miRNA)-200c and miRNA-141 were abundant in those hearts with GF. Overexpression of miRNA-200c and miRNA-141 decreased mitochondrial superoxide dismutase and catalase activities, and increased ROS levels. Meanwhile, knockdown of miRNA-200c and miRNA-141 significantly decreased ROS levels in cardiomyocytes exposed to GF.
Conclusions:
GF increased ROS generation and enhanced ischemia/reperfusion injury in the diabetic heart. Upregulated miRNA-200c and miRNA-141 may account for the increased ROS.
Diabetes mellitus (DM) is one of the most serious health issues in developed countries, and cardiovascular complications are life-threatening.1
The incidence of cardiovascular complications is associated with elevated glycated hemoglobin and fasting glucose levels.2,3
Therefore, intensive glycemic control has been considered an effective way to reduce the risk of cardiovascular complications. However, the optimal goal of glycemic control has been in dispute since publication of the findings from several large-scale trials regarding the prognosis of intensive glycemic control. The Action to Control Cardiovascular Risk in Diabetes (ACCORD) trial revealed that intensive glycemic control targeting a level of glycated hemoglobin <6.0% increased all-cause mortality more than standard therapy, which targeted 7.0–7.9%, and the study was terminated prematurely.4
The Normoglycemia in Intensive Care Evaluation and Survival Using Glucose Algorithm Regulation (NICE-SUGAR) study also demonstrated that intensive glycemic control caused high mortality in patients hospitalized in an intensive care unit.5
Another study showed that spontaneous hypoglycemia increases mortality of patients with acute myocardial infarction.6
Although the mechanisms of these effects remain elusive, an increase in levels of reactive oxygen species (ROS) might be a mechanism of the deleterious outcomes including apoptosis, which was observed in various types of cells caused by glucose fluctuations (GF).7,8
ROS are generated as natural by-products of oxygen metabolism and moderate levels function as intracellular signaling molecules. However, high levels of ROS are detrimental to cardiomyocytes and lead to cell death. Based on these findings, we speculated that drastic variability from hyperglycemia to hypoglycemia or vice versa enhanced the ROS production and may exaggerate myocardial injury more potently than a high glucose level with little fluctuation. Here, we investigated the effect of repeated blood GF on the susceptibility of the heart to ischemia/reperfusion episodes. MicroRNAs (miRNAs) have recently emerged as key factors in various types of heart diseases.9,10
The role of miRNAs in diabetes and its cardiovascular complications has recently attracted considerable attention;11
however, the link between GF and miRNAs has not yet been elucidated. We explored the involvement of miRNAs in the implicated mechanisms of the effects induced by GF.
Methods
All experiments proceeded in accordance with the
Guide for the Care and Use of Laboratory Animals
published by the US National Institutes of Health (NIH Publication No. 85-23, revised 1996) and the animal care guidelines of Oita University.
Primary Culture of Neonatal Rat Cardiomyocytes
Cardiac ventricular myocytes prepared from Sprague-Dawley rats aged 1–3 days were cultured as described.3
In brief, rat pups were euthanized by decapitation and the cardiac ventricles were removed and digested in a trypsin solution (2 mg/ml) at 37℃. The cardiomyocytes were then isolated and cultured in Dulbecco’s Modified Eagle’s Medium (DMEM; Wako, Osaka, Japan), supplemented with 5% fetal bovine serum, penicillin (100 U/ml), streptomycin (100 mg/ml), vitamin B12 (2 µg/ml), and bromodeoxyuridine (0.1 mmol/L).
Exposure of Cardiomyocytes to High and Low Glucose Concentrations
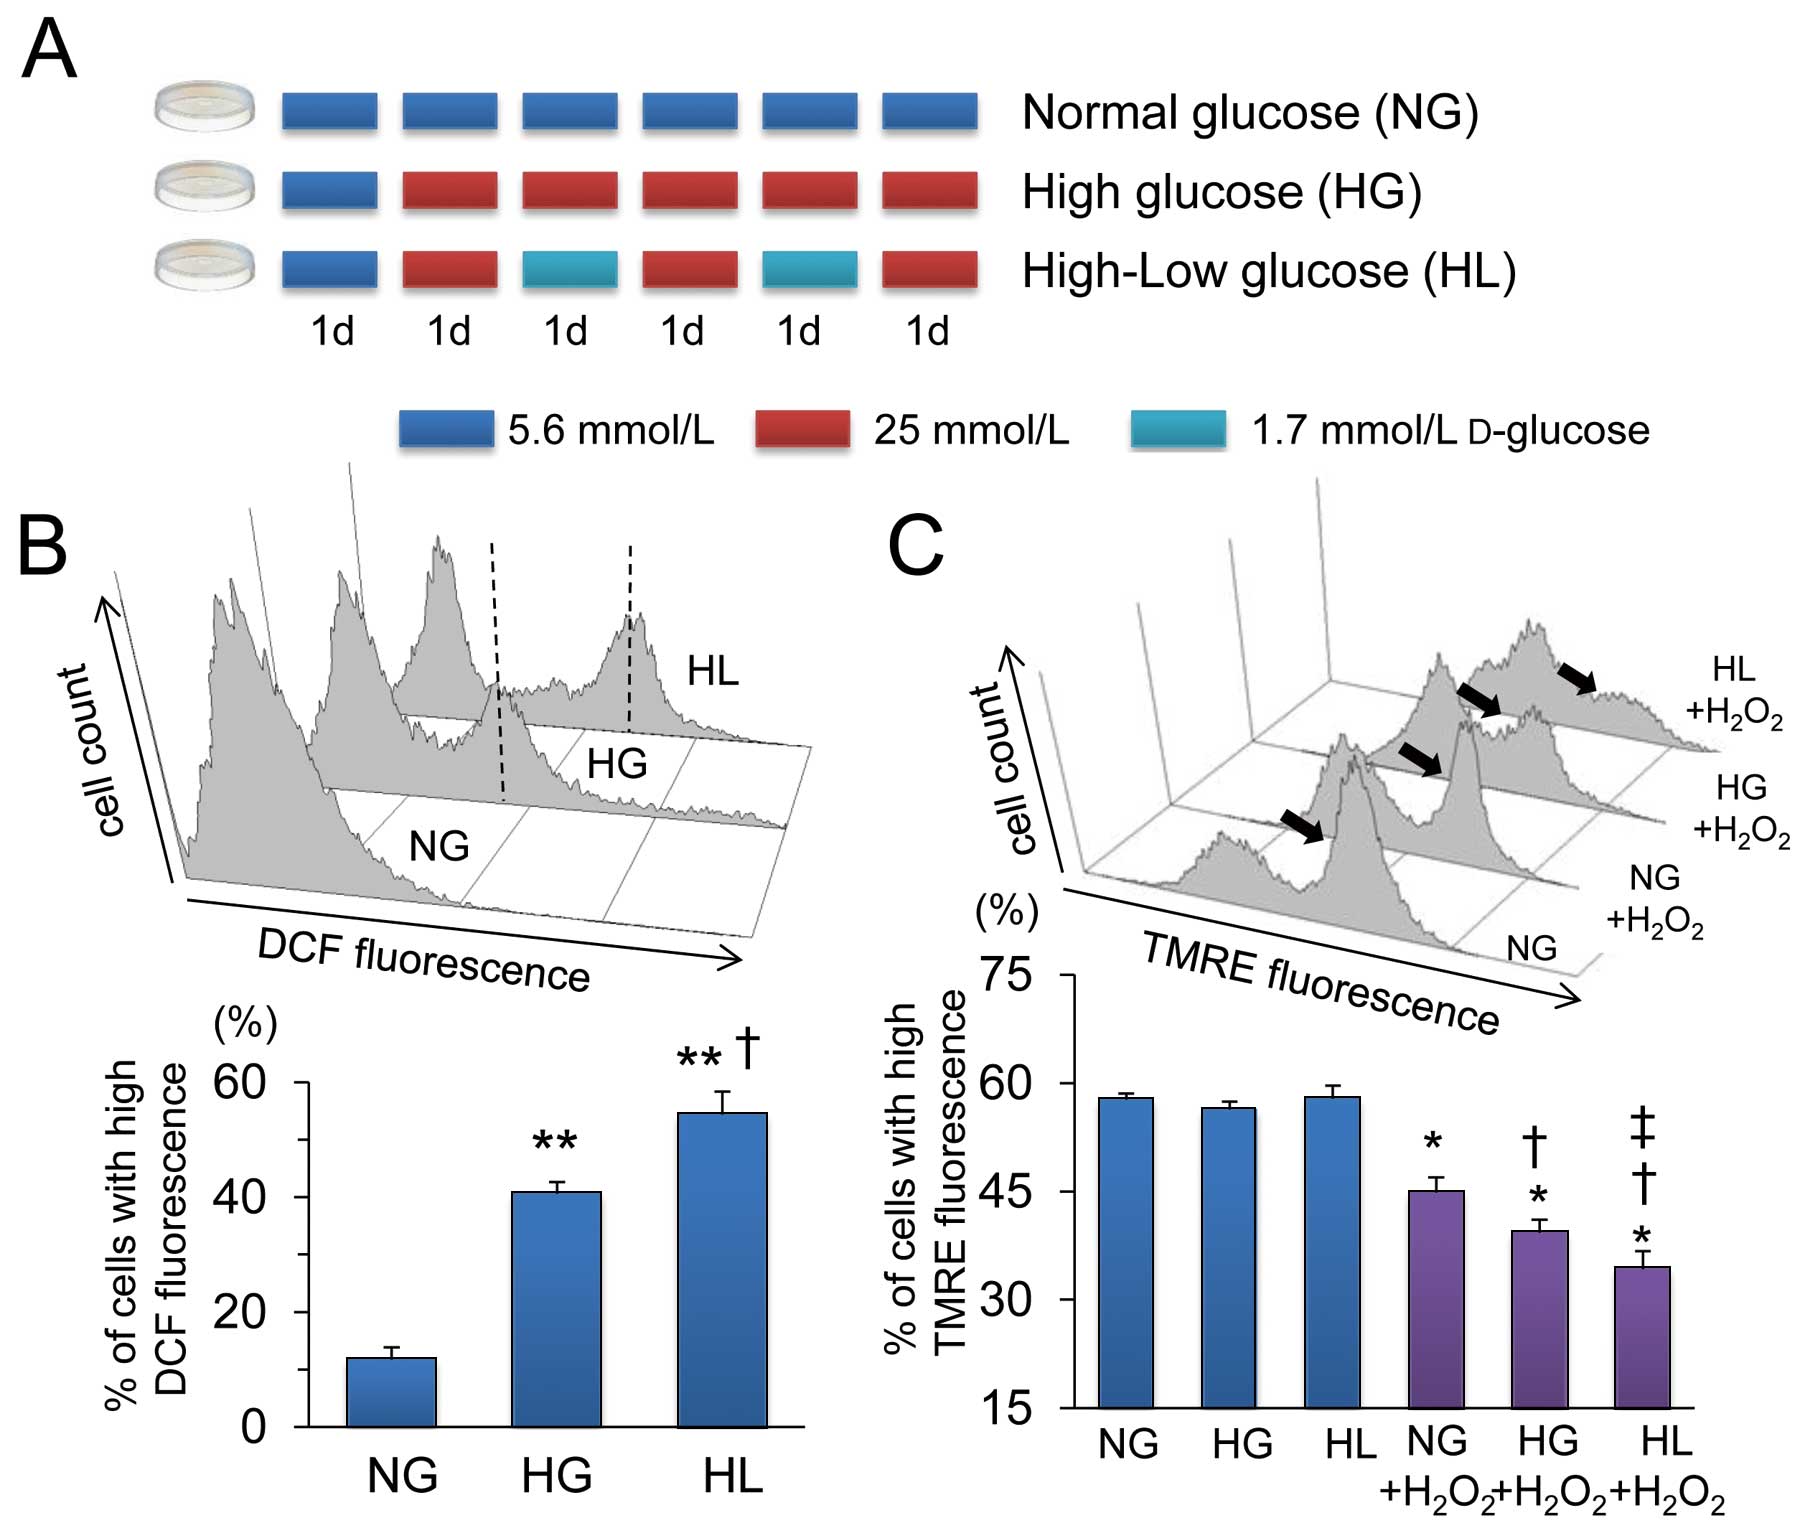
One day (24 h) after isolation, cardiomyocytes were randomly seeded in the following media: DMEM containing a normal (5.6 mmol/L D-glucose+19.4 mmol/L L-glucose) (NG) or a high (25 mmol/L D-glucose) (HG) glucose concentration, or DMEM that was alternately replaced every 24 h with high and low (1.7 mmol/L D-glucose+23.3 mmol/L L-glucose) glucose concentration (HL).
Figure 1A
shows the protocol of medium changes. Osmotic pressure was adjusted by adding the L enantiomer of D-glucose. Cells were incubated in serum-free DMEM for 24 h before the experiments.
Assays of ROS
Levels of ROS in cardiomyocytes were assessed by using fluorescence-activated cell sorting (FACS) analysis. Cardiomyocytes were loaded with 2 µmol/L of CM-H2DCFDA (Invitrogen), incubated at 37℃ for 20 min, harvested by trypsinization and then fluorescence intensity was monitored at 530 nm (FL-1 channel). Data were analyzed using WinMDI analysis software. We also assessed levels of intracellular ROS and mitochondrial superoxide by visually assessing cells stained with CM-H2DCFDA (2 µmol/L) and MitoSOX Red (2 µmol/L) (Invitrogen), respectively, using a confocal laser microscope (Carl Zeiss, Oberkochen, Germany).
Assay of Mitochondrial Inner Membrane Potential
We assayed the mitochondrial inner membrane potential (∆Ψm) of cells stimulated with H2O2
(100 µmol/L) for 30 min to investigate the vulnerability of cardiomyocytes against oxidative stress. Cells were loaded with 100 nmol/L of tetramethylrhodamine ethyl ester (TMRE; Invitrogen, Carlsbad, CA, USA) at 37℃ for 30 min, harvested by trypsinization and analyzed using the FACSCalibur system (Becton Dickinson, Bedford, MA, USA).
Induction of DM and GF in Rats
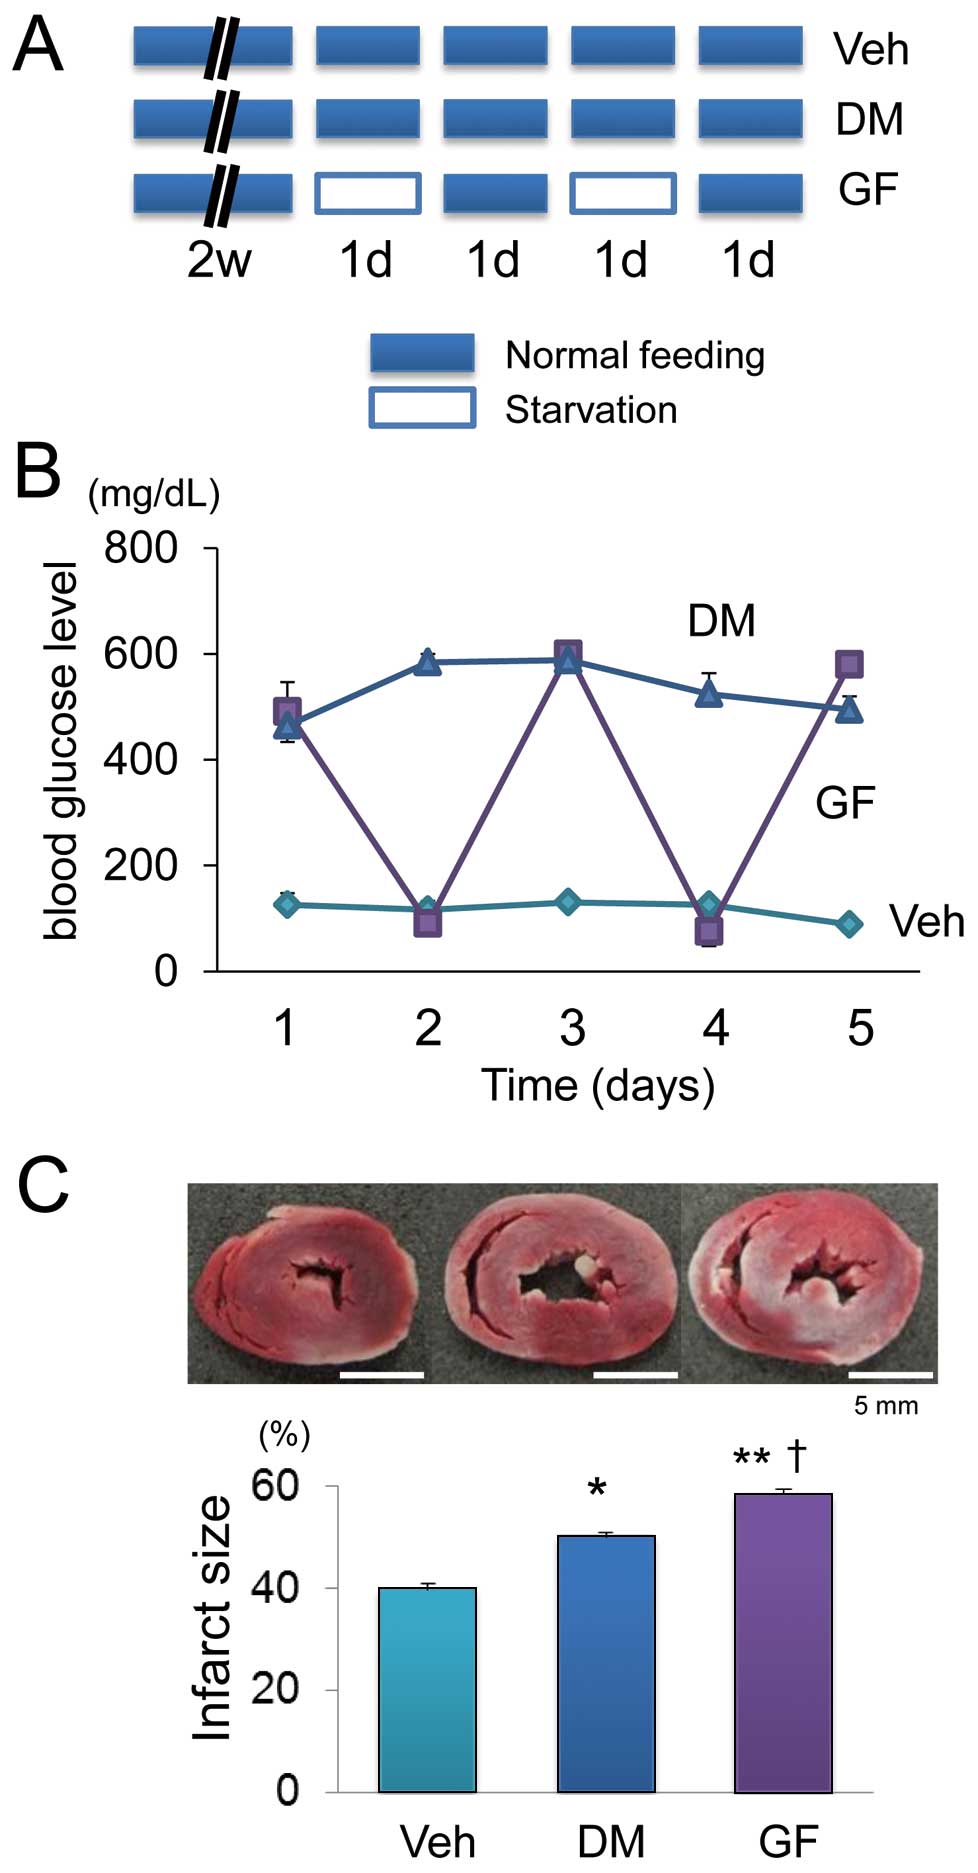
DM was induced in 8-week-old male Sprague-Dawley rats by a single injection of streptozotocin (STZ; 60 mg/kg) dissolved in sterile sodium citrate buffer solution (0.1 mol/L citric acid and 0.2 mol/L sodium phosphate, pH 4.5) into the tail vein. Age-matched rats were injected with an equivalent volume of citrate buffer and assigned to a control group (Veh). Two weeks after the STZ injection, the plasma glucose concentration in the rats was >300 mg/dl and they were randomly assigned to groups with DM, and DM with plasma GF. Glucose fluctuation was induced by 24 h of starvation and if the blood glucose level was >100 mg/dl, insulin (0.5 IU/kg) was intraperitoneally injected to reduce the level to <100 mg/dl. Thereafter, rats were allowed free access to standard pelleted chow for 24 h to increase blood glucose levels. After 24 h of free access to food, rats were starved again to induce hypoglycemia. One sequential program comprised 2 induced hypoglycemic episodes over a period of 4 days (Figure 2A).
The isolated perfused rat heart was studied using Langendorff apparatus. Rats were anesthetized with an intraperitoneal injection of a mixture of ketamine (60 mg/kg) and xylazine (10 mg/kg). The hearts were isolated and perfused in retrograde mode at 37.0℃ under a constant pressure. After stabilization, the hearts were exposed to no-flow global ischemia for 20 min followed by reperfusion for 30 min. At the end of reperfusion, the hearts were rapidly removed from the Langendorff apparatus and snap-frozen at –20℃. All hearts were sliced into 2-mm-thick transverse sections across the long axis of the left ventricles and incubated in 1% triphenyltetrazolium chloride in phosphate buffer (pH 7.4) at 37℃ for 20 min. After fixation by 10% formaldehyde solution for 24 h, infarct areas were determined by planimetry of individual slices. Volumes for each heart were calculated by multiplying each area by the slice thickness and summing them using image analysis software (Image J).
Measurement of Antioxidant Enzyme Activities
Activities of catalase and superoxide dismutase (SOD) were measured colorimetrically according to the manufacturer’s instructions (Cayman Chemical, Ann Arbor, MI, USA).
Assay for Mitochondrial Morphology by Transmission Electron Microscopy
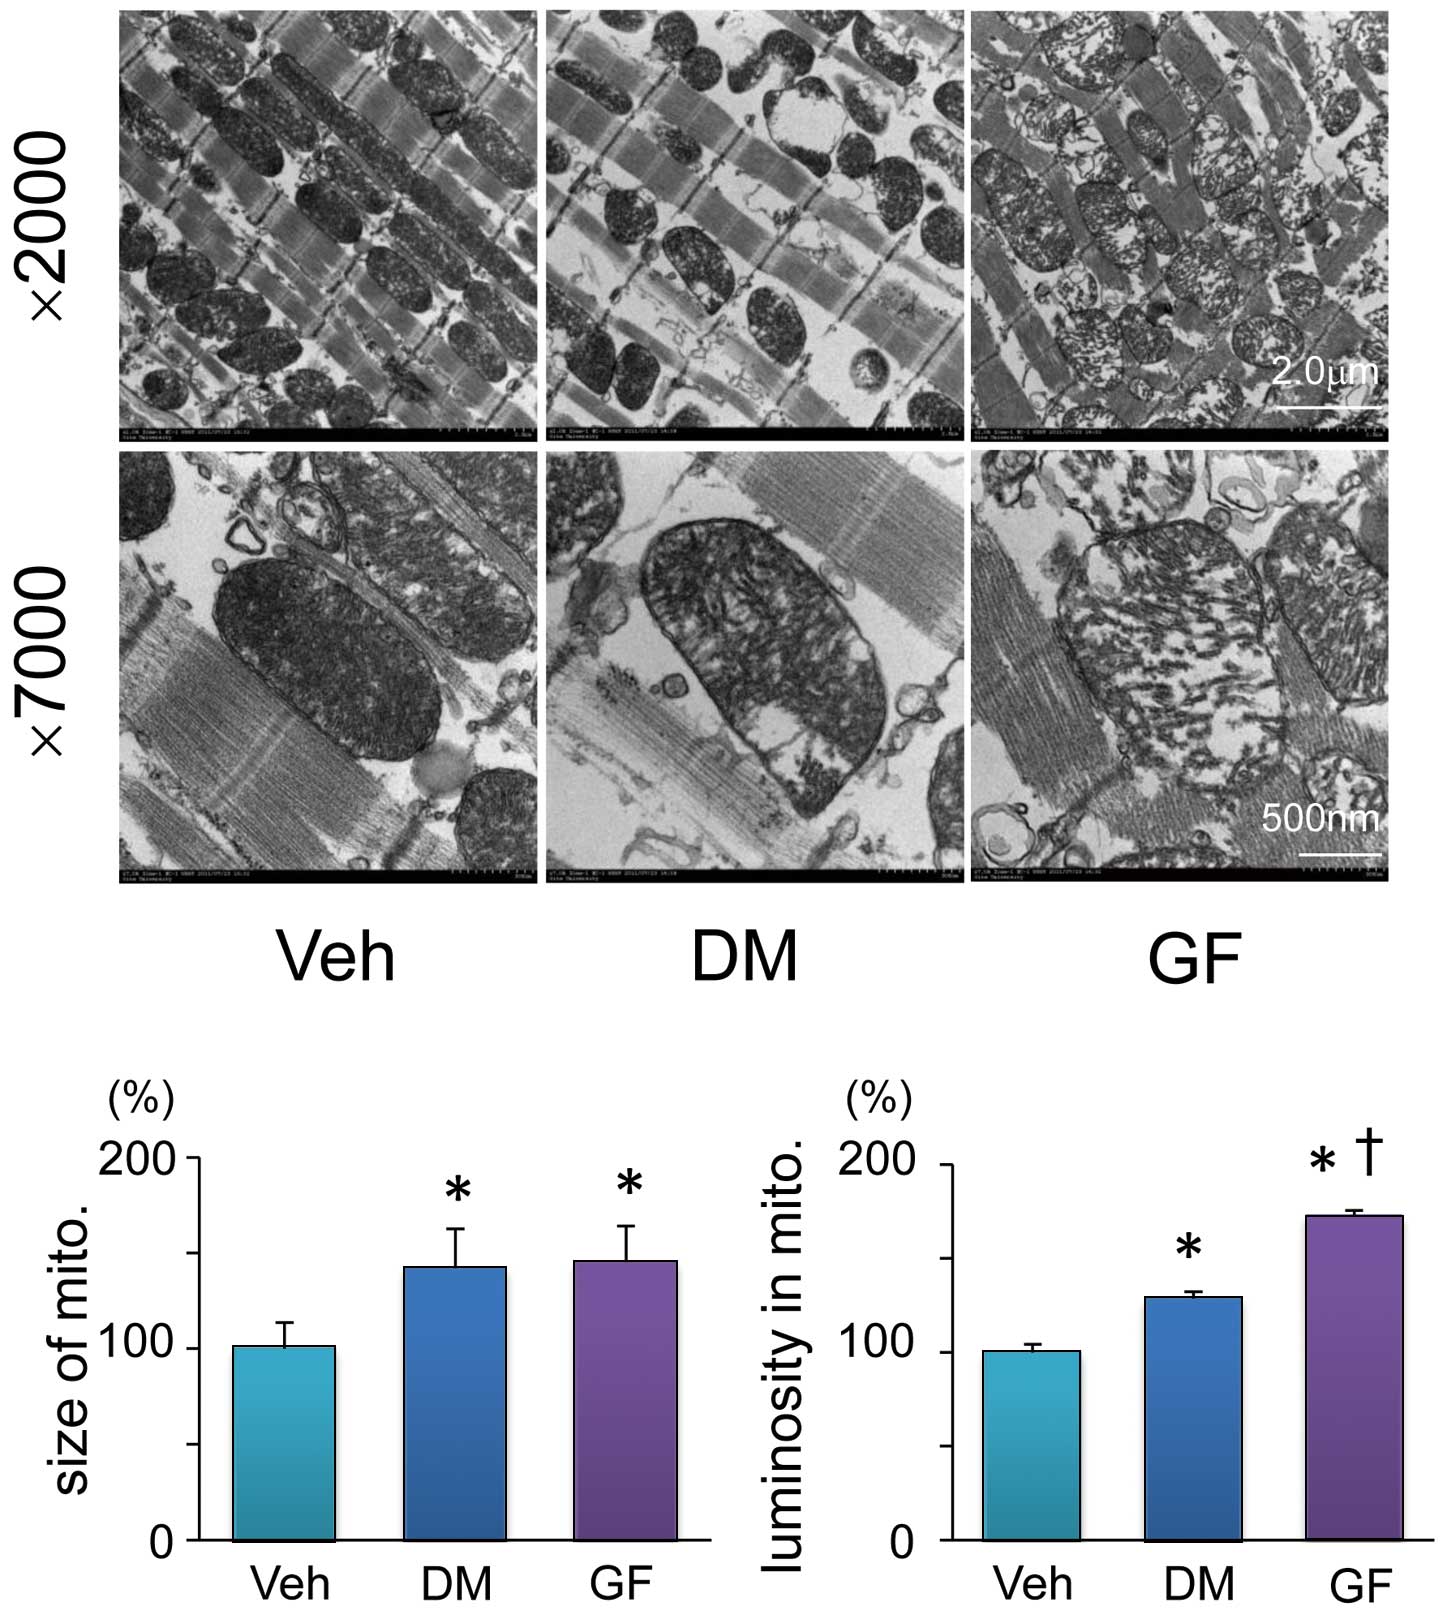
The hearts were cut into small blocks, which were then fixed in cacodylate-buffered (pH 7.4) 2.5% glutaraldehyde and paraformaldehyde at 4℃ for 2 h and postfixed in cacodylate-buffered (pH 7.4) 2% osmium tetroxide/0.5% potassium ferrocyanide at 4℃ for 2 h. The tissue blocks were dehydrated in a graded series of ethanols and embedded in epoxy resin. Ultrathin sections were stained with uranyl acetate and lead citrate and imaged by a transmission electron microscope (JEM-1200EXII; JOEL Ltd, Tokyo, Japan). We measured the size and luminosity of randomly selected 8 mitochondria from each group by tracing each mitochondrion and analyzing inside the region using image analysis software (Image J). Low luminosity of mitochondrion reflects the integrity of cristae and high luminosity indicates the destroyed structure of cristae.12
Microarray Analysis of miRNAs
Total RNA extraction and miRNA microarray experiments proceeded as described.13
Frozen heart tissues were powdered at –70℃ in liquid nitrogen. Total RNA from rat heart was extracted using miRNeasy Mini kits (Qiagen, Hilden, Germany) following the manufacturer’s instructions, and was quantified using a NanoDrop-1000 spectrophotometer. One hundred nanogram (NG) of total RNA was labeled with Cy3 using a miRNA labeling and hybridization kit (Agilent Technologies, Santa Clara, CA, USA) according to the manufacturer’s instructions. After Cy3 labeling, RNA was dried up and re-solved with 18 µl RNase-free water. Then, 4.5 µl of 10× gene expression blocking agent and 22.5 µl of 2× hybridization buffer were added to the RNA sample, and the mixture hybridized to Agilent rat miRNA Microarrays (Grid ID19159, Rat Rel. 10.1; Agilent Technologies) for 20 h at 55℃ in a rotating Agilent hybridization oven. After hybridization, microarrays were washed for 5 min at room temperature with GE Wash Buffer 1 (Agilent Technologies) and 5 min with 37℃ GE Wash buffer 2 (Agilent Technologies). Slides were scanned immediately after washing on the Agilent DNA Microarray Scanner (G2565BA) using a one color scan setting for 8×15k array slides (Scan Area 61×21.6 mm, Scan resolution 5 µm, Dye channel is set to Green and Green photo multiplier tubes is set to 5% and 100%, extended dynamic range scan mode). The scanned images were analyzed with Feature Extraction software 9.5.3.1 (Agilent Technologies) using default parameters (protocol miRNA-v1_95_May07_and_Grid: 019159_D_20081121) to obtain background subtracted processed signal intensities. Features flagged in Feature Extraction software as feature non-uniform outliers were excluded. Data from miRNA microarrays were analyzed using GeneSpring GX software, version 11.5 (Agilent Technologies). After transformation using the settings <1.0 to 1.0, data for a particular miRNA were normalized against the mean of that miRNA in 5 Veh rat hearts, and then filtered based on a raw signal intensity of ≥25.0 (50% of samples represented at least 1 of 3 conditions). Significant changes in miRNA expressions were identified using ANOVA (Welch) and Tukey honestly significant difference post-hoc correction (corrected P <0.05).
Quantitative Reverse Transcriptase-Polymerase Chain Reaction (PCR)
Quantitative PCR for mature miRNAs was performed with a Taqman MicroRNA Reverse Transcription Kit (Applied Biosystems, Foster City, CA, USA). Levels of miRNA (miR)-200c and miR-141 expression relative to snoRNA (Applied Biosystems Assay ID, 001718) were calculated from a standard curve. Amounts of messenger RNA (mRNA) expression for PTK9 were quantified by RT-PCR using a Universal probe library and LightCycler 480 probe master (Roche, Basel, Switzerland) with a TaqMan method. Levels of mRNA expression relative to glyceraldehyde 3-phosphate dehydrogenase were calculated from a standard curve.
Transfection of miRNAs Into Cardiomyocytes
One day after isolation, cardiomyocytes maintained in antibiotic-free DMEM containing 5% fetal bovine serum were transfected with rat-specific pre-miR-200c, pre-miR-141, anti-miR-200c, or anti-miR-141 (Ambion, Austin, TX, USA). Pre-miR precursors and anti-miR miRNA inhibitors were diluted in Opti-MEM at a final concentration of 50 nmol/L using a siPORT NeoFX transfection agent (Ambion), according to the manufacturer’s instructions. The cells were used in experiments at 48 h after transfection. Pre-miR transfection efficiency was confirmed as follows: transfection with a double-stranded RNA oligomer using a BLOCK-iT Alexa Fluor Red Fluorescent Control (Invitrogen) and downregulated expression of protein tyrosine kinase (PTK) 9 by transfection with a synthetic miR-1 miRNA precursor, which is included in the Pre-miR miRNA Starter Kit (Ambion). To detect pre-miR-1 miRNA precursor activity in rat cultured cells, we purchased a rat-specific PTK9 TaqMan Gene Expression Assay (Assay ID, Rn01407564_g1*; Ambion).
Statistical Analysis
Data are expressed as mean±standard error (SE). Multiple comparisons among groups were achieved by one-way analysis of variance and post hoc Fisher’s least-significant difference test with P<0.05 being taken as indicating statistical significance.
Results
Effect of Fluctuating Glucose Levels on Cultured Cardiomyocytes
To determine whether fluctuations in glucose levels directly affect cardiomyocytes, we performed in vitro experiments.
Figure 1B
shows representative histograms and quantitative data obtained by FACS analysis of cardiomyocytes loaded with CM-H2DCFDA. Levels of ROS were significantly increased in HG compared with NG cardiomyocytes, and more augmented in HL. We then investigated the susceptibility of cardiomyocytes to oxidative stress.
Figure 1C
shows representative histograms and quantitative results of FACS analysis of cardiomyocytes stained with TMRE (Invitrogen), an indicator of mitochondrial inner membrane potential (∆Ψm). The ∆Ψm
values did not significantly differ among cardiomyocytes in the NG, HG and HL groups. Incubation with H2O2
(100 µmol/L) for 30 min significantly decreased the number of cells with high TMRE fluorescence, indicating the loss of ∆Ψm. Exposing cardiomyocytes to HG significantly augmented the H2O2-induced loss of ∆Ψm
compared with those in NG. The H2O2-induced ∆Ψm
loss was more extreme in HL than in HG and NG.
Ischemia/Reperfusion Injury
We investigated the effects of fluctuating glucose levels on infarct size in an animal model of DM in vivo.
Figure 2B
shows changes in the blood glucose levels in each group. The levels remained continuously high in the DM compared with Veh group, in which a normal glucose level was maintained. The blood glucose level in the GF fluctuated from ≥400 mg/dl to ≤100 mg/dl after starvation and insulin injection (Figure 2B). The size of infarcts induced by ischemia/reperfusion was significantly increased in the DM compared with the Veh group, and this was further exaggerated in GF (Figure 2C). These results indicate that fluctuating glucose levels increase the susceptibility of the heart to ischemia/reperfusion injury.
Level of ROS
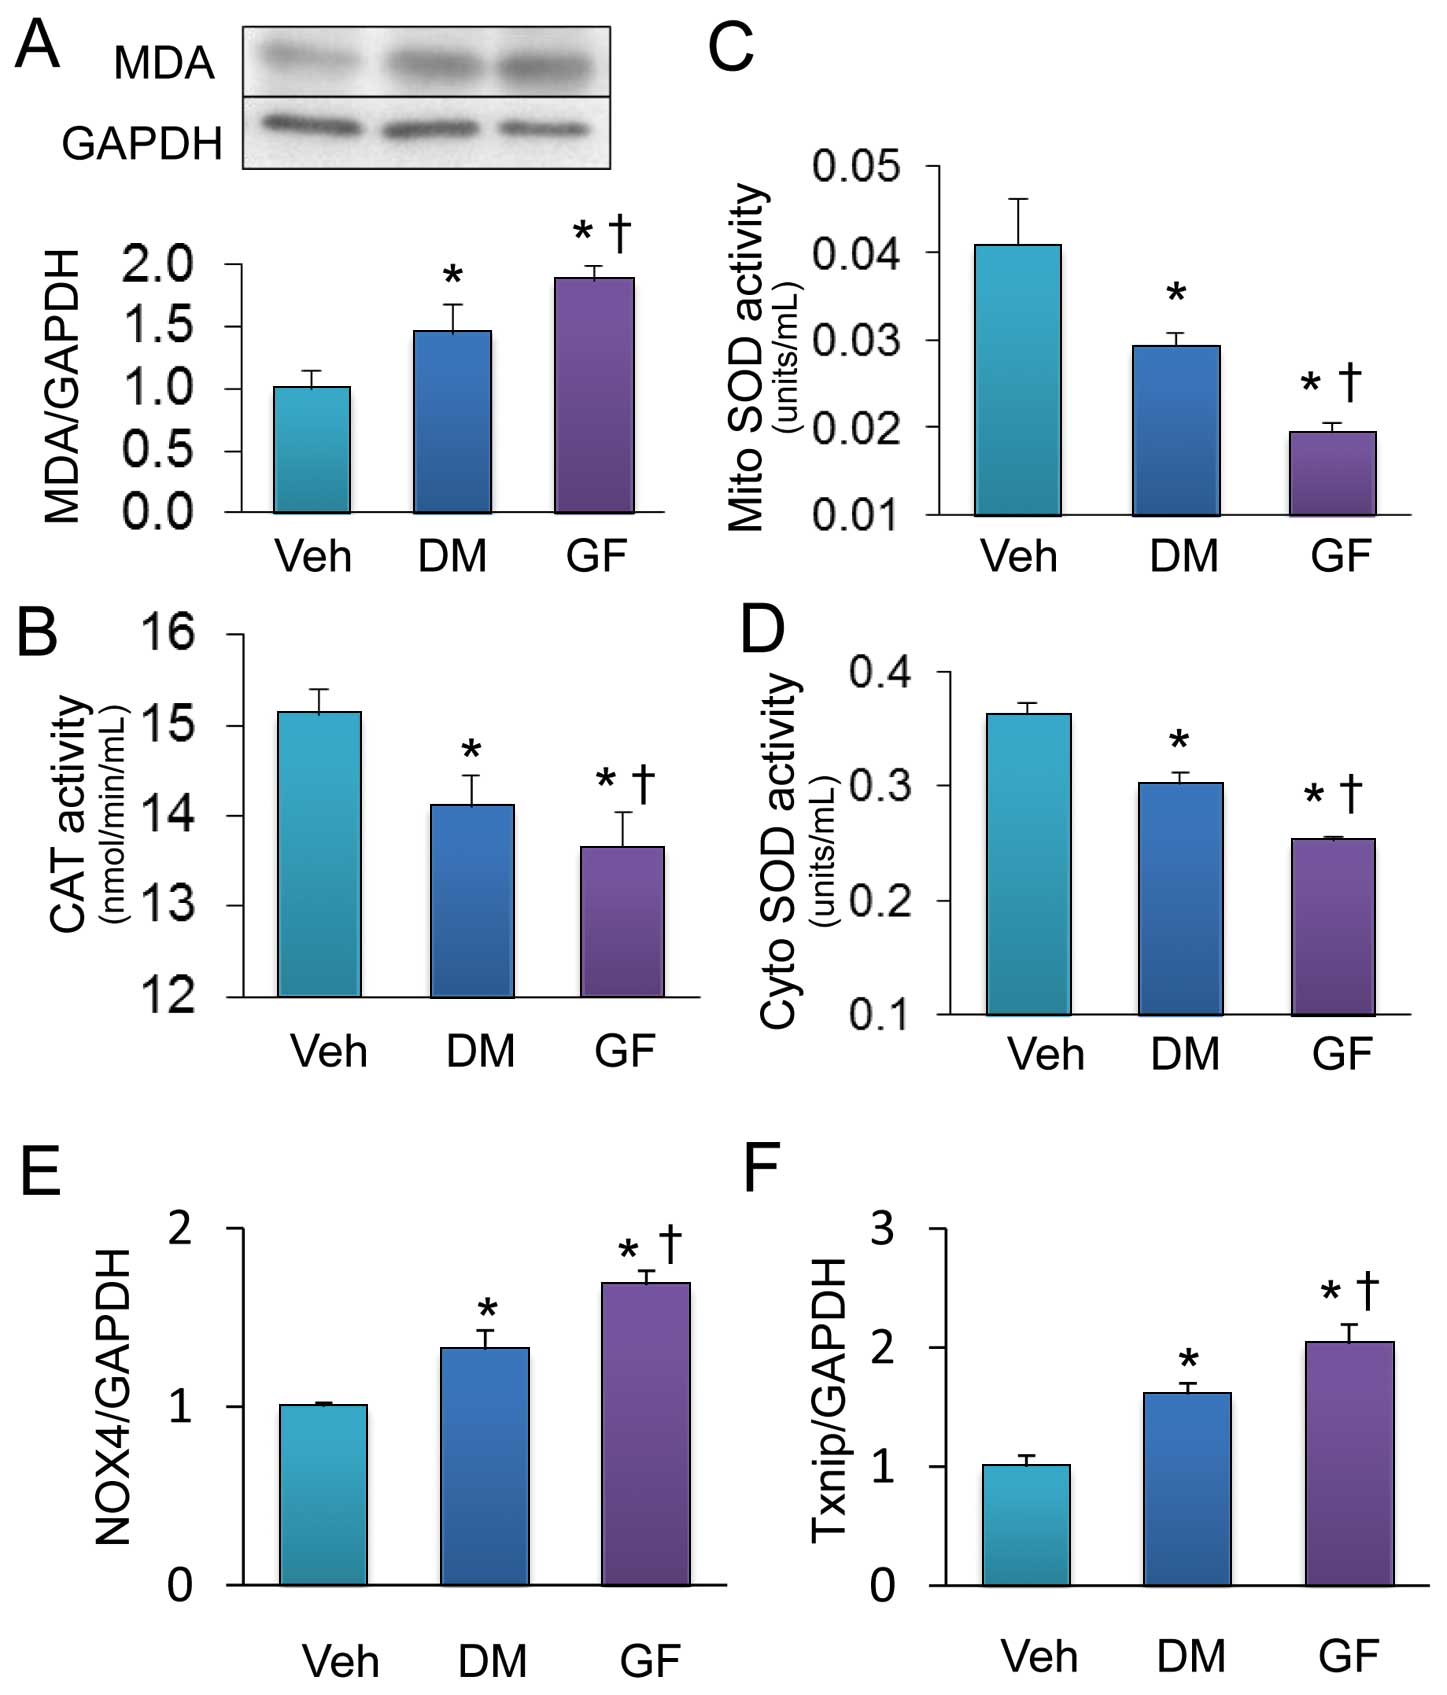
We investigated the effect of GF on oxidative stress by measuring the expression of malondialdehyde (MDA), a marker for oxidative stress, in the heart of an animal model. Western blotting revealed that GF augmented the increase in MDA expression elicited by DM (Figure 3A). We assayed antioxidant enzymes activity to explore the mechanisms that might be involved in the increased ROS levels. Catalase activity was decreased in the DM heart, and further decreased in the heart of GF (Figure 3B). Mitochondrial and cytosolic SOD activities were also decreased in the DM heart, and more so in hearts of GF (Figures 3C,D). Expressions of nicotinamide adenine dinucleotide phosphate (NADPH) oxidase 4 (NOX4) and thioredoxin-interacting protein (Txnip) were upregulated in hearts of GF more than DM (Figures 3E,F).
Mitochondrial Morphology
Mitochondria are not only a major source of ROS, but they also serve as a sensitive marker of ROS-induced cardiac injury. We investigated the effects of GF on mitochondrial morphology in the rat heart using electron microscopy.
Figure 4
shows representative images and quantitative results. The mitochondria were significantly larger in the heart of DM and GF compared with Veh; however, the size of mitochondria did not significantly differ between DM and GF. Mitochondrial luminosity reflects collapsed mitochondrial cristae. The structure of cristae was destroyed in the DM heart, and more devastated in the heart of GF.
miRNA Expression
miRNAs contribute to cardiac physiology and pathophysiology.9,14
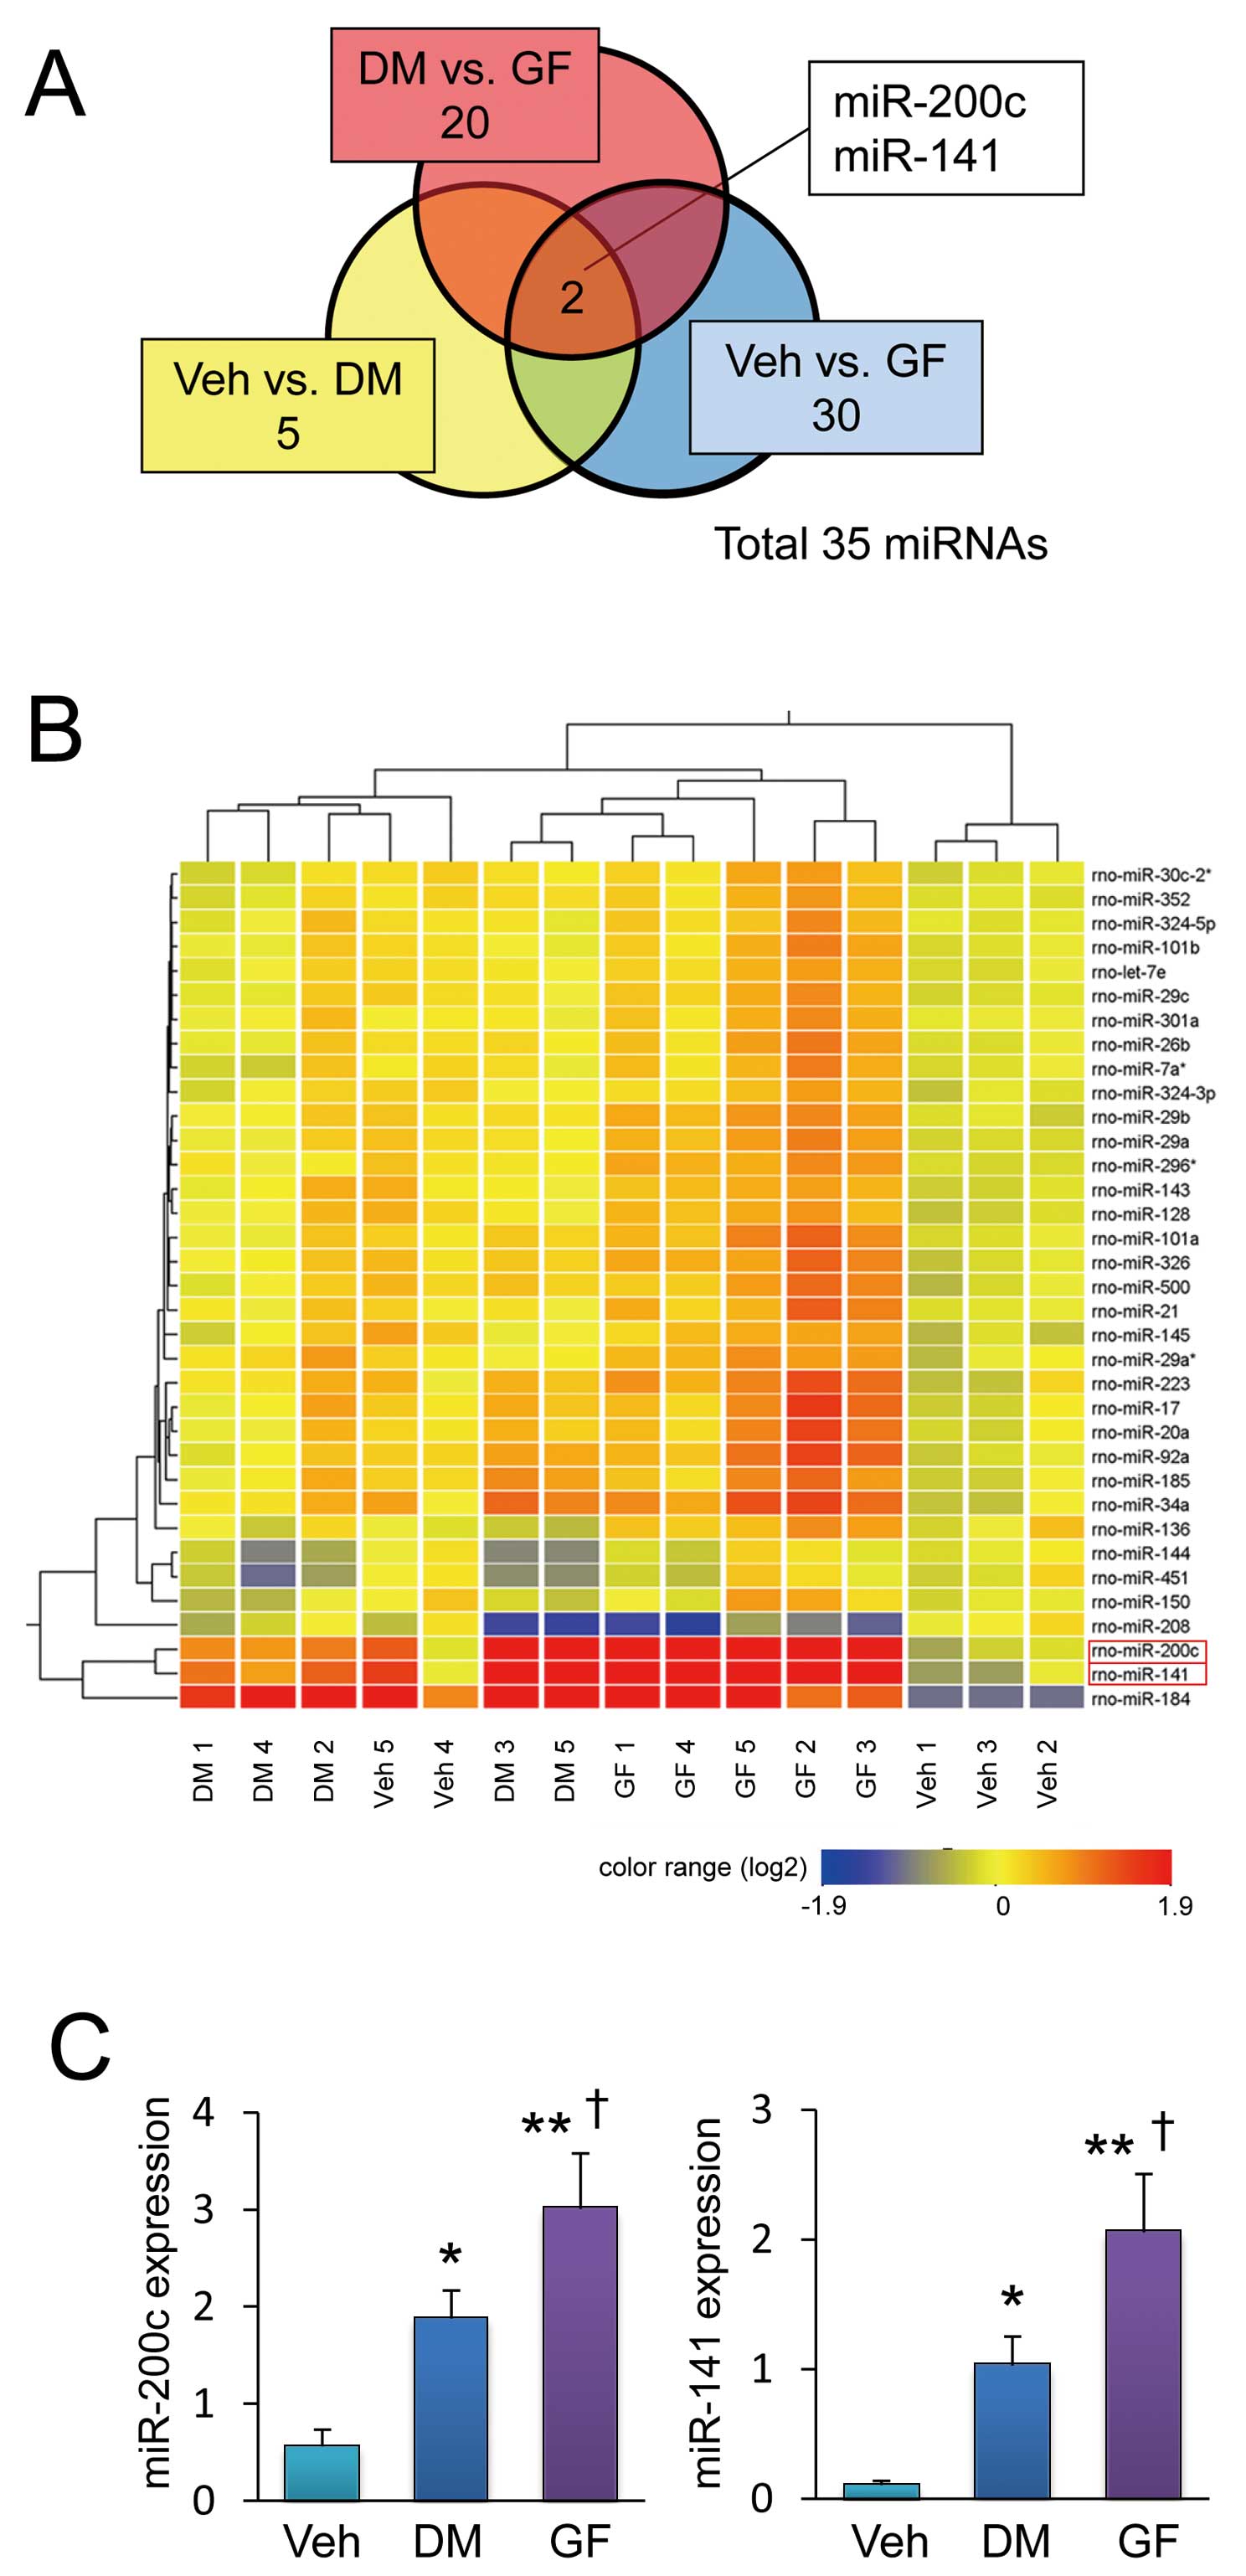
We comprehensively examined miRNA expression profiles in hearts to determine the involvement of miRNAs in the effects identified herein. The expression of 5 of 350 scanned miRNAs significantly differed between DM and Veh groups (Table S1). The expression of 30 miRNAs significantly differed between GF and Veh groups (Table S2), and that of 20 miRNAs significantly differed between DM and GF groups (Table S3). These results together indicated that miR-200c and miR-141 expression significantly differed among the 3 groups (Figure 5A). Supervised hierarchical cluster analysis showed that the expression of these 2 miRNAs was upregulated in DM hearts as compared with Veh hearts (Figure 5B). The data obtained by the miRNA microarray analysis are available at national center for biotechnology information via gene expression omnibus, under accession number GSE40779 in a format that conforms to the Minimum Information about Microarray Gene Experiment Guidelines. We confirmed that miR-200c and miR-141 expression was significantly upregulated in DM compared to Veh hearts, which was more exaggerated in the GF heart according to quantitative PCR (Figure 5C). Furthermore, we also demonstrated that these 2 miRNAs were significantly increased in HG compared with NG, and more augmented in HL in cultured cardiomyocytes (Figure S1). These results suggest that miR-200c and miR-141 upregulation may be associated with the detrimental effect of fluctuating glucose levels.
We investigated whether miR-200c and miR-141 overexpression in cultured neonatal cardiomyocytes induces similar effects to those of GF. Cultured neonatal rat cardiomyocytes were transfected with pre-miR-200c, pre-miR-141 or a negative control precursor miRNA. Successful transfection was assumed when fluorescence emissions increased after transfection with a double-stranded oligomer, and PTK9 expression became downregulated after miR-1 transfection (Figure S2). We also confirmed the efficiency of transfection with pre-miR-200c and pre-miR-141 by quantitative RT-PCR. Each miRNA was upregulated approximately 150-fold more than that in the control by the transfection (Figure 6A).
Figure 6B
shows representative images and quantitative fluorescence findings obtained by confocal microscopy, and representative histograms by FACS analysis in cardiomyocytes stained with CM-H2DCFDA. Levels of ROS were significantly increased in cells transfected with pre-miR-200c and pre-miR-141 as compared with the control. There was no further increase in ROS level by co-transfection with pre-miR-200c and pre-miR-141 (Figure S3). Transfection with pre-miR-200c or pre-miR-141 also resulted in increased mitochondrial superoxide levels that were evaluated using the specific indicator, MitoSox Red (Figure 6C). We investigated the effects of miRNA transfection on enzymes that reduce intracellular ROS to determine how miRNA transfection increased ROS levels.
Figure 6D
shows that transfection with pre-miR-200c or pre-miR-141 decreased mitochondrial SOD and catalase activities. These results collectively indicate that the overexpression of these 2 miRNAs mimics the effects of fluctuating glucose levels in cardiomyocytes.
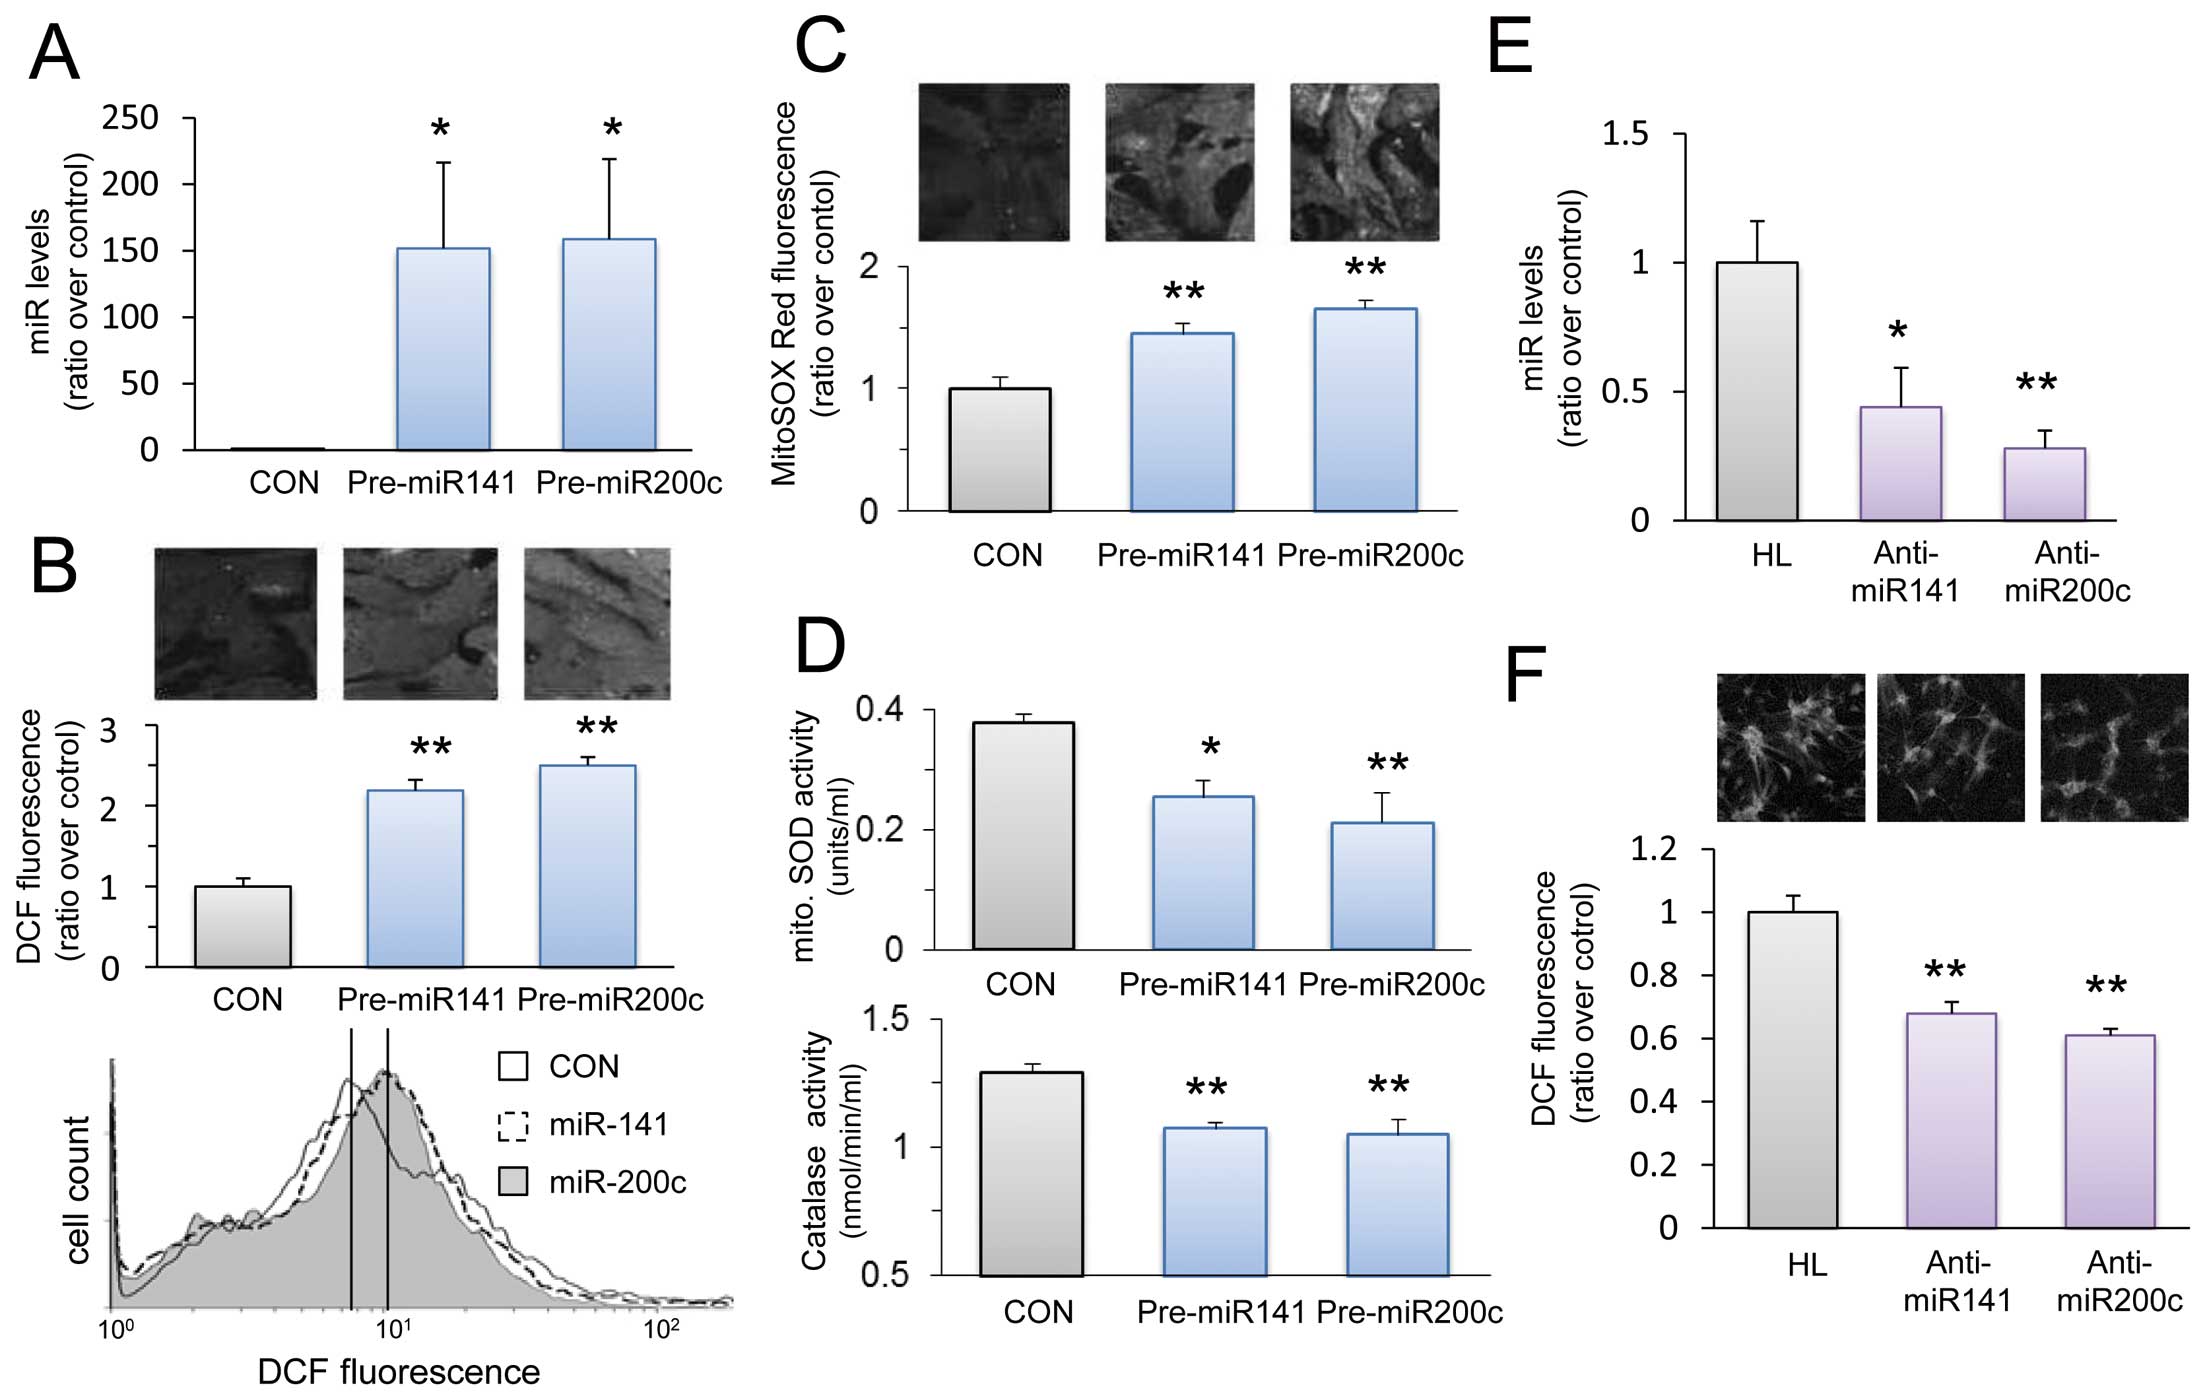
Next, we investigated the effects of miR-200c and miR-141 inhibition on ROS levels in cultured neonatal cardiomyocytes. Cardiomyocytes were transfected with anti-miR-200c or anti-miR-141. We confirmed the efficiency of transfection with anti-miR-200c and anti-miR-141 by quantitative RT-PCR. Each miRNA was significantly downregulated by the transfection compared to the control cells exposed to high and low glucose concentrations (Figure 6E).
Figure 6F
shows quantitative fluorescence obtained by confocal microscopy in cardiomyocytes stained with CM-H2DCFDA. Levels of ROS were significantly decreased in the cells transfected with anti-miR-200c or anti-miR-141 as compared with the cardiomyocytes subjected to high and low glucose concentrations. Furthermore, double knockdown of miR-200c and miR-141 decreased ROS levels less than those in knockdown of each single miRNA (Figure S3).
Discussion
The major findings of the present study are as follows. (1) Fluctuating glucose levels in culture medium increased ROS levels and susceptibility to oxidative stress in cultured cardiomyocytes. (2) GF induced by repeated hypoglycemia in diabetic rats enhanced the cardiac injury induced by ischemia/reperfusion. (3) The activities of antioxidant enzymes were decreased and the expressions of NOX4 and Txnip were increased by GF. (4) GF increased cardiac miR-200c and miR-141 expression, which decreased the activities of antioxidant enzymes and increased ROS levels. Thus, we discovered that a distinct fluctuation of the glucose level has direct effects on cardiomyocytes and enhances ischemia/reperfusion injury mediated via modification of miRNAs expression.
Increased ROS levels are a key determinant of ischemia/reperfusion injury. Cellular reoxygenation triggers an exponential increase of ROS, which favors the opening of mitochondrial permeability transition pores and results in cell death during reperfusion.15,16
ROS levels were increased in cultured cells exposed to high glucose concentrations or in diabetic animal models,17,18
and blocking ROS formation prevented hyperglycemic damage.19
Furthermore, frequent hypoglycemic episodes promoted mitochondrial free radical release and exacerbated cerebral ischemic damage in diabetic rats,20
and intermittent exposure to high glucose increased ROS levels in endothelial cells and induced apoptosis.8,21
A clinical study also revealed that GF increase oxidative stress in patients with type 2 diabetes.22
These results were consistent with the present results that ROS levels were higher in GF than those in sustained hyperglycemia. The present study newly proposed the decrease of antioxidant enzyme activity as a mechanism of ROS increase caused by GF.
miRNAs are small non-coding RNAs that bind and inhibit the translation of the target mRNAs. In the present study, we found that miR-200c and miR-141 expression was upregulated by blood GF. Both miR-200c and miR-141 belong to the miR-200 family, and they become dysregulated in various types of cancer cells, which may contribute to tumor progression.23–25
For example, miR-200c and miR-141 expression is downregulated in renal cell carcinoma and leads to E-cadherin suppression.13
Mateescu et al reported that oxidative stress stimulates expression of the miR-200 family, and such overexpression modulates ovarian tumorigenesis.26
Magenta et al showed that oxidative stress upregulates miR-200c, which induces apoptosis and senescence in endothelial cells.27
These findings indicate that ROS regulate the expression of the miR-200 family. Consistently, we demonstrated that N-2-mercaptopropionyl glycine, an antioxidant, significantly attenuated the upregulation of miR-200c and miR-141 induced by GF in the present study (Figure S1). This result indicates that ROS may at least partially contribute to the upregulation of miR-200c and miR-141. We also found that transfection with pre-miR-200c and pre-miR-141 decreased mitochondrial SOD and catalase activities, which may increase ROS levels in cultured cardiomyocytes. Considering that NOX4 and Txnip expressions were upregulated by GF (Figures 3E,F), miR-200c and miR-141 may be primarily upregulated by a ROS increase, which was induced by increased NADPH oxidase and Txnip. Upregulation of these miRNAs may further increase the ROS level by decreasing mitochondrial SOD and catalase activities. Namely, miR-200c and miR-141 may not be a primary cause of ROS increase, but they may work as an enhancer of ROS increase. Although mitochondrial SOD and catalase activity were decreased by overexpression of miR-200c and miR-141, there were no changes in protein expressions of these enzymes. This result indicates that these miRNAs may indirectly affect antioxidant activity and ROS levels. advanced glycation end products (AGEs) are considered to increase oxidative stress and play a crucial role in the pathogenesis of cardiovascular disease. In our recent study, AGEs levels were significantly increased by GF.28
Hence, AGEs may be a possible mechanism of glucose fluctuation-promoted ischemia/reperfusion injury.
Mitochondria are a major source of ROS, and they play a key role in the process of cell death.29
Our morphological assays revealed more devastating enlargement of mitochondria and collapse of cristae in cardiomyocytes exposed to GF compared with sustained hyperglycemia. Although these morphological changes in mitochondria might be the results of increased ROS, the possibility that ROS actually originated from functionally impaired mitochondria cannot be excluded. Interestingly, a very recent report showed that miR-141 was upregulated in the heart of DM, which decreased the mitochondrial inner membrane phosphate carrier, slc25a3, and decreased mitochondrial ATP synthesis rates.30
These results indicate that miR-141 may facilitate ROS production by restraining mitochondrial respiration.31
Consistently, fluorescence of MitoSOX Red, an indicator of mitochondrial superoxide, was increased after transfection with pre-miR-200c and pre-miR-141 in the present study. Collectively, mitochondria may be major sites of ROS increase induced by miR-200c and miR-141. There were no changes of mitochondrial membrane potential without the stimulation of H2O2, even though the ROS levels had increased (Figures 1B,C). Therefore, the ROS level increased prior to the loss of mitochondrial membrane potential. Considering that loss of mitochondrial membrane potential is a critical step in the process of apoptosis,32
apoptosis may not have occurred in cardiomyocytes without H2O2
stimulation in in vitro experiment. We recently reported that apoptosis in the left atrium was increased by GF.28
Although there must be an anatomical difference between the atrium and ventricle, the expression of caspase-3 tended to increase in rat ventricles exposed to GF (Figure S4). These results indicate that apoptosis may be exaggerated by GF in the left ventricle, which may contribute to enhancement of ischemia/reperfusion injury.
In the preliminary experiments, ROS levels in cardiomyocytes alternately exposed to normal and high glucose concentrations were significantly less than those in cardiomyocytes alternately exposed to high and low glucose concentrations. Based on these results, we speculated that the extent of glucose fluctuation is more related to ROS level in cardiomyocytes. Therefore, we used a model that can express a large range of glucose changes to clarify the effects of fluctuations of glucose concentrations per se. Although a pattern of GF observed in the present study is not typical in diabetic patients, this protocol enabled us to clearly observe the effects of GF on the heart.
Conflicts of Interest
None declared.
Acknowledgments
This work was supported by Grants-in-Aid for Scientific Research (C) 22590209 (Y.T.) from the Ministry of Education, Culture, Sports, Science, and Technology of Japan. The project was also supported by a Research Fund at the Discretion of the President of Oita University.
Supplementary Files
Supplementary File 1
Table S1.
Five miRNAs differentially expressed between the DM and Veh groups
Table S2.
Thirty miRNAs differentially expressed between GF and Veh groups
Table S3.
Twenty miRNAs differentially eexpressed between DM and GF groups
Figure S1.
Exposure to high and low glucose conditions induced miR-200c and -141 expressions in cultured cardiomyocytes.
Figure S2.
Successful transfection of pre-miR-200c and pre-miR-141 was assumed when fluorescence emissions increased after transfection with a double-stranded oligomer in cultured neonatal rat cardiomyocytes (Left panel), and PTK9 expression became downregulated after miR-1 transfection (Right panel).
Figure S3.
Simultaneous overexpression of these miR-141 and miR-200c did not increase the reactive oxygen species (ROS) level more than the level induced by each microRNA (miRNA) overexpression.
Figure S4.
Protein expressions of Caspase-3 were significantly upregulated in DM and GF rats compared with Veh rats.
Please find supplementary file(s);
http://dx.doi.org/10.1253/circj.CJ-14-1218
References
- 1.
Danaei G, Finucane MM, Lu Y, Singh GM, Cowan MJ, Paciorek CJ, et al. National, regional, and global trends in fasting plasma glucose and diabetes prevalence since 1980: Systematic analysis of health examination surveys and epidemiological studies with 370 country-years and 2.7 million participants. Lancet 2011; 378: 31–40.
- 2.
Wei M, Gaskill SP, Haffner SM, Stern MP. Effects of diabetes and level of glycemia on all-cause and cardiovascular mortality: The San Antonio Heart Study. Diabetes Care 1998; 21: 1167–1172.
- 3.
Wilson PW, Cupples LA, Kannel WB. Is hyperglycemia associated with cardiovascular disease?: The Framingham Study. Am Heart J 1991; 121: 586–590.
- 4.
Gerstein HC, Miller ME, Byington RP, Goff DC Jr, Bigger JT, Buse JB, et al. Effects of intensive glucose lowering in type 2 diabetes. N Engl J Med 2008; 358: 2545–2559.
- 5.
Finfer S, Chittock DR, Su SY, Blair D, Foster D, Dhingra V, et al. Intensive versus conventional glucose control in critically ill patients. N Engl J Med 2009; 360: 1283–1297.
- 6.
Kosiborod M, Inzucchi SE, Goyal A, Krumholz HM, Masoudi FA, Xiao L, et al. Relationship between spontaneous and iatrogenic hypoglycemia and mortality in patients hospitalized with acute myocardial infarction. JAMA 2009; 301: 1556–1564.
- 7.
Piconi L, Quagliaro L, Assaloni R, Da Ros R, Maier A, Zuodar G, et al. Constant and intermittent high glucose enhances endothelial cell apoptosis through mitochondrial superoxide overproduction. Diabetes Metab Res Rev 2006; 22: 198–203.
- 8.
Quagliaro L, Piconi L, Assaloni R, Martinelli L, Motz E, Ceriello A. Intermittent high glucose enhances apoptosis related to oxidative stress in human umbilical vein endothelial cells. Diabetes 2003; 52: 2795–2804.
- 9.
Abdellatif M. Differential expression of microRNAs in different disease states. Circ Res 2012; 110: 638–650.
- 10.
De Rosa S, Curcio A, Indolfi C. Emerging role of microRNAs in cardiovascular diseases. Circ J 2014; 78: 567–575.
- 11.
Shantikumar S, Caporali A, Emanueli C. Role of microRNAs in diabetes and its cardiovascular complications. Cardiovasc Res 2012; 93: 583–593.
- 12.
Nishio S, Teshima Y, Takahashi N, Thuc LC, Saito S, Fukui A, et al. Activation of CaMKII as a key regulator of reactive oxygen species production in diabetic rat heart. J Mol Cell Cardiol 2012; 52: 1103–1111.
- 13.
Nakada C, Matsuura K, Tsukamoto Y, Tanigawa M, Yoshimoto T, Narimatsu T, et al. Genome-wide microRNA expression profiling in renal cell carcinoma: Significant down-regulation of miR-141 and miR-200c. J Pathol 2008; 216: 418–427.
- 14.
Bauersachs J, Thum T. Biogenesis and regulation of cardiovascular microRNAs. Circ Res 2011; 109: 334–347.
- 15.
Kim JS, Jin Y, Lemasters JJ. Reactive oxygen species, but not Ca2+ overloading, trigger pH- and mitochondrial permeability transition-dependent death of adult rat myocytes after ischemia-reperfusion. Am J Physiol Heart Circ Physiol 2006; 290: H2024–H2034.
- 16.
Loor G, Kondapalli J, Iwase H, Chandel NS, Waypa GB, Guzy RD, et al. Mitochondrial oxidant stress triggers cell death in simulated ischemia-reperfusion. Biochim Biophys Acta 2011; 1813: 1382–1394.
- 17.
Boudina S, Abel ED. Diabetic cardiomyopathy revisited. Circulation 2007; 115: 3213–3223.
- 18.
Teshima Y, Takahashi N, Nishio S, Saito S, Kondo H, Fukui A, et al. Production of reactive oxygen species in the diabetic heart: Roles of mitochondria and NADPH oxidase. Circ J 2014; 78: 300–306.
- 19.
Nishikawa T, Edelstein D, Du XL, Yamagishi S, Matsumura T, Kaneda Y, et al. Normalizing mitochondrial superoxide production blocks three pathways of hyperglycaemic damage. Nature 2000; 404: 787–790.
- 20.
Dave KR, Tamariz J, Desai KM, Brand FJ, Liu A, Saul I, et al. Recurrent hypoglycemia exacerbates cerebral ischemic damage in streptozotocin-induced diabetic rats. Stroke 2011; 42: 1404–1411.
- 21.
Ceriello A, Esposito K, Piconi L, Ihnat MA, Thorpe JE, Testa R, et al. Oscillating glucose is more deleterious to endothelial function and oxidative stress than mean glucose in normal and type 2 diabetic patients. Diabetes 2008; 57: 1349–1354.
- 22.
Monnier L, Mas E, Ginet C, Michel F, Villon L, Cristol JP, et al. Activation of oxidative stress by acute glucose fluctuations compared with sustained chronic hyperglycemia in patients with type 2 diabetes. JAMA 2006; 295: 1681–1687.
- 23.
Du Y, Xu Y, Ding L, Yao H, Yu H, Zhou T, et al. Down-regulation of miR-141 in gastric cancer and its involvement in cell growth. J Gastroenterol 2009; 44: 556–561.
- 24.
Gregory PA, Bert AG, Paterson EL, Barry SC, Tsykin A, Farshid G, et al. The miR-200 family and miR-205 regulate epithelial to mesenchymal transition by targeting ZEB1 and SIP1. Nat Cell Biol 2008; 10: 593–601.
- 25.
Shimono Y, Zabala M, Cho RW, Lobo N, Dalerba P, Qian D, et al. Downregulation of miRNA-200c links breast cancer stem cells with normal stem cells. Cell 2009; 138: 592–603.
- 26.
Mateescu B, Batista L, Cardon M, Gruosso T, de Feraudy Y, Mariani O, et al. miR-141 and miR-200a act on ovarian tumorigenesis by controlling oxidative stress response. Nat Med 2011; 17: 1627–1635.
- 27.
Magenta A, Cencioni C, Fasanaro P, Zaccagnini G, Greco S, Sarra-Ferraris G, et al. miR-200c is upregulated by oxidative stress and induces endothelial cell apoptosis and senescence via ZEB1 inhibition. Cell Death Differ 2011; 18: 1628–1639.
- 28.
Saito S, Teshima Y, Fukui A, Kondo H, Nishio S, Nakagawa M, et al. Glucose fluctuations increase the incidence of atrial fibrillation in diabetic rats. Cardiovasc Res 2014; 104: 5–14.
- 29.
Zorov DB, Juhaszova M, Sollott SJ. Mitochondrial ROS-induced ROS release: An update and review. Biochim Biophys Acta 2006; 1757: 509–517.
- 30.
Baseler WA, Thapa D, Jagannathan R, Dabkowski ER, Croston TL, Hollander JM. miR-141 as a regulator of the mitochondrial phosphate carrier (Slc25a3) in the type 1 diabetic heart. Am J Physiol Cell Physiol 2012; 303: C1244–C1251.
- 31.
Ali SS, Marcondes MC, Bajova H, Dugan LL, Conti B. Metabolic depression and increased reactive oxygen species production by isolated mitochondria at moderately lower temperatures. J Biol Chem 2010; 285: 32522–32528.
- 32.
Grimm S, Brdiczka D. The permeability transition pore in cell death. Apoptosis 2007; 12: 841–855.