Abstract
Background:
Although self-expanding drug-eluting stents (DES) have recently shown superior outcomes for superficial femoral artery (SFA) lesions, optimal sizing of DES diameter in SFA intervention is unclear.
Methods and Results:
A total of 40 de novo SFA lesions were randomized 1:1 to receive self-expanding DES with either a 1-mm or 2-mm larger diameter than the reference vessel diameter. Follow-up optical coherence tomography (OCT) was scheduled 6 months after DES implantation to evaluate the vascular response to the stents. Volume index (VI) was defined as volume divided by stent length. The primary endpoint was neointimal VI at 6 months. Baseline reference vessel diameter was similar between the 1-mm larger diameter group and the 2-mm larger diameter group (5.0±0.8 mm vs. 4.7±0.9 mm, P=0.35). Stent diameter was 6.3±0.6 mm in the 1-mm larger group and 7.1±0.6 mm in the 2-mm larger group (P<0.0001), and stent to reference vessel diameter ratio (SV ratio) was 1.3±0.2 and 1.5±0.2 (P<0.0001), respectively. At 6-month, neointimal VI was greater in the 2-mm larger diameter group (5.5±1.5 mm2
vs. 9.6±3.4 mm2, P<0.001). The correlation analysis revealed that degree of neointimal VI was positively correlated with SV ratio (r=0.43, P<0.01).
Conclusions:
Implantation of self-expanding DES with a considerably high SV ratio resulted in neointimal hyperplasia in SFA lesions.
Restenosis and subsequent target lesion revascularization (TLR) have remained a drawback to treatment with self-expanding bare-metal nitinol stents (BMS) for femoropopliteal artery lesions.1,2
Recently, self-expanding drug-eluting stents (DES) have demonstrated superior long-term outcomes for patients with peripheral artery disease (PAD) compared with self-expanding BMS.3–6
In previous Zilver PTX randomized trials, the primary patency rate after self-expanding DES implantation for superficial femoral artery (SFA) lesions was reported to be 89.9% at 1 year,4
and 83.4% at 2 years.5
However, a post-market surveillance study has recently reported that the real-world primary patency rate after DES implantation was 86.4% at 1 year,7
and 70.3% at 2 years,8
which was considerably lower than reported in the randomized trials. So far, in-stent restenosis (ISR) continues to be a major clinical limitation, even after DES implantation, in real-world clinical practice.
Neointimal hyperplasia is an exaggerated healing response to mechanical injury of the arterial wall,9
which is the major mechanism of late lumen loss and ISR after stent implantation. Previous animal models of peripheral endovascular intervention have shown that over-sized self-expanding nitinol stents expand to their nominal diameter in the chronic phase, resulting in exuberant neointimal proliferation and luminal stenosis due to harsh mechanical injury caused by the stent expanding.10,11
In addition, the degree of stent oversizing has positively correlated with neointimal hyperplasia and restenosis. These experimental studies have suggested that the diameter of self-expanding stents can have a tremendous effect on long-term results of peripheral interventions; however, no data are available on the influence of stent diameter on neointimal proliferation following implantation of self-expanding stents for the human peripheral artery. The purpose of the present study was to evaluate the effect of stent oversizing on the degree of neointimal proliferation after self-expanding DES implantation in the SFA, using optical coherence tomography (OCT).
Methods
Study Design
Patients with symptomatic PAD due to de novo SFA lesions classified as >Rutherford 1 were screened by noninvasive tests to detect limb ischemia and the presence of SFA lesions. Exclusion criteria were (1) acute or subacute limb ischemia, (2) previous bypass surgery in the lower limb or previous stenting in the SFA, (3) residual >50% stenosis in the inflow aorto-iliac artery, (4) lesion length ≥25 cm, (5) lesions requiring additional treatment to the common femoral artery or popliteal artery, and (6) known intolerance to dual antiplatelet therapy (DAPT) or contrast agents. A total of 40 patients with de novo SFA lesions, who were scheduled for endovascular therapy (EVT) with self-expanding paclitaxel-eluting stents (PES; Zilver PTX, Cook Medical, Bloomington, IN, USA), were prospectively enrolled from November 2016 to August 2019. Following diagnostic angiography of the lower extremity, all subjects were subsequently randomized 1 : 1 to receive self-expanding PES with either a 1-mm or a 2-mm larger diameter than mean [(proximal+distal)×1/2] reference lumen diameter (RLD) by the operator’s angiographic visual estimation. After randomization, stent diameter was determined with rounding to the nearest whole number. Follow-up angiography and OCT were scheduled at 6 months to evaluate chronic vascular response (Figure 1). The study was conducted in accordance with the Declaration of Helsinki. The protocol was approved by the Institutional Review Board of Hyogo College of Medicine, and written informed consent was given by all patients before participation. This study was registered on the UMIN clinical trial registry (UMIN000023642).

Following diagnostic angiography, EVT procedure was performed with a primary stenting strategy via an ipsilateral or contralateral femoral approach through 6Fr sheaths. After a 0.014-inch guidewire was passed through the lesion, predilation was performed using a balloon with diameter equal to the reference vessel diameter. Balloon inflation was maintained at a pressure of 6–10 atmospheres for 30–60 s and repeated routinely 2–4 times in the target segment. After predilation of the lesion, a self-expanding PES with either a 1-mm or 2-mm larger diameter than the reference vessel diameter was deployed as assigned. Post-dilation was performed routinely for all lesions, in which balloon diameter and dilation pressure were selected at the operator’s discretion. DAPT (aspirin 100 mg/day and clopidogrel 75 mg/day) was started at least 1 week prior to EVT and was continued during the follow-up period.
Angiographic Analysis
Angiographic images were obtained in 2 planes before EVT, immediately after EVT, and at the 6-month follow-up. All quantitative vascular angiography (QVA) analyses, which were completed with commercially available software (QAngio XA 7.3, Medis Medical Imaging Systems BV, Leiden, The Netherlands), were performed in a blinded fashion. The tip of the 6Fr guiding catheter at the common femoral artery was used for calibration in the QVA analysis. During acquisition of angiographic images for QVA, movement or panning of the catheterization table was not allowed for the entire lower limb. Minimum lumen diameter (MLD), RLD, and stent length were obtained. Diameter stenosis (DS) was calculated as MLD divided by the average [(proximal+distal)×1/2] RLD. Stent to reference vessel diameter ratio (SV ratio) was defined as nominal stent diameter divided by the average RLD. Stent fracture was assessed on X-ray at the 6-month follow-up and defined as clear interruption of stent struts identified on multiple projections.12
OCT Acquisition
Follow-up OCT procedure was performed at an image acquisition rate of 160 frames/s with a second-generation OCT technique and optical frequency domain imaging system (FastView®, Terumo Corp., Tokyo, Japan), using a non-occlusive technique. After insertion of a 6Fr sheath through the ipsilateral or contralateral femoral artery, a 6Fr guiding catheter was positioned 10–20 mm proximal to the stent edge. The OCT catheter was advanced over a 0.014-inch guidewire and the imaging core was placed distal to the stent. Automated OCT pullback was performed at a speed of 40 mm/s with continuous injection of 50% contrast medium from the guiding catheter. Acquired images were automatically saved for later analyses.
OCT Analysis
All OCT data were analyzed by independent observers who were unaware of the clinical presentation, lesion characteristics, and stent assignment. The OCT analysis was performed using PC-based software (echoPlaqueTM, Indec Systems Inc., Santa Clara, CA, USA). The stented segment was defined as the region between the first and last frames where metallic stent struts were visible around the whole vessel circumference. The peri-stented segment was defined as 10 mm proximal or distal to the stented segment. Cross-sectional OCT imaging frames were reviewed at axial 5-mm intervals (every 20 frames) throughout the entire target segment.13
Lumen and stent borders were manually traced, and lumen and stent volumes were obtained using volumetric analysis. Neointimal area was calculated as stent area minus lumen area. Cross-sectional narrowing (CSN) was defined as neointimal area divided by stent area. Neointimal volume was calculated as stent volume minus lumen volume. Lumen, stent, and neointimal volumes were divided by stent length to adjust for differences in stent length (VI: volume index mm3/mm). The imaging frames with the minimum lumen area (MLA), minimum stent area (MSA), maximum stent area, and maximum CSN were identified. The presence of abnormal morphological OCT findings, including intrastent thrombus, microvessels, and stent edge dissection, was evaluated in the qualitative OCT analysis. The optical appearance of neointimal tissue at the MLA slice was classified into 3 patterns: homogeneous, layered, and heterogeneous.14
To assess the reliability of cross-sectional OCT measurements, intra- and interobserver variability analyses were performed on measurements of lumen area and stent area from a total of 50 randomly selected frames from 5 lesions. The images were re-measured by 1 observer for the intraobserver variability at 2 separate time points. The interobserver variability was determined by measurements conducted by 2 independent observers.
Clinical Follow-up
Initial success of the EVT procedure was defined as residual stenosis <30% without a flow-limiting dissection. All patients were asked to visit as outpatients at 1, 3, 6, and 12 months after EVT. Post-procedural clinical evaluations including symptoms, ankle-brachial index (ABI), and adverse events were recorded at each visit. Duplex ultrasound (DUS) examination was also performed to evaluate stent patency at 6 and 12 months, or whenever the patient complained of recurrent symptoms. When ISR was suggested by noninvasive examination, diagnostic angiography was performed. ISR was defined as peak systolic velocity ratio (PSVR) >2.85 on DUS,15,16
or >50% DS by QVA analysis. TLR was defined as clinically driven reintervention performed for ISR lesions with recurrence of clinical symptoms.
Study Endpoint, Sample Size Calculation and Statistical Analysis
The primary endpoint of this study was OCT-derived neointimal VI at the 6-month follow-up. According to a previous animal study that showed an increase in late lumen loss at 180 days after implantation of stents with a higher SV ratio (>1.4) compared with stents with a normal oversizing ratio (<1.4),10
a minimum of 13 lesions in each group was deemed necessary (5% α and 90% power) to show a difference in the degree of neointimal proliferation between the 1-mm larger diameter group and the 2-mm larger diameter group in the present study. This provisional sample was increased to 20 lesions (total of 40 lesions) to take into account potential losses for the follow-up OCT examination.
Statistical analysis was performed using the SPSS 21 software®
(IBM Corp., Armonk, NY, USA). Categorical variables were compared using the chi-squared test or Fisher’s exact test in the case of low counts. Continuous variables are expressed as mean±standard deviation and examined with an unpaired t-test. The reliability of the OCT measurements was expressed as the intraclass correlation coefficient. To assess the influence of stent oversizing on neointimal proliferation, Pearson’s correlation analysis was performed to examine the relation between SV ratio and neointimal VI. A P-value <0.05 was considered statistically significant.
Results
Patients, Lesions, and Procedures
A total of 40 de novo SFA lesions from 40 patients who underwent scheduled EVT at Hyogo College of Medicine were assessed as suitable for the study protocol (Figure 1). Baseline clinical characteristics of the patients were similar between the 2 groups (Table 1). Adherence of DAPT was maintained for 6 months in all patients. Lesion and procedural data are shown in
Table 2. Mean lesion length was 68.4±44.1 mm in the 1-mm larger diameter group and 60.5±34.3 mm in the 2-mm larger diameter group (P=0.53). Stent diameter was significantly larger in the 2-mm larger diameter group compared with the 1-mm larger diameter group, whereas balloon diameter used in post-dilation was similar between groups.
Table 1.
Baseline Patient Characteristics
| |
1-mm larger stent diameter
group (n=20) |
2-mm larger stent diameter
group (n=20) |
P value |
| Age (years) |
68.6±6.7 |
70.8±7.7 |
0.34 |
| Female |
4 (20) |
2 (10) |
0.67 |
| BMI (kg/m2) |
23.0±3.2 |
22.2±3.0 |
0.42 |
| Hypertension |
18 (90) |
18 (90) |
>0.99 |
| Dyslipidemia |
16 (80) |
16 (80) |
>0.99 |
| Diabetes |
8 (40) |
11 (55) |
0.53 |
| Dialysis |
1 (5) |
2 (10) |
>0.99 |
| Medications |
| Aspirin |
10 (100) |
10 (100) |
>0.99 |
| Clopidogrel |
10 (100) |
10 (100) |
>0.99 |
| Cilostazol |
4 (20) |
5 (25) |
>0.99 |
| Statin |
11 (55) |
8 (40) |
0.53 |
Data given as mean±SD or n (%). BMI, body mass index.
Table 2.
Lesion and Procedural Characteristics
| |
1-mm larger stent diameter
group (n=20) |
2-mm larger stent diameter
group (n=20) |
P value |
| Ankle-brachial index |
0.74±0.14 |
0.71±0.13 |
0.49 |
| Critical limb ischemia |
2 (10) |
1 (5) |
>0.99 |
| Lesion length (mm) |
68.4±44.1 |
60.5±34.3 |
0.53 |
| Chronic total occlusion |
4 (20) |
2 (10) |
0.66 |
| PACSS classification |
| 0/1/2/3/4 |
11/4/1/2/2 |
7/7/1/0/5 |
0.35 |
| TASC II classification |
| A/B/C/D |
14/5/1/0 |
16/3/0/1 |
0.45 |
| No. of patent runoff vessels |
| 0/1/2/3 |
2/2/9/7 |
1/2/11/6 |
0.89 |
| Total stent length (mm) |
83.5±43.0 |
80.0±33.7 |
0.78 |
| Stent diameter (mm) |
6.3±0.6 |
7.1±0.6 |
<0.001 |
| Number of stents used |
1.1±0.3 |
1.0±0.0 |
0.15 |
| Post-dilation balloon diameter (mm) |
5.3±0.7 |
5.1±0.4 |
0.43 |
Data given as mean±SD or n (%). PACSS, Peripheral Artery Calcification Scoring System; TASC, Trans-Atlantic Inter-society Consensus.
Initial procedural success was obtained in all cases and no procedure-related complications were recorded during the initial EVT procedure; 5 patients in the 1-mm larger diameter group and 1 patient in the 2-mm larger diameter group refused the follow-up angiography and OCT. As a result, the 6-month follow-up examination was performed for 34 lesions (Figure 1). At 12 months following EVT, there were no amputations or deaths in either group. Clinically driven TLR due to recurrent symptoms of intermittent claudication was performed for 1 patient in each group during 12 months. Primary stent patency rate at 12 months was 90% (18/20) and 85% (17/20) in the 1-mm and 2-mm larger diameter groups, respectively.
Angiographic Findings
QVA data are listed in
Table 3. MLD, RLD, and DS before EVT were similar between the diameter groups. MLD and acute gain immediately after EVT were similar between groups. MLD, late diameter loss, and DS at the 6-month follow-up were also similar. At 6 months after stent implantation, a minor stent fracture was detected in the 2-mm larger diameter group and none in the 1-mm larger diameter group.
Table 3.
Quantitative Vascular Angiography Findings
| |
1-mm larger stent
diameter group |
2-mm larger stent
diameter group |
P value |
| Before stenting |
(n=20) |
(n=20) |
|
| Minimum lumen diameter (mm) |
1.30±1.07 |
1.26±0.76 |
0.88 |
| Proximal reference diameter (mm) |
5.08±1.07 |
4.78±1.00 |
0.37 |
| Distal reference diameter (mm) |
4.87± 0.68 |
4.67±0.92 |
0.43 |
| Mean reference diameter (mm) |
4.97±0.76 |
4.72±0.90 |
0.35 |
| % Diameter stenosis |
75.0±19.4 |
72.3±18.6 |
0.65 |
| Stent to vessel ratio |
1.28±0.15 |
1.54±0.23 |
<0.0001 |
| After stenting |
(n=20) |
(n=20) |
|
| Total stent length (mm) |
83.3±39.9 |
78.3±33.2 |
0.67 |
| Minimum lumen diameter (mm) |
4.73±0.53 |
4.54±0.65 |
0.30 |
| Acute gain (mm) |
3.43±0.98 |
3.28±1.02 |
0.63 |
| At 6-month follow-up |
(n=15) |
(n=19) |
|
| Minimum lumen diameter (mm) |
3.35±0.85 |
3.44±0.94 |
0.77 |
| Late diameter loss (mm) |
1.32±0.76 |
1.07±1.04 |
0.43 |
| Proximal reference diameter (mm) |
4.82±0.84 |
4.99±1.00 |
0.60 |
| Distal reference diameter (mm) |
4.75±0.70 |
4.76±1.02 |
0.97 |
| Mean reference diameter (mm) |
4.79±0.68 |
4.88±0.91 |
0.75 |
| % Diameter stenosis |
29.4±17.2 |
29.6±15.3 |
0.97 |
| Stent fracture (%) |
0 (0) |
1 (5) |
>0.99 |
OCT image quality was acceptable for analyses in all lesions. OCT measurements exhibited excellent intra- and interobserver reliabilities. Intraclass correlation coefficients for intra- and interobserver variability of lumen area were 0.999 and 0.999, respectively. Stent area also showed excellent intra- and interobserver reliabilities (0.994 and 0.992, respectively). The 6-month follow-up OCT findings are presented in
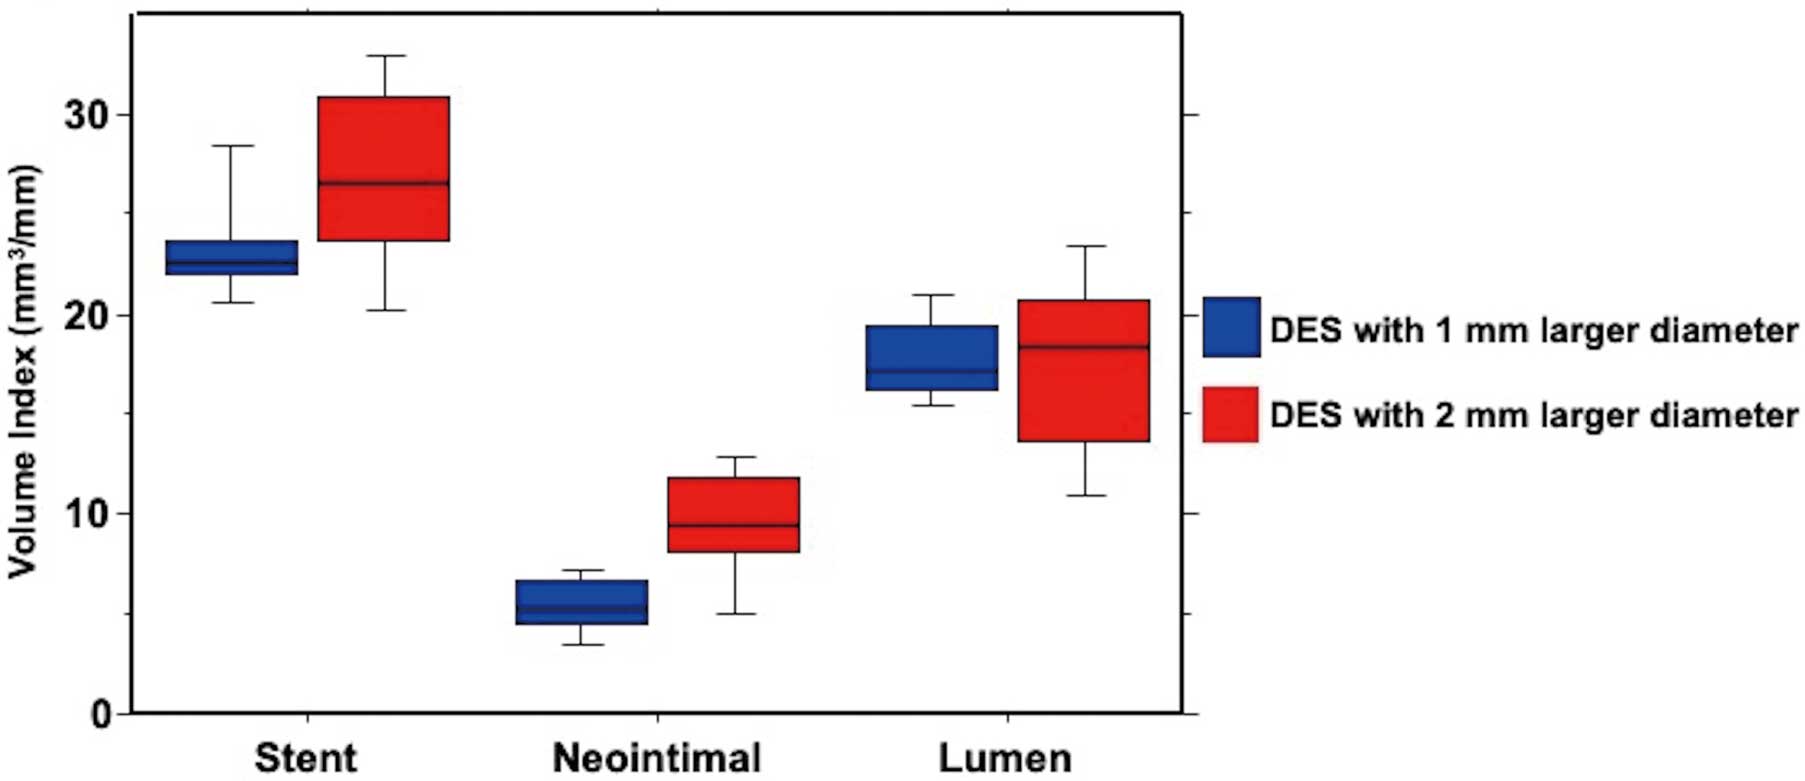
Table 4. MSA, MLA, and maximum CSN were similar between groups. Volumetric OCT parameters at follow-up are summarized in
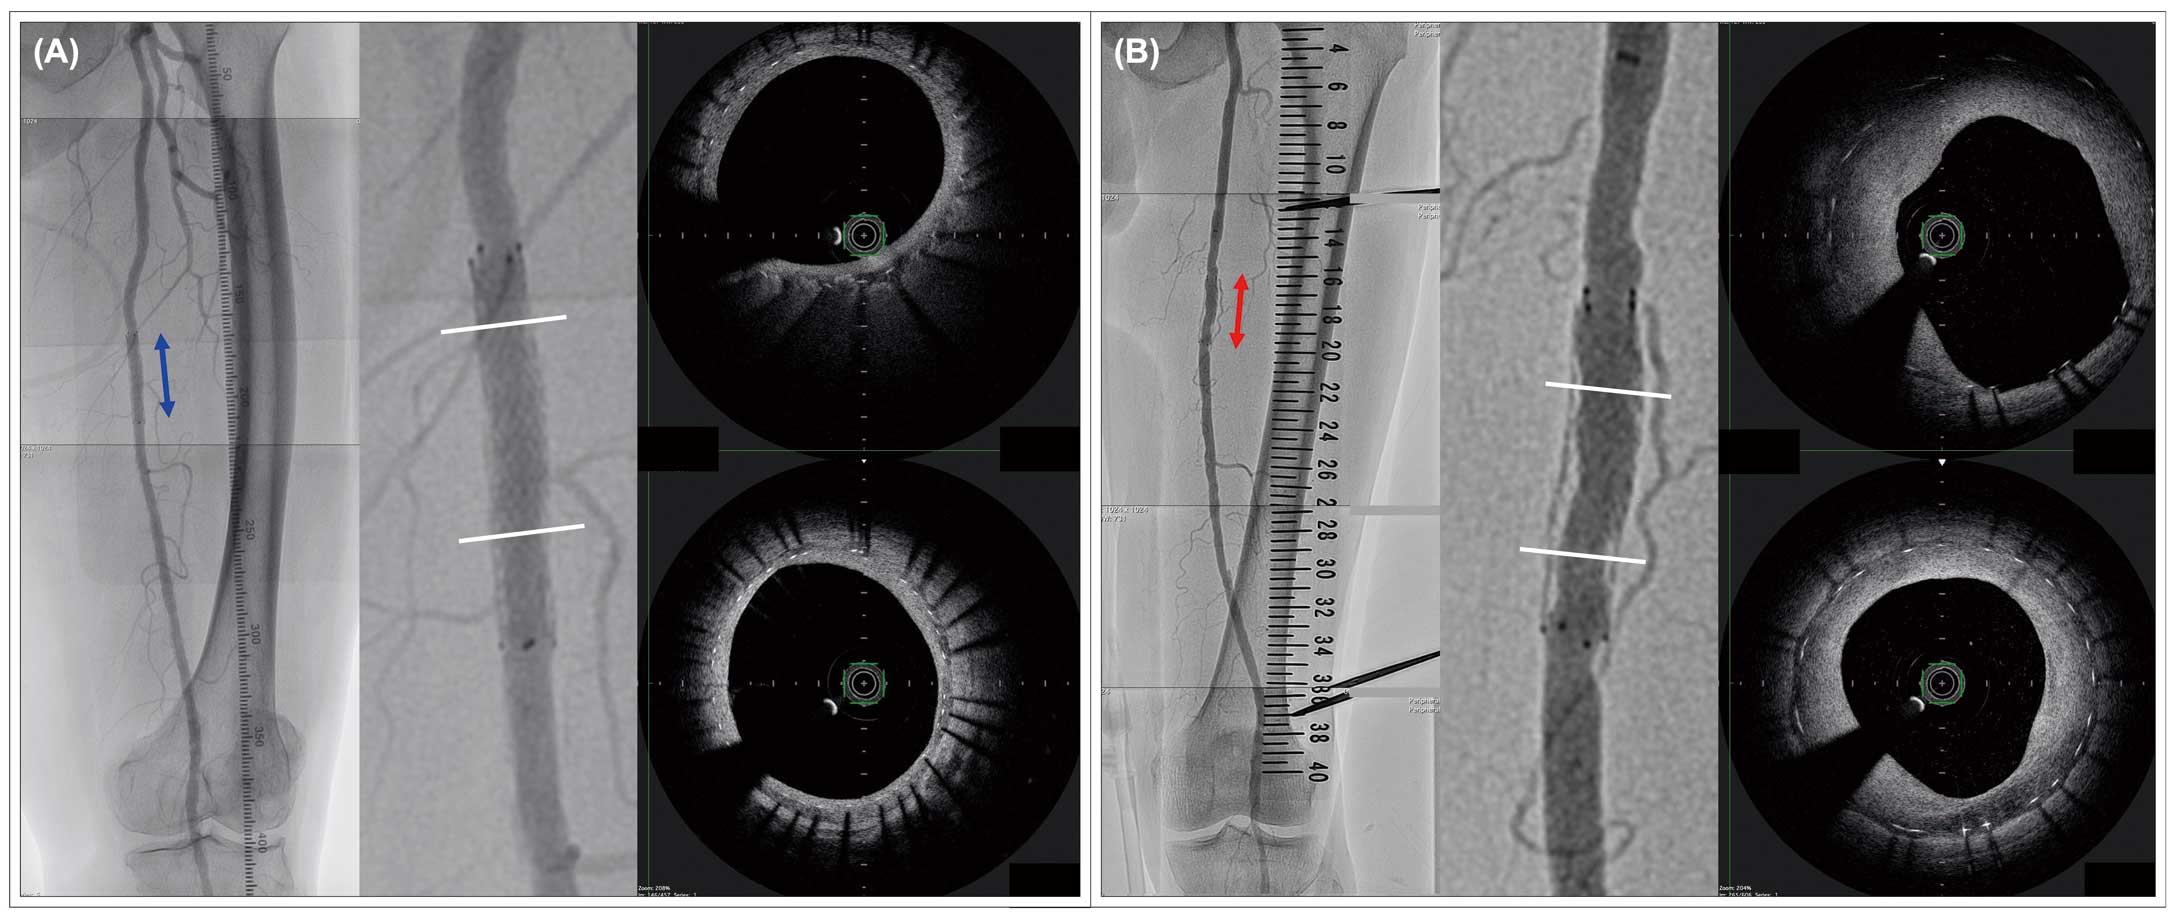
Figure 2, and a representative follow-up OCT images are shown in
Figure 3.
Table 4.
OCT Findings at 6-Month Follow-up
| |
1-mm larger stent
diameter group (n=15) |
2-mm larger stent
diameter group (n=19) |
P value |
| Stented segment |
| Minimum stent area (mm2) |
20.0±2.9 |
21.8±5.6 |
0.28 |
| Maximum stent area (mm2) |
26.1±3.6 |
30.3±5.4 |
0.01 |
| MLA (mm2) |
11.5±3.6 |
11.3±4.4 |
0.88 |
| Max. %cross-sectional narrowing |
48.9±13.4 |
56.1±14.1 |
0.14 |
| Intrastent thrombus |
0 (0) |
0 (0) |
>0.99 |
| Microvessels |
3 (20) |
10 (53) |
0.08 |
| Neointimal appearance at MLA slice |
| Homogeneous |
11 |
14 |
|
| Heterogeneous |
1 |
3 |
0.89 |
| Layered |
3 |
2 |
|
| Stent VI |
23.2±2.5 |
26.8±4.8 |
0.01 |
| Lumen VI |
17.9±2.7 |
17.3±4.7 |
0.69 |
| Neointimal VI |
5.5±1.5 |
9.6±3.4 |
<0.001 |
| Reference segment |
| Proximal lumen VI |
18.9±5.1 |
17.4±5.7 |
0.44 |
| Distal lumen VI |
17.8±4.3 |
17.6±5.6 |
0.90 |
| Stent edge dissection |
2 (13) |
2 (11) |
>0.99 |
Data given as mean±SD or n (%). MLA, minimum lumen area; OCT, optical coherence tomography; VI, volume index (mm3/mm).
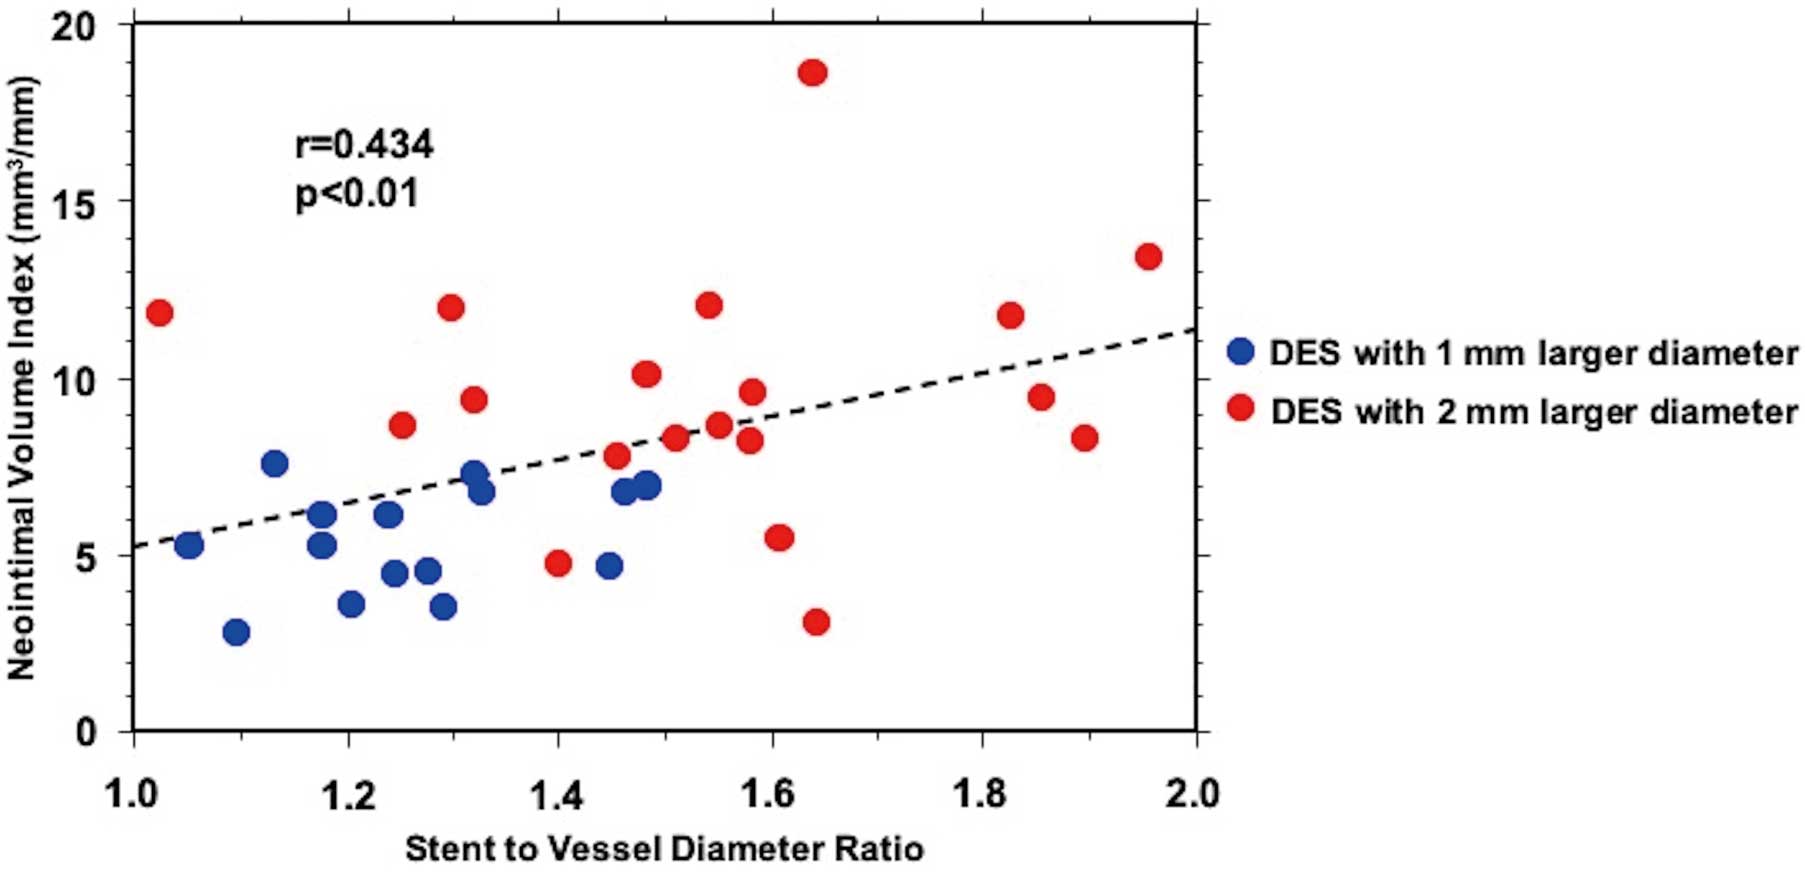
According to the QVA analysis, SV ratio was 1.28 in the 1-mm larger diameter group and 1.54 in the 2-mm larger diameter group (P<0.0001,
Table 3).
Figure 4
shows the association between SV ratio and neointimal VI. Pearson’s correlation analysis revealed that SV ratio positively correlated with the degree of neointimal proliferation at 6-month follow-up (r=0.434, P<0.01).
Discussion
The main findings of this study were as follows: (1) neointimal volume in DES with a 2-mm larger diameter was greater in the chronic phase compared with DES with a 1-mm larger diameter, and (2) the degree of stent oversizing was associated with neointimal volume. To the best of our knowledge, this is the first report showing the influence of oversizing of self-expanding DES on the vascular response in a human peripheral artery.
The mechanism of ISR is related to neointimal hyperplasia, which is an exaggerated healing response to vessel wall injury that occurs as a result of mechanical dilatation. A previous animal study has shown that over-sized self-expanding nitinol stents in the peripheral artery enlarged equal to the respective nominal stent diameter under chronic outward force.10
In addition, a serial OCT analysis reported that self-expanding DES in the human femoropopliteal artery increased 32.1% in stent volume for the 6-month follow-up period.17
An experimental study has also reported that the chronic outward force was stronger in lesions treated using over-sized self-expanding stents with a higher SV ratio.18
Previous studies have shown that the SV ratio positively correlates with angiographic DS and histologic area stenosis.10,11
Moreover, a histological assessment has revealed that SV ratio also positively correlates with the vascular injury score. In a previous report from a swine model,10
iliofemoral artery lesions treated with a higher SV ratio (>1.4) showed exuberant neointimal proliferation and restenosis compared with those treated with a normal SV ratio (<1.4). Another animal study has reported that swine iliofemoral arteries with over-sized (SV ratio: 1.7±0.3) self-expanding stents showed larger late loss and higher rates of restenosis, compared with those with normal-sized (SV ratio: 1.1±0.1) stents.11
In the present study, the discrepancy between nominal stent diameter and baseline mean RLD was 1.3 mm in the 1-mm larger diameter group and 2.3 mm in the 2-mm larger diameter group, and the SV ratio was 1.28 and 1.54, respectively. The optimal cutoff value of the SV ratio, which could be a predictor for ISR, was not identified in our study. However, the data consistently suggested that a considerably high value of SV ratio induces neointimal hyperplasia due to harsh mechanical injury by chronic outward force from the stents. Optimal diameter sizing of self-expanding stents could contribute to superior outcomes in SFA intervention, and further prospective studies with a larger number of patients are required to identify the optimal SV ratio for self-expanding DES.
In the previous animal studies,10,11,18
lumen area in the chronic phase was inferior in lesions treated using self-expanding stents with a higher SV ratio, compared with a lower SV ratio. In our study, however, MLA and lumen volume at follow-up were similar between the diameter groups. A possible explanation for this discrepancy is differences in the study design between the previous animal studies and the present study. Baseline vessel diameter was smaller in lesions with a higher SV ratio compared with those with lesions with a lower SV ratio, and nominal stent diameter was similar between groups in the animal studies. As a result, stent volume was similar between groups and a larger neointimal volume induced inferior lumen area in the chronic phase in lesions with a higher SV ratio. On the other hand, baseline vessel size was similar between groups in our study. Greater stent volume compensated for lumen volume reduction, despite the larger neointimal volume at the follow-up in the 2-mm larger diameter group. Another explanation for the discrepancy is differences in stent type (self-expanding BMS or DES). Paclitaxel induces arrest of the cell cycle in mitosis and inhibition of smooth muscle cell migration, which leads to a small amount of neointimal proliferation.17,19
These effects of paclitaxel attenuated effects of the harsh mechanical injury by chronic outward force from the DES in the 2-mm larger diameter group, which resulted in no difference in lumen volume at the 6-month follow-up between the 2 groups. Despite accelerated neointimal proliferation in the 2-mm larger diameter group, lumen volume at the 6-month follow-up was similar between the 2 groups in this study. However, selection of DES diameter size might have a possible effect on stent patency because mechanical injury by the chronic outward force from the self-expanding stents with a considerably over-sized diameter would continue beyond the 6-month follow-up period. Further randomized, prospective studies with longer follow-up period are expected to conclude the influence of the SV ratio on lumen area following self-expanding DES implantation.
Previous studies have reported that fracture of self-expanding stents is a risk for reducing stent patency in SFA lesions.12,20
The incidence of stent fracture was a concern in lesions with stents with a severely over-sized diameter, however, X-ray examination at 6-month detected only 1 minor stent fracture in the 2-mm larger diameter group. In the morphological OCT analysis, prevalence of intrastent thrombus, microvessels, and edge dissection was similar between groups. Neointimal OCT appearance in the MLA slice was also similar between groups. The subject number of this study was too small to show the effect of diameter sizing on the occurrence of stent fracture or morphological OCT findings.
Study Limitations
This study was an analysis of data from a small sample size in a single center. The sample size calculation was based on a previous report on using self-expanding BMS, but we focused on the vascular response following self-expanding DES implantation. Further multicenter prospective studies are required to reconfirm our results in a larger number of patients using DES. All angiographic parameters, which were obtained during EVT, were evaluated with QVA in the later data analyses. However, selection of stent diameter was according to the operator’s angiographic visual estimation because QVA assessment could not be performed during EVT in the catheter laboratory. This method of selecting the stent diameter could lead to RCT bias. OCT examinations were performed only at 6 months after stent implantation. However, baseline OCT data or OCT data for further longer follow-up periods may be necessary to conclude the vascular response to DES implantation.
Conclusions
Implantation of self-expanding DES with a considerably over-sized diameter resulted in neointimal hyperplasia in SFA lesions.
Acknowledgments
The authors thank the staff in the catheterization laboratory at Hyogo College of Medicine for their excellent assistance during the study.
Data Availability
The deidentified participant data will not be shared.
Disclosures
M.I. is a member of
Circulation Journal
’ Editorial Team.
Financial Support or Funding
None.
IRB Information
The Institutional Review Board of Hyogo College of Medicine, ID: 2425.
References
- 1.
Schillinger M, Sabeti S, Loewe C, Dick P, Amighi J, Mlekusch W, et al. Balloon angioplasty versus implantation of nitinol stents in the superficial femoral artery. N Engl J Med 2006; 354: 1879–1888.
- 2.
Schillinger M, Sabeti S, Dick P, Amighi J, Mlekusch W, Schlager O, et al. Sustained benefit at 2 years of primary femoropopliteal stenting compared with balloon angioplasty with optional stenting. Circulation 2007; 115: 2745–2749.
- 3.
Gray WA, Keirse K, Soga Y, Benko A, Babaev A, Yokoi Y, et al. A polymer-coated, paclitaxel-eluting stent (Eluvia) versus a polymer-free, paclitaxel-coated stent (Zilver PTX) for endovascular femoropopliteal intervention (IMPERIAL): A randomised, non-inferiority trial. Lancet 2018; 392: 1541–1551.
- 4.
Dake MD, Ansel GM, Jaff MR, Ohki T, Saxon RR, Smouse HB, et al. Paclitaxel-eluting stents show superiority to balloon angioplasty and bare metal stents in femoropopliteal disease: Twelve-month Zilver PTX randomized study results. Circ Cardiovasc Interv 2011; 4: 495–504.
- 5.
Dake MD, Ansel GM, Jaff MR, Ohki T, Saxon RR, Smouse HB, et al. Sustained safety and effectiveness of paclitaxel-eluting stents for femoropopliteal lesions: 2-year follow-up from the Zilver PTX randomized and single-arm clinical studies. J Am Coll Cardiol 2013; 61: 2417–2427.
- 6.
Dake MD, Ansel GM, Jaff MR, Ohki T, Saxon RR, Smouse HB, et al. Durable clinical effectiveness with paclitaxel-eluting stents in the femoropopliteal artery: 5-year results of the Zilver PTX randomized trial. Circulation 2016; 133: 1472–1483.
- 7.
Yokoi H, Ohki T, Kichikawa K, Nakamura M, Komori K, Nanto S, et al. Zilver PTX post-market surveillance study of paclitaxel-eluting stents for treating femoropopliteal artery disease in Japan: 12-month results. JACC Cardiovasc Interv 2016; 9: 271–277.
- 8.
Kichikawa K, Ichihashi S, Yokoi H, Ohki T, Nakamura M, Komori K, et al. Zilver PTX post-market surveillance study of paclitaxel-eluting stents for treating femoropopliteal artery disease in Japan: 2-year results. Cardiovasc Intervent Radiol 2019; 42: 358–364.
- 9.
Costa MA, Simon DI. Molecular basis of restenosis and drug-eluting stents. Circulation 2005; 111: 2257–2273.
- 10.
Zhao HQ, Nikanorov A, Virmani R, Jones R, Pacheco E, Schwartz LB. Late stent expansion and neointimal proliferation of oversized Nitinol stents in peripheral arteries. Cardiovasc Intervent Radiol 2009; 32: 720–726.
- 11.
Saguner AM, Traupe T, Räber L, Hess N, Banz Y, Saguner AR, et al. Oversizing and restenosis with self-expanding stents in iliofemoral arteries. Cardiovasc Intervent Radiol 2012; 35: 906–913.
- 12.
Scheinert D, Scheinert S, Sax J, Piorkowski C, Bräunlich S, Ulrich M, et al. Prevalence and clinical impact of stent fractures after femoropopliteal stenting. J Am Coll Cardiol 2005; 45: 312–315.
- 13.
Miki K, Fujii K, Kawasaki D, Shibuya M, Fukunaga M, Imanaka T, et al. Impact of analysis interval size on the quality of optical frequency domain imaging assessments of stent implantation for lesions of the superficial femoral artery. Catheter Cardiovasc Interv 2017; 89: 735–745.
- 14.
Gonzalo N, Serruys PW, Okamura T, van Beusekom HM, Garcia-Garcia HM, van Soest G, et al. Optical coherence tomography patterns of stent restenosis. Am Heart J 2009; 158: 284–293.
- 15.
Kawarada O, Higashimori A, Noguchi M, Waratani N, Yoshida M, Fujihara M, et al. Duplex criteria for in-stent restenosis in the superficial femoral artery. Catheter Cardiovasc Interv 2013; 81: E199–E205.
- 16.
Kawarada O, Hozawa K, Zen K, Huang HL, Kim SH, Choi D, et al. Peak systolic velocity ratio derived from quantitative vessel analysis for restenosis after femoropopliteal intervention: A multidisciplinary review from Endovascular Asia. Cardiovasc Interv Ther 2020; 35: 52–61.
- 17.
Miki K, Fujii K, Shibuya M, Fukunaga M, Imanaka T, Tamaru H, et al. Comparing the vascular response in implantation of self-expanding, bare metal nitinol stents or paclitaxel-eluting nitinol stents in superficial femoral artery lesions: A serial optical frequency domain imaging study. EuroIntervention 2016; 12: 1551–1558.
- 18.
Cho H, Nango M, Sakai Y, Sohgawa E, Kageyama K, Hamamoto S, et al. Neointimal hyperplasia after stent placement across size-discrepant vessels in an animal study. Jpn J Radiol 2014; 32: 340–346.
- 19.
Axel DI, Kunert W, Göggelmann C, Oberhoff M, Herdeg C, Küttner A, et al. Paclitaxel inhibits arterial smooth muscle cell proliferation and migration in vitro and in vivo using local drug delivery. Circulation 1997; 96: 636–645.
- 20.
Iida O, Nanto S, Uematsu M, Ikeoka K, Okamoto S, Nagata S. Influence of stent fracture on the long-term patency in the femoro-popliteal artery: Experience of 4 years. JACC Cardiovasc Interv 2009; 2: 665–671.