Abstract
Prediction models are combinations of predictors to assess the risks of specific endpoints such as the presence or prognosis of a disease. Many novel predictors have been developed, modelling techniques have been evolving, and prediction models are currently abundant in the medical literature, especially in cardiovascular medicine, but evidence is still lacking regarding how to use them. Recent methodological advances in systematic reviews and meta-analysis have enabled systematic evaluation of prediction model studies and quantitative analysis to identify determinants of model performance. Knowing what is critical to model performance, under what circumstances model performance remains adequate, and when a model might require further adjustment and improvement will facilitate effective utilization of prediction models and will enhance diagnostic and prognostic accuracy in clinical practice. In this review article, we provide a current methodological overview of the attempts to implement evidence-based utilization of prognostic prediction models for all potential model users, including patients and their families, health-care providers, administrators, researchers, guideline developers and policy makers.
The aim of medicine is the prediction and prevention of occurrence or progression of a disease. Clinicians classify patients according to diagnosis and severity in order to provide best-evidence prevention to reduce risk. Accurate prediction is one of the eternal goals of medicine and medical research, and is explored by way of identifying effective predictors and their optimal combinations. Genomic information is currently utilized as predictors, and artificial intelligence has been used to optimize the combination of predictors.
A prediction model is a formal combination of multiple predictors from which the risk of a specific endpoint can be calculated.1
The endpoint can be either disease presence (diagnostic model) or future occurrence of health outcomes (prognostic model). The Framingham risk score,2
CHADS2
score,3
TIMI risk score4,5
(the thrombolysis in myocardial infarction), and SYNTAX score6
(the synergy between percutaneous coronary intervention with Taxus and cardiac surgery) are familiar to every cardiologist. Risk classification tools such as the Killip and the Forrester classifications7,8
are also prediction models in a broad sense. Moreover, all medical information collected from patients is meant to be predictors and is combined to predict outcomes in evidence-based medicine, whether or not formulated.9
Therefore, prediction models are relevant not only to researchers or statisticians, but also to clinicians.
What if the evidence-based predictors or prediction models are, in fact, useless for real-world patients? How do we know whether evidence-based prediction models are applicable to patients? For what condition are they applicable? A plethora of prediction models have been proposed, especially in cardiovascular medicine,10
and some of them are recommended for use in clinical guidelines. It remains unclear, however, which model to use in which context, and to what extent these models are effective for the target patients.11–16
It is traditionally recommended to select models that have had successful replication in a variety of cohorts,17
and follow expert opinions.1
Nevertheless, successful replication in other populations does not ensure that the model is also effective in the target patients until the rationale for the model performance is elucidated, because it may be that only those studies with successful results are reported.
Researchers have explored the determinants of model performance since the 1980s,18,19
but empirical evidence is still limited.20
Recent methodological advances in systematic reviews and meta-analysis have encouraged systematic evaluation and quantitative analysis of prediction models, which will facilitate studies to explore effective utilization of prediction models in any medical field.
In this review article, we present a current methodological overview in order for all potential model users to be aware of appropriate utilization of prognostic prediction models, including patients and their families, health-care providers, administrators, researchers, guideline developers and policy makers.
What Is A Prediction Model?
A prediction model is a formal combination of multiple predictors from which risk of a specific endpoint can be calculated.1
Many modelling techniques are currently available such as neural networks, decision trees, genetic programing, and support vector machine learning models.12
In the medical literature, regression approaches such as logistic regression and Cox regression modeling are still most commonly used.
Modelling is the use of mathematical or statistical models to simulate outcomes using available data. Logistic regression of a binary outcome consisting of predictor variables is expressed as:
ln(p/(1−p)) = α+β1X1+β2X2+β3X3+…
where “p” is the probability of having or developing the disease or outcome, “α” is the model intercept, and “βi” is the coefficient of predictor “Xi”.
A survival regression model, such as a Cox regression model of a time-to-event outcome, is expressed as:
h(t) = h0(t)exp(β1X1+β2X2+β3X3…)
where “h(t)” is the hazard rate of the outcome at time, and the intercept term “h0(t)” is the baseline hazard rate.
Scoring systems are often developed for the purpose of handy clinical use, using regression coefficients to assign weights, such as in the Framingham score.2
What Determines Model Performance?
The dataset on which a prediction model is developed is called the derivation set or the training set. Once a prediction model is developed, its performance needs to be replicated and tested in samples other than the original study.1,9
Such external samples are called the validation set or the testing set. Examination of the model’s performance within the derivation set is called internal validation, whereas that in the validation set is called external validation. Empirical evidence has shown that model performance varies across validation studies beyond the range of random error.11–16
Model performance is directly determined by the component variables (Xi) and their coefficients (βi). The selection and weighting of model predictors are affected by the characteristics of the derivation studies, although it is unclear which characteristics are determinative. Empirically, prediction models have the best performance in the derivation cohort due to a phenomenon called overfitting or overtraining. Therefore, it has been widely recommended to select and apply models derived from samples similar to the population to which it will be applied.14,16,21
Perfect match, however, cannot be expected. Temporal and/or geographical differences between derivation and validation cohorts will always exist. Baseline risks such as disease prevalence and outcome incidence may be different with different standards of care. The population recruited in the derivation study may largely deviate from the population of interest due to eligibility criteria or unreported reasons. Different populations will have a different predictor-outcome relationship, and this affects the model performance (so-called casemix or patient spectrum effect).14,15,22
Apart from population similarity, the source of data, study design, sample size, outcomes to be predicted, modelling methods, and study quality of the original research may affect model performance.
For efficient model use, it is important to clarify which characteristics of the original derivation studies are critical to the model performance, under what circumstances the model performance remains adequate, and when the model might require further adjustment and improvement.11–13
How to Identify Determinants of Model Performance
Evidence synthesis of existing prediction models would be a unique opportunity to address this issue. Determinants of model performance have been sought since the 1980 s by Wasson et al18
and Charlson et al,19
but empirical evidence is still limited.20
Recent methodological advances in systematic reviews and meta-analysis of prediction models have developed infrastructures to facilitate research to explore determinants of model performance.
A systematic review is an attempt to collate all empirical evidence that fits pre-specified eligibility criteria in order to answer a specific research question.23
The general process of reviews includes defining review questions, identifying relevant studies from the literature, extracting data with critical appraisal, data synthesis and interpretation.11,23
Guides for each review process have been developed for prediction model studies, and Moons et al have recently compiled a list of them.20
Among these, the so-called CHARMS checklist (check list for critical appraisal and data extraction for systematic review of prediction modelling studies)24
and PROBAST (prediction model risk of bias assessment tool)20,25
provide systematic assessment tools for prediction model studies in terms of frameworks and quality of the studies. A guide for primary reports of prediction model studies is also provided (TRIPOD; Transparent Reporting of a multivariable prediction model for Individual Prognosis Or Diagnosis).9
The concept of the model performance gap between the derivation and the validation studies, and its determinants, is shown in
Figure 1.

Meta-analysis is the statistical combination of results from two or more separate studies.23
In order to synthesize the results from overall studies, summary measures need to be defined. Discrimination and calibration are the two key summary measures of model performance. Discrimination refers to a prediction model’s ability to distinguish between to distinguish between subjects developing and not developing the outcome of interest. The concordance (C) statistic is the most common measure of discrimination. Calibration refers to a model’s accuracy in the prediction of risk probabilities to develop outcomes of interest. It is often reported as a graph, with expected outcome probabilities plotted against observed outcome frequencies (so-called calibration plots). The ratio of the total number of observed and expected outcome events (O:E ratio) gives an approximate indication of the overall model calibration.
There are two major types of meta-analysis related to how summary measures are obtained: aggregate data meta-analysis; and individual participant data meta-analysis.
Aggregate data meta-analysis is the traditional form of meta-analysis developed in systematic reviews of interventions. It uses summary measures extracted from journal publications. Guides have been provided by Debray et al.11,13
In general, determinants of model performance are explored by performing multivariable regression analysis (so-called meta-regression analysis) and/or subgroup analysis.
Individual participant data meta-analysis uses summary measures obtained by model replication in the individual participant data. Generally, “individual participant data” indicates a large amount of combined cohort data collected from multiple studies addressing the same research question or topic.26
Increasing numbers of reports using this meta-analysis method for prediction model studies have been reported over the last decade12
and, accordingly, a number of guides have been provided,12,15,27
although most of the studies do not consider between-study heterogeneity and its source.28
We present two types of example studies investigating the determinants of model performance. The first case is an example of the application of a single model to multiple populations. Riley et al extended a previously reported validation study of QRISK2 (the second version of the cardiovascular disease risk score)29
using data from 364 general practices, and found that the model performance (c-statistic) was related to the age and percentage of smokers of the population in each practice on meta-regression analysis.15
The second case is an example of the application of multiple models to a large diverse population. Kengne et al validated and compared 12 systematically identified incident diabetes models in a large international case–cohort sample.30
They performed subgroup analysis with performance measures of discrimination and calibration, and found that model performance varied with country, age, sex and adiposity in the validation cohort.30
As shown in the aforementioned typical examples, determinants of model performance seem to be explored by investigating the association between model performance and heterogeneity of the validation cohort. In a field where various competing prediction models are available, especially in cardiovascular medicine, another method to identify the determinants of model performance is to investigate the association between model performance and the characteristics of original derivation studies. We compared the results of aggregate data meta-analysis and individual data analysis.
Determinants of Model Performance in Heart Failure
We first present two representative aggregate data meta-analysis studies of heart failure (HF) prognostic models reported simultaneously in the same issue of a journal. Next, we apply the models used in the two reviews to real-world HF cohort data to compare the results.
Ouwerkerk et al conducted aggregate data meta-analysis using 117 systematically identified HF prognostic models reported in 55 papers.31
The mean c-statistic of the identified mortality models was 0.66±0.0005. They reported that the strongest predictors were blood urea nitrogen (BUN) and serum sodium, and that the number of predictors included in the final models was significantly related to the c-statistics. As for study characteristics, those models derived from studies with a prospective design, claims data and large sample size had higher c-statistics than those with a retrospective design and data based on medical records. Diagnosis of acute or chronic HF, age and male percentage of the derivation cohort were not significantly related to the model performance.31
Rahimi et al also conducted aggregate data meta-analysis reviewing 64 models in 48 studies.32
The c-statistics ranged from 0.60 to 0.89. They reported that mortality models had higher c-statistics than models with other modelling outcomes. The sample size (small <1,000, medium <5,000, or large) and source of data (trial data, primary data, patient records, or administrative data), and study design (prospective or retrospective) were not significantly associated with the model performance.32
Calibration measures were not evaluated in either review.
For comparison, we replicated HF prognostic models identified in the aforementioned two reviews using a cohort of HF. We extracted 44 prediction models from among 103 pooled articles (Figure 2). As a validation cohort, we used data from a single-center prospective cohort of hospitalized HF patients under approval of the local ethics committee (M26-116-3). We have previously described the detailed information of this cohort.33,34
In brief, the cohort consisted of consecutive patients admitted during the study period January 2013–May 2016 in a tertiary hospital in Japan for the first episode of rapid onset or worsening symptoms and/or signs of HF. We utilized the data of all 834 patients (76±12 years, 60% male) discharged alive with a median follow-up of 720 days (IQR, 275–991 days), during which 91 (11%) died in the 1 year since discharge. The identified models were used to predict 1-year mortality at the time of discharge and to calculate the c-statistics. We investigated the association between variables and model performance using unpaired t-test or analysis of variance for nominal and categorical variables, and simple linear regression analysis for continuous variables. For the evaluation items, we followed the definitions in the two reviews.31,32

As a result, the validated c-statistics were relatively normally distributed with a mean of 0.65±0.05 (Figure 3).
Table
shows the association between the characteristics of the original derivation studies and model performance. Like the Ouwerkerk et al study, a larger sample size was significantly related to higher c-statistics (P=0.04), while patient diagnosis (whether acute or chronic HF) was not (P=0.54). The study year, represented by publication year, was significantly associated with model performance (standardized β=0.46; 95% CI: 0.18–0.71, P=0.002), suggesting that models developed in recent similar medical circumstances work better (Figure 4). As for model components, the number of predictors included in the final prediction models was significantly associated with the c-statistics (standardized β=0.39; 95% CI: 0.09–0.63, P=0.01), which was consistent with the Ouwerkerk et al study. In contrast, inclusion of sodium and BUN was not significantly related to the model performance (P=0.50, 0.77). Instead, inclusion of age, gender, and weight was relevant to the model performance (P=0.02, 0.005 and <0.001).
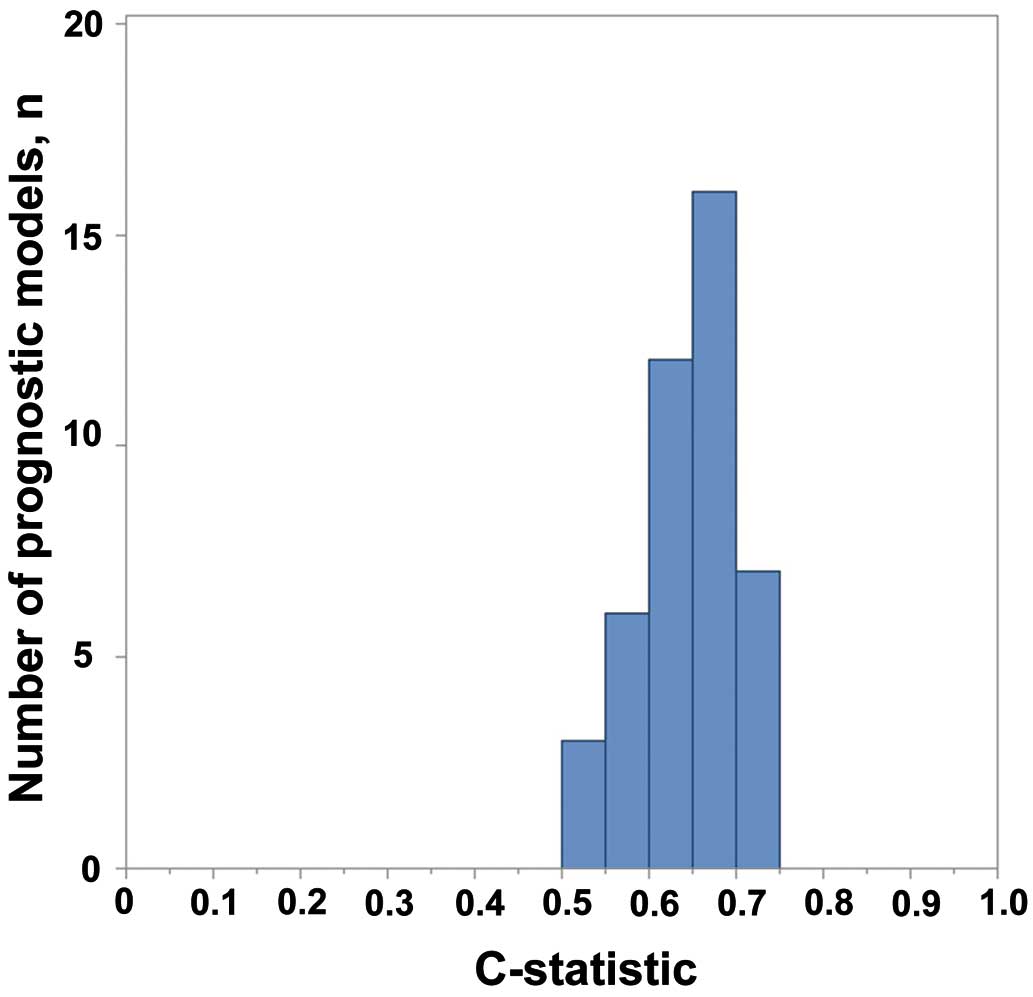
Table.
Impact of Study Characteristics on Prediction Model External Validity
| Characteristic of original derivation study |
Overall
(n=44) |
c-statistic or standard β
coefficient (95% CI) |
P-value |
| Source of data |
| Medical record |
37 |
0.65±0.06 |
0.93 |
| Claim data |
7 |
0.65±0.05 |
| Prospective |
30 |
0.64±0.06 |
0.45 |
| Retrospective |
14 |
0.66±0.03 |
| Participants |
| Diagnosis |
| Acute heart failure |
9 |
0.66±0.02 |
0.54 |
| Chronic heart failure |
35 |
0.64±0.06 |
|
| Derivation sample size |
| Large |
11 |
0.67±0.04 |
0.04 |
| Medium: n<5,000 |
16 |
0.66±0.06 |
| Small: n<1,000 |
17 |
0.62±0.05 |
| Participant age (years) |
70±6 |
0.29 (−0.01 to 0.55) |
0.06 |
| Male participants (%) |
61±15 |
0.30 (0.01 to 0.57) |
0.04 |
| Study dates: publication year |
2010 (2005 to 2012) |
0.46 (0.18 to 0.71) |
0.002 |
| Outcome to be predicted |
| Death |
39 |
0.65±0.05 |
|
| Death and hospitalization |
3 |
0.65±0.08 |
0.94 |
| Hospitalization |
2 |
0.63±0.04 |
|
| Time from prediction to outcome measurement (days) |
365 (60 to 1,038) |
0.08(−0.21 to 0.37) |
0.56 |
| Model development |
| Modelling method |
| Survival regression model |
31 |
0.65±0.06 |
0.39 |
| Logistic regression model |
13 |
0.64±0.05 |
| Predictors in the final model |
| No. predictors |
8 (5 to 14) |
0.39 (0.09 to 0.63) |
0.01 |
| Inclusion of age |
31 |
0.66±0.05 |
0.02 |
| Exclusion of age |
13 |
0.62±0.06 |
| Inclusion of gender |
16 |
0.68±0.04 |
0.005 |
| Exclusion of gender |
28 |
0.63±0.05 |
| Inclusion of weight, BMI |
14 |
0.69±0.04 |
<0.001 |
| Exclusion of weight, BMI |
30 |
0.63±0.05 |
| Inclusion of BP |
26 |
0.65±0.06 |
0.78 |
| Exclusion of BP |
18 |
0.64±0.05 |
| Inclusion of LVEF |
17 |
0.66±0.06 |
0.39 |
| Exclusion of LVEF |
27 |
0.64±0.05 |
| Inclusion of BUN |
12 |
0.65±0.05 |
0.77 |
| Exclusion of BUN |
32 |
0.65±0.06 |
| Inclusion of sodium |
19 |
0.65±0.03 |
0.50 |
| Exclusion of sodium |
25 |
0.64±0.07 |
| Inclusion of BNP |
12 |
0.67±0.03 |
0.14 |
| Exclusion of BNP |
32 |
0.64±0.06 |
Data given as mean±SD, n (%) or median (IQR). BMI, body mass index; BNP, brain natriuretic peptide; BP, blood pressure; BUN, blood urea nitrogen; LVEF, left ventricular ejection fraction.

Advantages and Disadvantages of Analytic Methods
We obtained partly consistent and partly different results from the existing systematic reviews despite applying models used in the reviews. In general, aggregate data meta-analysis has a number of serious bias problems because aggregate data are often not available, poorly reported, derived and presented differently across studies, and are likely to be reported when statistically or clinically significant results are obtained.27
Furthermore, so-called ecological bias (discrepancy of trends between individual- and group-level data) is also problematic.11,27
In contrast, individual data enable standardization of analysis across studies and direct derivation of the information desired, independent of significance or how they are reported.27
Most of the individual participant data meta-analyses of prediction models use combined existing cohorts regardless of the heterogeneity across them, and investigate the association between model performance and heterogeneity. An unmeasured potential source of heterogeneity across studies, such as study quality, can be problematic when dealing with big combined datasets.27
We investigated the association between model performance and the characteristics of derivation studies using a homogeneous cohort of representative HF patients in Japan. The generalizability of the results obtained from one cohort may be limited, but, at least, when applying prediction models to similar Japanese hospitalized HF patients for optimal severity classification at discharge, a better strategy than simply following expert opinions would be to select recently reported models consisting of many variables including important predictors such as age, sex, and weight derived from large sample-size studies. More importantly, differences in stage of illness (e.g., whether the derivation sample is acute or chronic HF) and the period to outcome measurement in the original derivation studies (even if the original outcome is not 1-year mortality) may be acceptable when models with perfect match cannot be expected. This information will be useful, although limited, for on-site model users in Japan, including health-care providers, local guideline developers and policy makers.
Future Perspectives
In the aforementioned example study, the question of what produced the yearly increase in model performance remains an issue. It could be attributable to similarity of patients and medical circumstances, improvement of study quality or many other possible reasons. Systematic evaluation of derivation studies with identification of key determinants is necessary for further investigation. CHARMS and PROBAST are currently available for this purpose. These are tools to evaluate the characteristics of derivation studies in general. Disease-specific modification or addition will be effective in order to elucidate the keys to improve model performance in that medical field.
In terms of multivariable analysis to identify determinants, an adequate number of existing prediction models is needed. If the purpose of analysis is to identify the determinants in study characteristics, then including predictor-finding studies (that identify the relevance of predictors and outcomes) in addition to prediction model studies (that develop, validate or update prediction models) may be one solution. Also, causal relationships needs to be carefully taken into account. For example, direct comparison of model components and study characteristics is not valid because the selection of variables to include in the model and the assignation of weight to them are determined by the study characteristics: that is, model components are intermediate factors in the causal pathways between model performance and study components.
Conclusions
Recent methodological developments in systematic reviews and meta-analysis of prediction models will encourage evidence-based utilization of prediction models and are relevant to all model users including patients and their families, health-care providers, administrators, researchers, guideline developers and policy makers.
Disclosures
The cohort study related to this work was supported by a grant from the Japan Cardiovascular Research Foundation (to T.A., 24-4-2) and a grant-in-aid for Young Scientists from the Japan Society for the Promotion of Science (to T.N., 15K19402). The authors declare no conflicts of interest.
References
- 1.
Steyerberg EW, Moons KG, van der Windt DA, Hayden JA, Perel P, Schroter S, et al. Prognosis Research Strategy (PROGRESS) 3: Prognostic model research. PLoS Med 2013; 10: e1001381.
- 2.
Wilson PW, D’Agostino RB, Levy D, Belanger AM, Silbershatz H, Kannel WB. Prediction of coronary heart disease using risk factor categories. Circulation 1998; 97: 1837–1847.
- 3.
Gage BF, Waterman AD, Shannon W, Boechler M, Rich MW, Radford MJ. Validation of clinical classification schemes for predicting stroke: Results from the National Registry of Atrial Fibrillation. JAMA 2001; 285: 2864–2870.
- 4.
Antman EM, Cohen M, Bernink PJ, McCabe CH, Horacek T, Papuchis G, et al. The TIMI risk score for unstable angina/non-ST elevation MI: A method for prognostication and therapeutic decision making. JAMA 2000; 284: 835–842.
- 5.
Hamm CW, Goldmann BU, Heeschen C, Kreymann G, Berger J, Meinertz T. Emergency room triage of patients with acute chest pain by means of rapid testing for cardiac troponin T or troponin I. N Engl J Med 1997; 337: 1648–1653.
- 6.
Serruys PW, Morice MC, Kappetein AP, Colombo A, Holmes DR, Mack MJ, et al. Percutaneous coronary intervention versus coronary-artery bypass grafting for severe coronary artery disease. N Engl J Med 2009; 360: 961–972.
- 7.
Killip T 3rd, Kimball JT. Treatment of myocardial infarction in a coronary care unit: A two year experience with 250 patients. Am J Cardiol 1967; 20: 457–464.
- 8.
Forrester JS, Diamond G, Chatterjee K, Swan HJ. Medical therapy of acute myocardial infarction by application of hemodynamic subsets (first of two parts). N Engl J Med 1976; 295: 1356–1362.
- 9.
Collins GS, Reitsma JB, Altman DG, Moons KG. Transparent Reporting of a multivariable prediction model for Individual Prognosis or Diagnosis (TRIPOD): The TRIPOD statement. Ann Intern Med 2015; 162: 55–63.
- 10.
Wessler BS, Lai Yh L, Kramer W, Cangelosi M, Raman G, Lutz JS, et al. Clinical prediction models for cardiovascular disease: Tufts Predictive Analytics and Comparative Effectiveness clinical prediction model database. Circ Cardiovasc Qual Outcomes 2015; 8: 368–375.
- 11.
Debray TP, Damen JA, Snell KI, Ensor J, Hooft L, Reitsma JB, et al. A guide to systematic review and meta-analysis of prediction model performance. BMJ 2017; 356: i6460.
- 12.
Debray TP, Riley RD, Rovers MM, Reitsma JB, Moons KG. Individual participant data (IPD) meta-analyses of diagnostic and prognostic modeling studies: Guidance on their use. PLoS Med 2015; 12: e1001886.
- 13.
Debray TP, Damen JA, Riley RD, Snell K, Reitsma JB, Hooft L, et al. A framework for meta-analysis of prediction model studies with binary and time-to-event outcomes. Stat Methods Med Res 2019; 28: 2768–2786.
- 14.
Moons KG, Altman DG, Vergouwe Y, Royston P. Prognosis and prognostic research: Application and impact of prognostic models in clinical practice. BMJ 2009; 338: b606.
- 15.
Riley RD, Ensor J, Snell KI, Debray TP, Altman DG, Moons KG, et al. External validation of clinical prediction models using big datasets from e-health records or IPD meta-analysis: Opportunities and challenges. BMJ 2016; 353: i3140.
- 16.
Debray TP, Vergouwe Y, Koffijberg H, Nieboer D, Steyerberg EW, Moons KG. A new framework to enhance the interpretation of external validation studies of clinical prediction models. J Clin Epidemiol 2015; 68: 279–289.
- 17.
Justice AC, Covinsky KE, Berlin JA. Assessing the generalizability of prognostic information. Ann Intern Med 1999; 130: 515–524.
- 18.
Wasson JH, Sox HC, Neff RK, Goldman L. Clinical prediction rules: Applications and methodological standards. N Engl J Med 1985; 313: 793–799.
- 19.
Charlson ME, Ales KL, Simon R, MacKenzie CR. Why predictive indexes perform less well in validation studies: Is it magic or methods? Arch Intern Med 1987; 147: 2155–2161.
- 20.
Moons KGM, Wolff RF, Riley RD, Whiting PF, Westwood M, Collins GS, et al. PROBAST: A tool to assess risk of bias and applicability of prediction model studies: Explanation and elaboration. Ann Intern Med 2019; 170: W1–W33.
- 21.
Altman DG, Vergouwe Y, Royston P, Moons KG. Prognosis and prognostic research: Validating a prognostic model. BMJ 2009; 338: b605.
- 22.
Vergouwe Y, Moons KG, Steyerberg EW. External validity of risk models: Use of benchmark values to disentangle a case-mix effect from incorrect coefficients. Am J Epidemiol 2010; 172: 971–980.
- 23.
Higgins JPT, Green S, Cochrane Collaboration. Cochrane handbook for systematic reviews of interventions. Chichester, UK: Wiley-Blackwell, 2008.
- 24.
Moons KG, de Groot JA, Bouwmeester W, Vergouwe Y, Mallett S, Altman DG, et al. Critical appraisal and data extraction for systematic reviews of prediction modelling studies: The CHARMS checklist. PLoS Med 2014; 11: e1001744.
- 25.
Wolff RF, Moons KGM, Riley RD, Whiting PF, Westwood M, Collins GS, et al. PROBAST: A tool to assess the risk of bias and applicability of prediction model studies. Ann Intern Med 2019; 170: 51–58.
- 26.
Stewart LA, Clarke M, Rovers M, Riley RD, Simmonds M, Stewart G, et al. Preferred Reporting Items for Systematic Review and Meta-Analyses of individual participant data: The PRISMA-IPD Statement. JAMA 2015; 313: 1657–1665.
- 27.
Riley RD, Lambert PC, Abo-Zaid G. Meta-analysis of individual participant data: Rationale, conduct, and reporting. BMJ 2010; 340: c221.
- 28.
Ahmed I, Debray TP, Moons KG, Riley RD. Developing and validating risk prediction models in an individual participant data meta-analysis. BMC Med Res Methodol 2014; 14: 3.
- 29.
Collins GS, Altman DG. Predicting the 10 year risk of cardiovascular disease in the United Kingdom: Independent and external validation of an updated version of QRISK2. BMJ 2012; 344: e4181.
- 30.
Kengne AP, Beulens JW, Peelen LM, Moons KG, van der Schouw YT, Schulze MB, et al. Non-invasive risk scores for prediction of type 2 diabetes (EPIC-InterAct): A validation of existing models. Lancet Diabetes Endocrinol 2014; 2: 19–29.
- 31.
Ouwerkerk W, Voors AA, Zwinderman AH. Factors influencing the predictive power of models for predicting mortality and/or heart failure hospitalization in patients with heart failure. JACC Heart Fail 2014; 2: 429–436.
- 32.
Rahimi K, Bennett D, Conrad N, Williams TM, Basu J, Dwight J, et al. Risk prediction in patients with heart failure: A systematic review and analysis. JACC Heart Fail 2014; 2: 440–446.
- 33.
Iwakami N, Nagai T, Furukawa TA, Sugano Y, Honda S, Okada A, et al. Prognostic value of malnutrition assessed by Controlling Nutritional Status score for long-term mortality in patients with acute heart failure. Int J Cardiol 2017; 230: 529–536.
- 34.
Nagai T, Nishimura K, Honma T, Higashiyama A, Sugano Y, Nakai M, et al. Prognostic significance of endogenous erythropoietin in long-term outcome of patients with acute decompensated heart failure. Eur J Heart Fail 2016; 18: 803–813.
