Abstract
The binding mode and affinity of isoeuxanthone (1,6-dihydroxyxanthone) (1) and its piperidinyl derivative (1-hydroxy-6-(2-(1-piperidinyl)ethoxy)xanthone) (2) with calf thymus DNA were studied using absorption spectroscopy, fluorescence spectroscopy, circular dichroism (CD) spectroscopy and viscosity measurements. Results indicate that the two xanthones can intercalate into the DNA base pairs by the plane of xanthone ring and the binding affinity of the piperidinylethoxy substituted xanthone 2 is stronger than 1. In addition, the cytotoxic effects of both compounds were evaluated with the human cervical cancer cell line (HeLa) and human hepatocellular liver carcinoma cell line (HepG2) using acid phosphatase assay. Analyses show that the piperidinylethoxy substituted xanthone exhibits more effective cytotoxic activity than isoeuxanthone against the two cancer cells. The effects on the inhibition of tumor cells in vitro agree with the studies of DNA-binding.
Xanthones are secondary metabolites commonly occurring in a few higher plant families and microorganisms. They have a large variety of biological activities including antihypertensive, antioxidative, antithrombotic, and anticancer activities according to their diverse structures.1–5) Because of the simple and interesting structural scaffolds and wide biological profiles of xanthones, researchers have endeavored to isolate or synthesize numerous derivatives of xanthone compounds as potential drug candidates. Especially, the effective inhibitory activity against human cancer cell lines has attracted considerable attention.6–10) The preliminary work has highlighted the high potentials of xanthones as a promising building motif for the development of a new class of potent anticancer drugs.
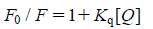
Numerous biological experiments have demonstrated that the antitumor activity of drugs is related to their mode of interaction with DNA, where groove binding and intercalation are known to be important. However, the systematic studies of the interaction of the xanthone compounds with DNA have been reported rarely,6,8,11) and their structure–activity relationships remain unestablished in the xanthones system. Lin and coworkers report that 2,3-epoxypropoxy substituted xanthones have efficiently inhibited growth of cancer cells and xanthone possessing two 2,3-epoxypropoxy groups at 3 and 5 position showed most active anticancer activity in the series prepared.12,13) The structural features inherent in xanthone derivatives make us aware that the substitute groups in xanthones may have significant influence on the biological activity. With this rational in mind, we have investigated the binding mode on the interactions of isoeuxanthone (1,6-dihydroxyxanthone) (1) and its piperidinyl derivative (1-hydroxy-6-(2-(1-piperidinyl)ethoxy)xanthone) (2) (shown in Fig. 1) with DNA by different kinds of spectrophotometric methods in this work. The studies suggest that intercalative binding mode appears to be acceptable. In addition, the xanthones were evaluated for cytotoxic activities toward human cervical cancer cell line (HeLa) and human hepatocellular liver carcinoma cell (HepG2) by acid phosphatase assay. Both of them showed exhibiting significant cytotoxicity in vitro. These results reveal that the xanthones as interesting scaffolds to look for potential anticancer drugs.
Fig. 1. The Structures of Isoeuxanthone (1) and Piperidinyl Derivative (2)
Experimental
MaterialsThe compounds 1 and 2 were prepared according to the literature14) with some improvement (shown in Fig. S1, see Supplementary data). All the chemicals were reagent grade and were used without further purification. Calf thymus DNA (ct DNA) and ethidium bromide (EB) were obtained from Sigma Chemical Co. All the measurements involving the interactions of the two compounds with ct DNA were carried out in the buffer prepared with doubly distilled water containing 5 mm Tris[Tris(hydroxymethyl)aminomethane] and 50 mm NaCl, and adjusted to pH 7.1 with hydrochloric acid. UV/Vis spectrometer was employed to check a solution of ct DNA purity (A260 : A280>1.80) and the concentration (ε=6600 m−1 cm−1 at 260 nm) in the buffer.15,16)
InstrumentsThe UV-Vis absorption spectra were recorded using a Varian Cary 100 spectrophotometer and fluorescence emission spectra were recorded using a Hitachi F-4500 spectrofluorophotometer equipped with a xenon lamp source and a quartz cell of 1 cm path length. The circular dichroism (CD) spectra were recorded on a JASCO J-810 spectropolarimeter.
DNA-Binding MeasurementsAbsorption titration experiments were performed by fixing concentration of the two compounds as constant at 10 µm while varying the concentrations of ct DNA. The competitive binding experiments of fluorescence spectra were carried out by maintaining the EB and ct DNA concentration at 3 µm and 30 µm, respectively, while increasing the concentrations of the compounds. Fitting was completed using an Origin 6.0 spreadsheet, where values of the binding constants Kb and Stern–Volmer quenching constants Kq were calculated.
The CD spectra of DNA were recorded on a Jasco J-810 spectropolarimeter at 25.0±0.1°C. Calf thymus DNA used were 120 µm in concentration and compounds solutions were added to a ratio of 1 : 3 (DNA/compound). Each sample solution was scanned in the range of 220–450 nm. CD spectrum was generated which represented the average of three scans from which the buffer background had been subtracted.
Viscosity experiments were carried out on an Ubbelodhe viscometer, immersed in a thermostated water-bath maintained at 25.0±0.1°C. Titrations were performed for the compounds (1–6 µm), and each compound was added into DNA solution (50 µm) present in the viscometer. Flow time was measured with a digital stopwatch and each sample was measured three times and an average flow time was calculated. Data were presented as (η/η0)1/3 versus the ratio of the concentration of the compound and DNA, where η is the viscosity of DNA in the presence of the compound, and η0 is the viscosity of DNA alone. Viscosity values were calculated from the observed flow time (t) of DNA-containing solution corrected from the flow time of buffer alone (t0), η=t−t0.17,18)
Acid Phosphatase AssayThe reagent, p-nitrophenyl phosphate (p-NPP), was obtained from Amresco. The compounds were dissolved in dimethyl sulphoxide (DMSO) and diluted in culture medium. The final concentration of DMSO in cultures was always not exceeding 0.5% (v/v), which did not cause toxicity. The HeLa and HepG2 cells obtained from ATCC were maintained in Dulbecco’s modified Eagle’s medium (DMEM) with 10% fetal bovine serum (FBS), 100 U/mL penicillin and 100 mg/mL streptomycin. Cells were cultured at 37°C in a humidified atmosphere of 5% CO2 in air.
Two different cell lines, uterine cervix carcinoma cell HeLa and human hepatocellular liver carcinoma cell HepG2 were plated in 96-well plates. The adherent cells, HeLa and HepG2 were plated at a density of 5×10⁴ cells/mL, and then treated with varied concentration (10, 50, 100, 200, 300 µm) of the compounds. The culture medium was removed from the plates after 48 and 72 h of culture, and each well was washed once with 200 µL phosphate-buffered saline (PBS, pH=7.2). To each well, 100 µL of buffer containing 0.1 m sodium acetate (pH=5.0), 0.1% Triton X-100, and 5 mm p-NPP was added. The reaction was stopped with the addition of 10 µL of 1 m NaOH, and color development was assayed at 405 nm using a microplate reader (Victor3 1420-050). The nonenzymatic hydrolysis of the p-NPP substrate was determined for each assay by including wells that did not contain cells as blank wells. Cell survival was expressed as an absorbance (A) percentage defined by (Adrug-blank/Acontrol-blank×100).
Results and Discussion
Electronic Absorption SpectraThe application of electronic absorption spectroscopy is one of the most useful techniques for DNA-binding studies of small molecules. The absorption spectra of 1 and 2 in the absence and presence of ct DNA are depicted in Figs. 2a, b. In the absence of ct DNA, the UV/Vis absorption spectra of 1 has a strong π–π* transitions band at λmax=226 nm and a strong n–π* transitions band at λmax=357 nm, while 2 has a strong π–π* transitions band at λmax=247 nm, a middle π–π* transition at λmax=302 nm and a weak n–π* transitions band at λmax=354 nm. With increasing DNA concentration, the absorption bands of the two compounds show decrease in molar absorptivity (hypochromism) as well as slight bathochromism. These variations are strongly indicative of the intercalation mode of the compounds with ct DNA, involving a strong π-stacking interaction between the compounds and DNA base pairs.19,20)

In order to study the binding ability of the compounds with DNA quantitatively, the binding constant Kb was determined using the equation21):
 | (1) |
where [DNA] is the concentration of DNA in base pairs, εa, εf, and εb are the apparent extinction coefficient corresponding to Aobsd/[M], the extinction coefficient for the free compound and the extinction coefficient for the compound in the fully bound form, respectively. In plots of [DNA]/(εa−εf) versus [DNA], Kb is given by the ratio of slope to the intercept (Figs. 2a, b, inset). The binding constants Kb for 1 and 2 were found to be 1.5×10⁴ m−1 and 2.8×10⁴ m−1, respectively. The Kb values reveal that 2 exhibits greater propensity towards DNA, thereby shows stronger binding affinity.
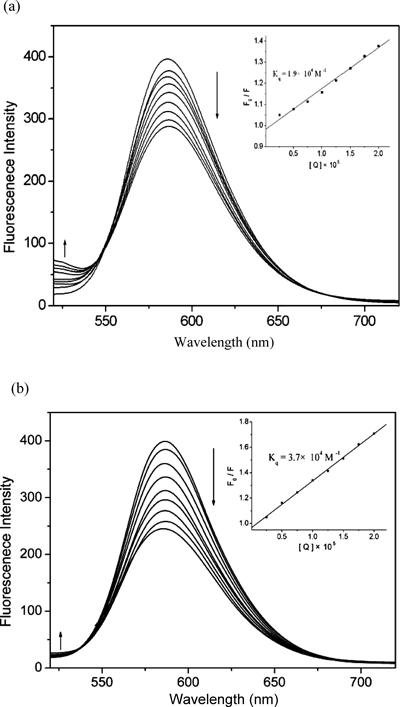
Fluorescence SpectraSteady-state competitive binding experiments using the compounds 1 and 2 as quenchers were undertaken to get further proof for the binding of the compounds to DNA via intercalation. EB is a planar cationic dye which is widely used as a sensitive fluorescence probe for native DNA. It emits intense fluorescent light in the presence of DNA due to its strong intercalation between the adjacent DNA basepairs.22,23) The displacement technique is based on the decrease of fluorescence resulting from the displacement of EB from a DNA sequence by a quencher and the quenching is due to the reduction of the number of binding sites on the DNA that is available to the EB.24) The fluorescence quenching spectra of DNA-EB system in the presence of increasing amounts of 1 and 2 are shown in Figs. 3a and b, respectively. The emission intensity of DNA-EB system at 587 nm decreases as the concentration of xanthones increased and an isosbestic point appears around 530–545 nm for the xanthones. This indicates that xanthone derivatives could displace EB from the DNA-EB system and induce the translocation of EB from a hydrophobic environment to an aqueous environment.25) Such a characteristic change is often observed in intercalative DNA interactions.26)
According to the classical Stern–Volmer equation27):
 | (2) |
where F0 and F represent the emission intensity in the absence and presence of quencher, respectively, Kq is a linear Stern–Volmer quenching constant and [Q] is the quencher concentration. The quenching plots illustrate that the quenching of EB bound to DNA by the compounds is in good agreement with (R=0.99) the linear Stern–Volmer equation (Figs. 3a, b, inset). In the plots of F0/F versus [Q], Kq is given by the ratio of the slope to the intercept. The Kq value for 1 is 1.9×10⁴ m−1 while the Kq value for 2 is 3.7×10⁴ m−1, which shows that 2 is more stable than 1 in replacing the strong DNA intercalators EB. This consists with the higher value of Kb spectrophotometrically determined. This result is in accordance with DNA intercalation mechanism for both xanthones, being 2 characterized by higher affinity toward DNA, compared with 1.
CD SpectroscopyThe circular dichroism pattern observed for ct DNA provides further and definitive confirmation of the probable mode of ct DNA binding of compounds. The CD spectrum of ct DNA consists of a positive band at 275 nm that can be due to base stacking and a negative band at 245 nm that can be due to helicity and it is also characteristic of DNA in a right-handed B form.28) The changes in CD signals of DNA observed on interaction with small molecules may often be assigned to the corresponding changes in DNA structure.29) Thus simple groove binding and electrostatic interaction of small molecules show less or no perturbation on the base-stacking and helicity bands, whereas intercalation enhances the intensities of both the bands stabilizing the right-handed B conformation of ct DNA as observed for the classical intercalators methylene blue.30)
The CD spectrum of ct DNA was monitored in the presence of 1 and 2. The changes observed in the two cases are shown in Fig. 4. On addition of 1 to ct DNA, it shows slight red shift with intensity increase and decrease in the positive and negative bands respectively. When addition of 2 to ct DNA, it is observed that the positive band position shifted to 282 nm from 275 nm with more evident increase than 1 in molar ellipticity, while the intensity of the negative band in the CD spectrum of DNA was perturbed with a red shift of 3 nm. This reveals the effect of strong intercalation of the compounds on base stacking and decreased right-handedness of B-DNA. Furthermore, the large decrease in intensity of the DNA helicity band indicates that the DNA is unwound upon interaction with the compounds and then transformed into other conformations.31–33) The result is in agreement with the structure changes concluded from absorbance spectra changes process of DNA upon adding the two compounds.
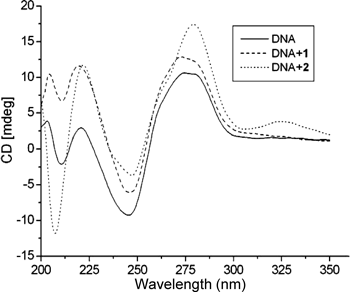
Fig. 4. CD Spectra of ct DNA (120 µm) in the Absence and Presence of 1 (40 µm) and 2 (40 µm)
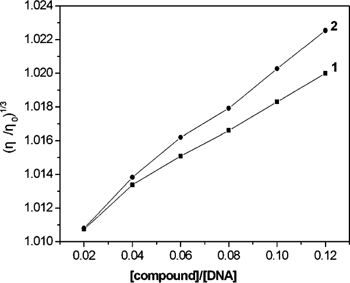
The interaction mode of small molecules with DNA is further confirmed via viscosity study. Intercalation is expected to increase the DNA viscosity. In contrast, a partial and nonclassical intercalation of the compound can reduce its effective length and, concomitantly, its viscosity by bending the DNA helix.34)
As a validation of the above verdict, viscosity measurements were carried out. The effects of the two compounds on the viscosity of DNA at 25.0±0.1°C are shown in Fig. 5. It can be observed that the viscosity of the DNA increased steadily upon increasing the amounts of 1 or 2. The increased degree of viscosity of 2 is more obvious than that of 1. Thus 2 interacts with the ct DNA more strongly and deeply than 1. The results agree with the results obtained from the spectroscopic studies. It demonstrates that the xanthones can intercalate between adjacent DNA base pairs, causing an extension in the helix. On the basis of all the spectroscopic studies together with the viscosity measurements, it is suggested that the two xanthones could bind to ct DNA in classical intercalation mode.
Cytotoxic ActivitiesThe two compounds were evaluated for their cytotoxic activity in vitro against HeLa and HepG2. The cell lines were incubated for 48 h and 72 h with varying concentrations of the xanthones. The cell viability was determined by acid phosphatase assay. The assay is based on the hydrolysis of the p-nitrophenyl phosphate by intracellular acid phosphatases in viable cells to produce p-nitrophenol. For the cell lines examined, absorbance of p-nitrophenol at 405 nm is directly proportional to the cell number in the range of 103–105 cells.
The cell viability decreased in response to 1 and 2 in a dose-dependent manner as illustrated in Fig. 6 and Table 1. The two compounds exhibited potent cytotoxic activity against the cell lines after 48 h and 72 h treatment. The xanthone 2 involved piperidinyl had more potent activity than 1 against HeLa and HepG2. It may because the compounds intercalate into the base group pairs of DNA, which induce damage to DNA in the cancer cells, inhibit the division of cancer cells and result in cell death.35) Combining with the DNA-binding experiment, it is possible that the piperidinylethoxy groups could influence the electron cloud density change of xanthone ring to some extent. And the concentrated negative charge centers would cause the molecular shows a stronger polarity. The molecular polarity changes relate to DNA binding affinity. The flexible chain with active group linked at rigid xanthone plane may enhance the DNA binding affinity and facilitate the DNA selective binding,23) which imply that the substituent flexible side chains in xanthone derivatives might contribute to the increase of their anticancer activity. The complicated mechanisms about the effect of the compounds on the tumor cells are currently under the way.
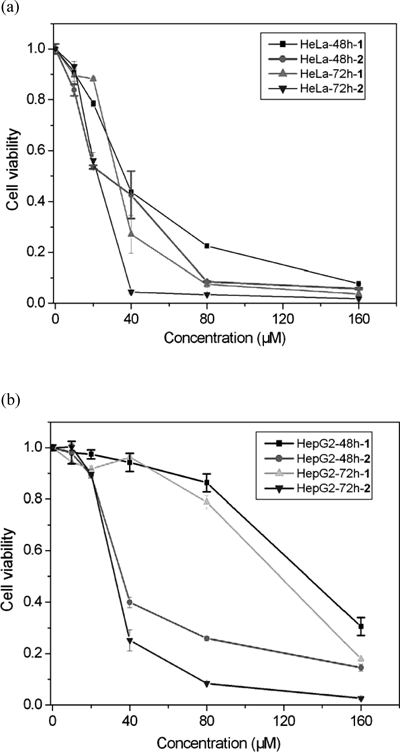
Table 1. Antiproliferative Effects (IC
50) of
1 and
2 on HeLa Cells and HepG2 Cells
| Compounds | HeLa cells (µm) | HepG2 cells (µm) |
|---|
| 48 h | 72 h | 48 h | 72 h |
|---|
| 1 | 37 | 33 | 131 | 119 |
| 2 | 28 | 22.5 | 36 | 32.5 |
Conclusion
The binding mode and affinity between DNA and the two xanthones have been investigated by spectrophotometric methods and viscosity measurements. The results suggest that the two xanthones can intercalate into the base group pairs of DNA because of the good planarity of the xanthone ring. They both have strong binding affinity with DNA. Comparing the binding extents of them, it is concluded that binding affinity of 2 involved piperidinyl is stronger than 1. Moreover, the result of acid phosphatase assay suggested that they had potent cytotoxic activity against tumor cell lines HeLa and HepG2. Analyses show that the piperidinylethoxy substituted xanthone exhibit more effective cytotoxic activity against the two cancer cells than isoeuxanthone. The effects on the inhibition of tumor cells in vitro are consistent with the studies of DNA-binding. We conclude that the xanthones intercalate between DNA base pairs and cause DNA damage in cancer cells, thus inhibit the division of cancer cells. Information obtained from the present work may provides evidence for the nature of the binding of the xanthones to DNA and is expected to offer further impetus for designing newer probes for DNA structure and novel therapeutic agents that are directed at DNA.
Acknowledgment
We are grateful for the financial support of the National Science Foundation of Shanxi Province (No. 2012021008-4 and No. 2011011022-2) and the Key Laboratory Open Foundation of Shanxi Province (No. 2009011059-14).
References
- 1) Lin C. N., Liou S. S., Ko F. N., Teng C. M., J. Pharm. Sci., 82, 11–16 (1993).
- 2) Peres V., Nagem T. J., Oliveira F. F. D., Phytochem., 55, 683–710 (2000).
- 3) Jung H. A., Su B. N., Keller W. J., Mehta R. G., Kinghorn A. D., J. Agric. Food Chem., 54, 2077–2082 (2006).
- 4) Lee B. W., Lee J. H., Lee S. T., Lee H. S., Lee W. S., Jeong T. S., Park K. H., Bioorg. Med. Chem. Lett., 15, 5548–5552 (2005).
- 5) Cheng J. H., Huang A. M., Hour T. C., Yang S. C., Pu Y. S., Lin C. N., Bioorg. Med. Chem., 45, 1222–1231 (2011).
- 6) Hansen M., Lee S. J., Cassady J. M., Hurley L. H., J. Am. Chem. Soc., 118, 5553–5561 (1996).
- 7) Pedro M., Cerqueira F., Sousa M. E., Nascimento M. S. J., Pinto M., Bioorg. Med. Chem., 10, 3725–3730 (2002).
- 8) Woo S., Jung J., Lee C., Kwon Y., Na Y., Bioorg. Med. Chem. Lett., 17, 1163–1166 (2007).
- 9) Yoshimi N., Matsunaga K., Katayama M., Yamada Y., Kuno T., Qiao Z., Hara A., Yamahara J., Mori H., Naoki Y., Cancer Lett., 163, 163–170 (2001).
- 10) Sittisombut C., Boutefnouchet S., Trinh Van-Dufat H., Tian W., Michel S., Koch M., Tillequin F., Pfeiffer B., Pierré A., Chem. Pharm. Bull., 54, 1113–1118 (2006).
- 11) Heald R. A., Dexheimer T. S., Vankayalapati H., Siddiqui-Jain A., Szabo L. Z., Gleason-Guzman M. C., Hurley L. H., J. Med. Chem., 48, 2993–3004 (2005).
- 12) Woo S., Kang D. H., Nam J. M., Lee C. S., Ha E. M., Lee E. S., Kwon Y., Na Y., Eur. J. Med. Chem., 45, 4221–4228 (2010).
- 13) Lin C. N., Liou S. J., Lee T. H., Chuang Y. C., Won S. J., J. Pharm. Pharmacol., 48, 539–544 (1996).
- 14) Liu Y., Zou L., Ma L., Chen W. H., Wang B., Xu Z. L., Bioorg. Med. Chem., 14, 5683–5690 (2006).
- 15) Huang C. Z., Li Y. F., Feng P., Talanta, 55, 321–328 (2001).
- 16) Kumar C. V., Asuncion E. H., J. Am. Chem. Soc., 115, 8547–8553 (1993).
- 17) Eriksson M., Leijon M., Hiort C., Nordén B., Gräslund A., Biochemistry, 33, 5031–5040 (1994).
- 18) Hao Z. Y., Liu Q. W., Xu J., Jia L., Li S. B., Chem. Pharm. Bull., 58, 1306–1312 (2010).
- 19) Kelly J. M., Murphy M. J., McConnell D. J., OhUigin C., Nucleic Acids Res., 13, 167–184 (1985).
- 20) Bloomfield V. A., Crothers D. M., Tinico I. J. I., “Physical Chemistry of Nucleic Acids,” Harper and Row, New York, 1974, pp. 429–476.
- 21) Sartaj T., Rais A. K., Farukh A., Subrata S., Jyoti K., Aarti S. J., Surekha M. Z., J. Organomet. Chem., 696, 1600–1608 (2011).
- 22) Boger D. L., Fink B. E., Brunette S. R., Tse W. C., Hedrick M. P., J. Am. Chem. Soc., 123, 5878–5891 (2001).
- 23) Shen R., Wang P., Tang N., J. Fluoresc., 20, 1287–1297 (2010).
- 24) Lippard S. J., Acc. Chem. Res., 11, 211–217 (1978).
- 25) Zeng Y. B., Yang N., Liu W. S., Tang N., J. Inorg. Biochem., 97, 258–264 (2003).
- 26) Kumar C. V., Barton J. K., Turro N. J., J. Am. Chem. Soc., 107, 5518–5523 (1985).
- 27) Eftink MR, Ghiron C. A., Anal. Biochem., 114, 199–227 (1981).
- 28) Pankaj K., Basudeb B., Sumit K. C., Rizwan H. K., Debasis M., Biplab M., Inorg. Chim. Acta, 376, 264–270 (2011).
- 29) Lincoln P., Tuite E., Norden B., J. Am. Chem. Soc., 119, 1454–1455 (1997).
- 30) Nordén B., Tjerneld F., Biopolymers, 21, 1713–1734 (1982).
- 31) Vaidyanathan V. G., Vijayalakshmi R., Subramanain V., Nair B. U., Bull. Chem. Soc. Jpn., 75, 1143–1149 (2002).
- 32) Chauhan M., Arjmand F., Chem. Biodivers., 3, 660–676 (2006).
- 33) Uma MP, Palaniandavar M., J. Inorg. Biochem., 98, 219–230 (2004).
- 34) Zou X. H., Ye B. H., Li H., Liu J. G., Xiong Y., Ji L. N., J. Chem. Soc., Dalton Trans., 1999, 1423–1428 (1999).
- 35) Zuber G. J., Quada J. C., Hecht S. M., J. Am. Chem. Soc., 120, 9368–9369 (1998).