Results and Discussion
Synthesis of CempBr and Complexes 1–5The synthetic route of CempBr and complexes 1–5 is shown in Chart 2. Thus, reaction of 1,10-phenanthroline with ethyl bromoacetate in acetone afforded CempBr in 76% yield. Treatment of CempBr with 1/2 eq of metal salts MCl2 gave complexes 1–5 in 47–86% yields, with the same formula of [Cemp]2[MCl4].
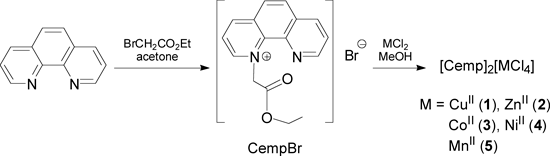
Chart 2. Synthesis of CempBr and Complexes 1–5
CempBr and complex 1 were characterized by 1H-NMR, electrospray ionization (ESI)-MS, elemental analyses, IR, UV-Vis, and single-crystal X-ray crystallography, while the structures of complexes 2–5 were confirmed by elemental analyses, IR, UV-Vis, and single-crystal X-ray crystallography. The elemental analyses of CempBr and complexes 1–5 were consistent with their chemical formula, and the 1H-NMR spectra of CempBr and complex 1 were also in full agreement with the given structures. In the IR spectra of CempBr and complexes 1–5, the strong bands at 1745 cm−1 are assigned to ester ν(C=O) and the medium bands around 1200 cm−1 are characterized for ν(O–C–O) vibrations. In addition, the electronic spectra of CempBr and complexes 1–5 exhibit strong absorption bands around 276 nm in 5 mM Tris–HCl buffer (5 mM NaCl, pH 7.0) that are assigned to π→π* intra-ligand charge transfer transition31) (Fig. S1). These spectral features suggest that there are no interactions between the oxygen or nitrogen donor atoms in [Cemp]+ and the metal center in [MCl4]2−, and thus complexes 1–5 are all ionic metal complexes.
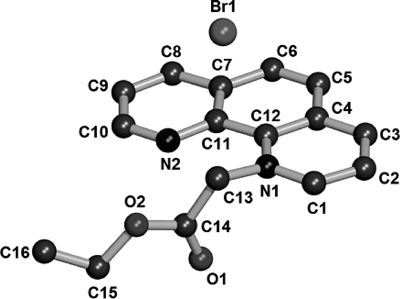
Crystal Structures of CempBr and Complexes 1–5CempBr crystallizes in the triclinic space group P1̄ and each asymmetric unit consists of one [Cemp]+ cation and one Br− anion. The perspective view structure of CempBr is shown in Fig. 1. The [Cemp]+ cations in the crystals of CempBr are parallel to each other along a axis. The associated Br− anions are surrounded by the paralleled cations through unclassical C–H···Br hydrogen bonding interactions as shown in Fig. 2.

Fig. 2. Cell Packing Diagram of CempBr, Viewed Down along the a Axis
Complexes 1–5 all crystallize in the triclinic space group P1̄ and each asymmetric unit consists of two [Cemp]+ cations and one [MCl4]2− dianion. In the solid state, the isolated cations co-exist with anions, however, without any obvious interactions between the oxygen or nitrogen donor atoms in [Cemp]+ cations and the metal ions in [MCl4]2− dianions. Because the molecular structures of complexes 1–5 are similar, only the perspective view of the molecular structure of complex 1 is depicted in Fig. 3. The molecular structures of complexes 2–5 are shown in Figs. S2–5. The geometry of the tetrachlorometal ion deviates somewhat from a theoretical tetrahedron, with bond angles in the range of 98.38(17)–131.19(17)° for complex 1, 102.97(12)–114.56(11)° for complex 2, 102.72(12)–116.16(12)° for complex 3, 103.09(15)–115.32(14)° for complex 4 and 101.28(10)–118.91(11)° for complex 5, respectively. The conformations of the [Cemp]+ ions are virtually identical. In complexes 1–5, the [Cemp]+ cations are parallel to each other along a axis and b axis as shown in Fig. 4. The dihedral angles of phenanthroline in these two directions are 99.5° for complex 1, 97.6° for complex 2, 93.8° for complex 3, 97.4° for complex 4 and 94.5° for complex 5, respectively.
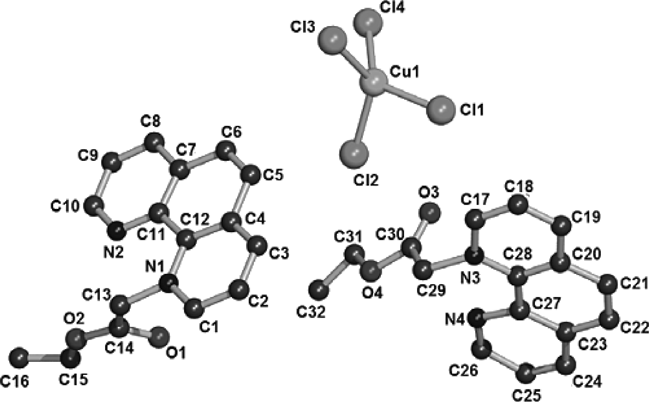
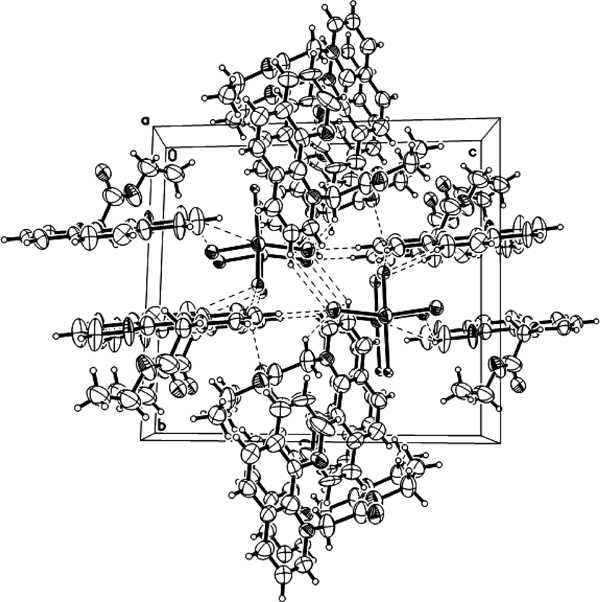
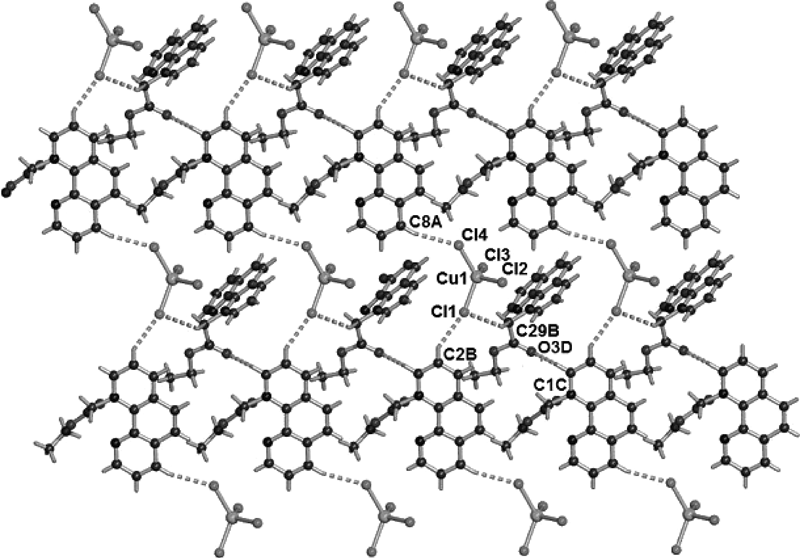
Fig. 4. Cell Packing Diagram of Complex 1, Viewed Down along the a Axis
It is noteworthy that complexes 1–5 are involved in some non-conventional C–H···Cl or C–H···O hydrogen bonding interactions. In complex 1, there are four hydrogen bonding interactions between Cl1 and C2-H of the phenyl group [2−x, 1−y, 1−z], Cl1 and C29-H of the methylene group [2−x, 1−y, 1−z], Cl4 and C8-H of the phenyl group [2−x, 1−y, −z], and O3 (2−x, 1−y, 1−z) and C1-H of the phenyl group [3−x, 1−y, 1−z]. These intermolecular hydrogen bonds lead to the formation of a two-dimensional network along the ac plane for complex 1 (Fig. 5). The C–H···Cl or C–H···O hydrogen bonding interactions make two-dimensional network structures for complexes 3 (Fig. S7) and 4 (Fig. S8), and one dimensional chain structures for complexes 2 (Fig. S6) and 5 (Fig. S9).
DNA Binding StudiesIt is reported that some ionic metal complexes, such as [LH][AuCl4] (L=liriodenine) showed DNA binding abilities.20) Therefore, we measured the binding affinities toward calf-thymus (CT) DNA of CempBr and complexes 1–5 by means of ethidium bromide (EB) displacement experiment tentatively. EB is a planar cationic dye which is widely used as a sensitive fluorescent probe for native DNA. EB emits intense fluorescent light in the presence of DNA due to its strong intercalation between the adjacent DNA base pairs. Competitive binding of other drugs to DNA leads to the displacement of bound EB and a decrease in the fluorescence intensity.32) Under the measuring conditions, CempBr and complexes 1–5 induced decreases in the fluorescence intensity (FI) of EB (Fig. 6 and Figs. S10–S21), indicating that they were capable of substituting EB bound to CT DNA. Their binding constants were obtained by analyzing the relationship between the relative fluorescence intensity and the concentrations of each complex (Table 2). It is clear that the binding affinity of CempBr was enhanced in the presence of the metal ions, and that the increments were quite different. Among them, complex 1 had the highest affinity with the binding constant being (1.58±1.12)×106 M−1, 20–100-fold higher than those of complexes 2–5 and CempBr.

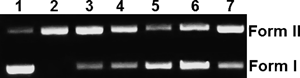
As complexes 1–5 had high binding affinities toward CT DNA and it is widely recognized that DNA binding is a critical step for DNA cleavage in most cases,33) we investigated the cleaving activities of complexes 1–5 toward pBR322 DNA. Figure 7 shows the agarose gel electrophoresis (GE) patterns for the cleavage of pBR322 DNA by complexes 1–5 at pH 7.0 and 37°C. It can be seen that conversion of the supercoiled DNA (CCC) form (Form I) into the open circular (OC) form (Form II) are apparent. The DNA-cleaving efficiency decreases in the order of complex 1 (Lane 2)≫2 (Lane 3)>3 (Lane 4)≈4 (Lane 5)≈5 (Lane 6), which was further evidenced from their apparent initial first-order rate constants (kobs’s) at the concentration of 100 µM (Table 2). Because complex 1 has a similar structure with complexes 2–5, we assume that the difference in the DNA cleaving activities is a likely consequence of the higher ability of the copper centers to bind to O2 and form reactive oxygen species (ROS), which can further activate the cleavage of supercoiled DNA to form nicked DNA.34,35)
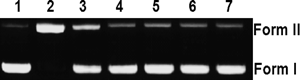
Table 1. Crystallographic Data for CempBr and Complexes
1–
5| Complex | CempBr | 1 | 2 |
|---|
| Molecular formula | C16H15N2O2Br | C32H30Cl4N4O4Cu | C32H30Cl4N4O4Zn |
| Formula weight | 347.20 | 739.94 | 741.77 |
| Crystal system | Triclinic | Triclinic | Triclinic |
| Space group | P1̄ | P1̄ | P1̄ |
| Size | 0.30×0.25×0.1 | 0.38×0.32×0.28 | 0.42×0.38×0.36 |
| a (Å) | 7.3804(15) | 9.1067(18) | 9.3688(19) |
| b (Å) | 10.379(2) | 13.644(3) | 13.474(3) |
| c (Å) | 10.614(2) | 15.002(3) | 15.104(3) |
| α (°) | 87.15(3) | 88.27(3) | 88.41(3) |
| β (°) | 80.45(3) | 76.44(3) | 76.48(3) |
| γ (°) | 72.34(3) | 77.63(3) | 76.64(3) |
| V (Å3) | 764.0(3) | 1769.6(6) | 1803.0(6) |
| Z | 2 | 2 | 2 |
| T/K | 293(2) | 291(2) | 291(2) |
| Dcalc (g cm−3) | 1.509 | 1.389 | 1.366 |
| λ (MoKα) (Å) | 0.71070 | 0.71070 | 0.71070 |
| μ (cm−1) | 26.96 | 9.59 | 10.17 |
| 2θmax (°) | 55.0 | 55.0 | 55.0 |
| Total reflections | 7942 | 14592 | 18621 |
| Unique reflections | 3485 (Rint=0.0474) | 6199 (Rint=0.1465) | 8249 (Rint=0.1211) |
| No. observations | 2862 (I>2.00σ(I)) | 2540 (I>2.00σ(I)) | 3413 (I>2.00σ(I)) |
| No. parameters | 191 | 370 | 403 |
| Ra) | 0.0507 | 0.0966 | 0.0994 |
| wRb) | 0.1114 | 0.1856 | 0.1527 |
| GOFc) | 0.984 | 1.018 | 1.056 |
| Δρmax (e Å−3) | 0.353 | 1.826 | 2.834 |
| Δρmin (e Å−3) | −0.624 | −0.934 | −1.135 |
| Complex | 3 | 4 | 5 |
|---|
| Molecular formula | C32H30Cl4N4O4Co | C32H30Cl4N4O4Ni | C32H30Cl4N4O4Mn |
| Formula weight | 735.33 | 735.11 | 731.34 |
| Crystal system | Triclinic | Triclinic | Triclinic |
| Space group | P1̄̄ | P1̄̄ | P1̄̄ |
| Size | 0.30×0.20×0.10 | 0.30×0.30×0.20 | 0.30×0.25×0.2 |
| a (Å) | 9.3664(19) | 9.2370(18) | 9.3786(19) |
| b (Å) | 13.526(3) | 13.436(3) | 13.535(3) |
| c (Å) | 15.184(3) | 15.013(3) | 15.227(3) |
| α (°) | 89.45(3) | 87.96(3) | 88.98(3) |
| β (°) | 76.42(3) | 76.56(3) | 76.47(3) |
| γ (°) | 77.78(3) | 76.87(3) | 77.79(3) |
| V (Å3) | 1825.9(6) | 1764.6(6) | 1835.8(6) |
| Z | 2 | 2 | 2 |
| T/K | 293(2) | 293(2) | 293(2) |
| Dcalc (g cm−3) | 1.337 | 1.384 | 1.323 |
| λ (MoKα) (Å) | 0.71070 | 0.71070 | 0.71070 |
| μ (cm−1) | 8.01 | 8.93 | 6.89 |
| 2θmax (°) | 55.0 | 55.0 | 55.0 |
| Total reflections | 18005 | 17184 | 17473 |
| Unique reflections | 8254 (Rint=0.1698) | 7944 (Rint=0.1485) | 8207 (Rint=0.1473) |
| No. observations | 2984 (I>2.00σ(I)) | 2777 (I>2.00σ(I)) | 2990 (I>2.00σ(I)) |
| No. parameters | 399 | 393 | 408 |
| Ra) | 0.0862 | 0.1090 | 0.0847 |
| wRb) | 0.1878 | 0.1856 | 0.1784 |
| GOFc) | 1.187 | 0.976 | 1.118 |
| Δρmax (e Å−3) | 2.124 | 0.583 | 1.460 |
| Δρmin (e Å−3) | −1.064 | −0.491 | −1.111 |
a) R=Σ||Fo|−|Fc|/Σ|Fo|. b) wR={Σw(Fo2−Fc2)2/Σw(Fo2)2}1/2. c) GOF={Σ[w((Fo2−Fc2)2)/(n−p)}1/2, where n=number of reflections and p=total numbers of parameters refined.
Table 2.
Pseudo-First-Order Rate Constants (
kobs, h
−1) of pBR322 DNA Degradation of CempBr and Complexes
1–
5, and Their Binding Constants (
Ka’s,
M−1) with CT DNA
| Complex | Form I (%) | Form II (%) | kobsa) | Kab) |
|---|
| None | 94.6 | 6.4 | — | — |
| CempBr | 89.3 | 10.7 | 0.008±0.001 | (1.21±0.43)×104 |
| 1 | 2.0 | 98.0 | 0.367±0.018 | (1.58±1.12)×106 |
| 2 | 73.4 | 26.6 | 0.048±0.002 | (7.88±1.12)×104 |
| 3 | 87.1 | 12.9 | 0.014±0.001 | (1.75±0.42)×104 |
| 4 | 88.2 | 11.8 | 0.010±0.001 | (5.28±1.26)×104 |
| 5 | 87.3 | 12.7 | 0.012±0.001 | (1.58±1.18)×104 |
a) Measured at the concentration of 100 µM for each complex, in 5 mM Tris–HCl (5 mM NaCl, pH 7.0) at 37°C. b) Measured by means of EB displacement experiments, in 5 mM Tris–HCl (5 mM NaCl, pH 7.0) at room temperature.
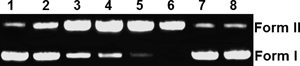
Detailed examination of the cleaving activity of complex 1 was then carried out, firstly by varying the concentrations of complex 1 (Fig. 8). It can be seen that the cleaving activity increased with the concentrations of complex 1 (Lanes 2–6). When the concentration of complex 1 was 50 µM, almost all the CCC form was converted into the OC form. It should be noted that neither CempBr (Lane 7) nor CuCl2 (Lane 8) showed any obvious cleaving activity.
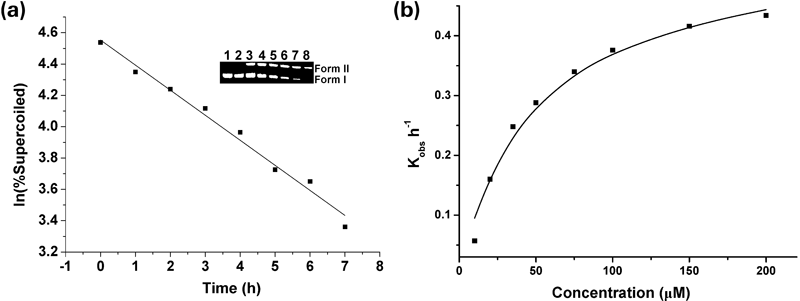
Secondly, to gain insight into the cleaving activity of complex 1, the kinetics of pBR322 DNA degradation was studied (Fig. 9 and Figs. S22–34).36–38) Figure 9a shows that the extent of supercoiled DNA cleavage by complex 1 (20 µM) varied exponentially with the reaction time, giving pseudo first-order kinetics with a kobs value of 0.16±0.08 h−1. The saturation kinetics profile (Fig. 9b) gave the maximal first-order rate constant kmax of (0.55±0.028) h−1 and Michaelis constant KM of (47.6±6.6) µM, respectively. Thus, complex 1 can catalyze the cleavage with a rate acceleration of about 1.5×10⁷-fold over uncatalyzed supercoiled DNA cleavage (k=3.6×10⁻⁸ h−1, 37°C).39,40)
Thirdly, to gain further insight into the cleaving activity of complex 1, its mechanism of action toward the cleavage of pBR322 DNA was investigated. It is known that nucleic acid can be cleaved through either an oxidative or hydrolytic pathway. In general, oxidative cleavage of plasmid DNA may lead to the formation of reactive singlet oxygen (1O2), hydrogen peroxide (H2O2) and/or hydroxyl radical (HO·) species. These species contain a photo or redox active center, which causes damage to the sugar and/or base.7,8) Therefore, to distinguish the probable mechanism of action of complex 1, we conducted the cleavage reactions in the presence of hydroxyl radical scavengers dimethyl sulfoxide (DMSO) and MeOH, singlet oxygen scavenger NaN3, hydrogen peroxide scavenger KI and metal ion-chelating agent ethylenediamine tetraacetic acid (EDTA)41) (Fig. 10). As a result, EDTA (Lane 6) efficiently inhibited the DNA cleavage, indicating that complex 1 was obligatory in the DNA cleavage reaction. DMSO (Lane 3) and MeOH (Lane 4) were found to diminish the activity, which suggests the involvement of OH· radicals in the cleavage process. In the presence of NaN3 (Lane 7), the DNA cleavage was significantly inhibited, suggesting that singlet oxygen was likely to be the reactive species responsible for the activity.42) Similarly, in the presence of KI (Lane 5), the cleavage was repressed, suggesting that H2O2 might be the reactive species in the cleavage process. Taken together, these results strongly suggest that the DNA cleavage by complex 1 proceeded, most probably via an oxidative mechanism.43)
Experimental
General1H-NMR spectra were recorded in CD3OD using a Varian Mercury 400 spectrometer and tetramethylsilane (TMS) as an internal reference. ESI-MS spectra were measured on Waters UPLC/Quattro Premier XE. IR spectra were recorded on a Nicolet MagNa-IR 550. Elemental analyses for C, H, and N were performed on an EA1110 CHNS elemental analyzer. Agarose GE was conducted on DYY-8C electrophoresis apparatus and DYCP-31DN electrophoresis chamber, and detected on Alpha Hp 3400 fluorescence and visible light digital image analyzer. UV-Vis and fluorescence spectra were measured on a TU-1901 spectrophotometer and a HITACHI F-2500 spectrofluorimeter, respectively.
CT DNA and plasmid pBR322 DNA were obtained from Sigma-Aldrich and TaKaRa Chemical Co., respectively. Their solutions were prepared in 5 mM Tris–HCl buffer (5 mM NaCl, pH 7.0). The concentration of CT DNA was determined spectrophotometrically using the molar extinction coefficient of 13200 M−1 cm−1 per base pair (bp) at 260 nm.44) All the other chemicals and reagents were obtained from commercial sources and used without further purification. Buffer solutions were prepared in triply distilled deionized water.
Synthesis of CempBrTo a solution of 1,10-phenanthroline (2.0 g, 10 mmol) in acetone (40 mL) was added drop wise ethyl bromoacetate (8 mL) at room temperature. After stirring for 20 h, the formed light yellow precipitates were collected by filtration and washed with acetone (5 mL) and ether (5 mL) to afford the crude product. The crude product was dissolved in methanol (10 mL), and diethyl ether (20 mL) was allowed to diffuse into the methanol solution. After standing at ambient temperature for two days, the formed yellow prism crystals were collected by filtration, washed with Et2O and dried in vacuo to give CempBr (3.65 g, 76%). 1H-NMR (400 MHz, CD3OD) δ: 9.53 (dd, J=5.6, 0.8 Hz, H3, 1H), 9.45 (dd, J=8.4, 1.2 Hz, H1, 1H), 9.19 (dd, J=4.4, 1.6 Hz, H10, 1H), 8.71 (dd, J=8.4, 1.6 Hz, H8, 1H), 8.43 (q, H2, 1H), 8.37 (d, J=9.2 Hz, H5, 1H), 8.33 (d, J=8.8 Hz, H6, 1H), 7.99 (q, H9, 1H), 6.54 (s, H13, 2H), 4.32 (q, H15, 2H), 1.31 (t, J=7.2 Hz, H16, 3H). 13C-NMR (100 MHz, CD3OD) δ: 168.3 (C14), 153.1 (C3), 150.7 (C1), 149.8 (C11), 141.1 (C12), 139.1 (C10), 138.9 (C8), 134.0 (C4), 133.7 (C7), 132.3 (C2), 128.0 (C5), 126.9 (C7), 125.6 (C9), 66.8 (C11), 63.5 (C13), 14.6 (C14). ESI-MS m/z: 267.1 ([M−Br]+). Anal. Calcd for C16H15BrN2O2: C 55.35, H 4.35, N 8.07; Found: C 55.48, H 4.39, N 8.12. IR (KBr disc, cm−1) ν 2984 (m), 2861 (w), 1745 (s), 1635 (w), 1582 (w), 1525 (m), 1469 (w), 1433 (w), 1360 (m), 1200 (s), 1158 (m), 1028 (m), 859 (m), 737 (m). UV-Vis (5 mM Tris–HCl buffer (5 mM NaCl, pH 7.0), λmax (nm, ε M−1 cm−1)): 276 (34500).
Synthesis of Complexes 1–5. General ProceduresTo a solution of MCl2 in MeOH was added a solution of CempBr in MeOH. The resulting mixture was stirred vigorously at room temperature for 3 h and filtered to give a clear solution. Diethyl ether was allowed to diffuse into the filtrate. After standing at ambient temperature for two days, the formed blocks of [Cemp]2[MCl4] were collected by filtration, washed with Et2O and dried in vacuo.
[Cemp]2[CuCl4] (1): Reddish-brown, 127 mg (86% based on Cu) from CuCl2·2H2O (68 mg, 0.4 mmol) and CempBr (277 mg, 0.8 mmol). 1H-NMR (400 MHz, CD3OD) δ: 9.45 (s, H3, 1H), 9.45 (d, J=4.0 Hz, H1, 1H), 9.19 (dd, J=4.0, 1.2 Hz, H10, 1H), 8.72 (dd, J=8.4, 1.2 Hz, H8, 1H), 8.42–8.34 (m, H2, H5, H6, 3H), 8.00 (m, H9, 1H), 6.52 (s, H13, 2H), 4.32 (m, H15, 2H), 1.31 (t, J=7.2 Hz, H16, 3H). Anal. Calcd for C32H30Cl4CuN4O4: C, 51.94; H, 4.09; N, 7.57; Found: C, 51.52; H, 4.51; N, 7.81. IR (KBr disc, cm−1) ν 3438 (sb), 3048 (m), 2976 (m), 1745 (s), 1626 (w), 1585 (w), 1527 (m), 1464 (w), 1409 (m), 1350 (m), 1229 (m), 1208 (s), 1024 (m), 851 (s), 743 (m), 716 (m). UV-Vis (5 mM Tris–HCl buffer (5 mM NaCl, pH 7.0), λmax (nm, ε M−1cm−1)): 276 (73100).
[Cemp]2[ZnCl4] (2): Yellow, 101 mg (68% based on Zn) from ZnCl2 (54 mg, 0.4 mmol) and CempBr (276 mg, 0.8 mmol). Anal. Calcd for C32H30Cl4ZnN4O4: C, 51.81; H, 4.08; N, 7.55; Found: C, 51.41; H, 4.25; N, 7.67. IR (KBr disc, cm−1) ν 3431 (sb), 3050 (m), 2983 (m), 1745 (s), 1625 (w), 1585 (w), 1525 (m), 1463 (w), 1407 (m), 1348 (m), 1255 (m), 1209 (s), 1161 (m), 1021 (s), 852 (s), 744 (w), 718 (m). UV-Vis (5 mM Tris–HCl buffer (5 mM NaCl, pH 7.0), λmax (nm, ε M−1cm−1)): 276 (66300).
[Cemp]2[CoCl4] (3): Green, 94 mg (64% based on Co) from CoCl2·6H2O (95 mg, 0.4 mmol) and CempBr (276 mg, 0.8 mmol). Anal. Calcd for C32H30Cl4CoN4O4: C, 52.26; H, 4.11; N, 7.62; Found: C, 52.45; H, 4.33; N, 7.85. IR (KBr disc, cm−1) ν 3055 (w), 2989 (w), 1745 (s), 1625 (w), 1584 (w), 1528 (m), 1464 (w), 1409 (s), 1361 (w), 1255 (w), 1206 (m), 1162 (w), 1022 (w), 854 (m), 719 (w). UV-Vis (5 mM Tris–HCl buffer (5 mM NaCl, pH 7.0), λmax (nm, ε M−1cm−1)): 276 (69700).
[Cemp]2[NiCl4] (4): Yellow, 69 mg (47% based on Ni) from NiCl2·6H2O (95 mg, 0.4 mmol) and CempBr (277 mg, 0.8 mmol). Anal. Calcd for C32H30Cl4NiN4O4: C, 52.28; H, 4.11; N, 7.62; Found: C, 52.43; H, 4.35; N, 7.81. IR (KBr disc, cm−1) ν 2985 (w), 2862 (w), 1745 (s), 1627 (w), 1584 (w), 1526 (m), 1470 (w), 1431 (w), 1362 (m), 1200 (m), 1160 (w), 1028 (w), 861 (m), 731 (w). UV-Vis (5 mM Tris–HCl buffer (5 mM NaCl, pH 7.0), λmax (nm, ε M−1cm−1)): 276 (62600).
[Cemp]2[MnCl4] (5): Light yellow, 73 mg (50% based on Mn) from MnCl2 (52 mg, 0.4 mmol) and CempBr (277 mg, 0.8 mmol). Anal. Calcd for C32H30Cl4MnN4O4: C, 52.55; H, 4.13; N, 7.66; Found: C, 52.34; H, 4.25; N, 7.73. IR (KBr disc, cm−1) ν 3430 (sb), 3055 (m), 2983 (w), 1745 (s), 1627 (w), 1587 (w), 1528 (m), 1465 (w), 1350 (m), 1201 (m), 1165 (w), 1024 (w), 853 (m), 720 (w). UV-Vis (5 mM Tris–HCl buffer (5 mM NaCl, pH 7.0), λmax (nm, ε M−1cm−1)): 276 (58800).
X-Ray Structures of CempBr and Complexes 1–5All the measurements were made on a Rigaku Mercury CCD X-ray diffractometer by using graphite monochromated MoKα (λ=0.71070 Å). Crystals of CempBr and complexes 1–5 were mounted with grease at the top of a glass fiber. Cell parameters were refined by using the program CrystalClear (Rigaku and MSC, Ver. 1.3, 2001). The collected data were reduced by using the program CrystalStructure (Rigaku and MSC, Ver. 3.60, 2004) while an absorption correction (multiscan) was applied. A summary of the key crystallographic information for CempBr and complexes 1–5 was tabulated in Table 1.
DNA Binding ExperimentsEB displacement experiments’ of CempBr and complexes 1–5 were performed by keeping the concentrations of CT DNA and EB constant, while gradually increasing the concentrations of CempBr or each of the metal complexes. Thus, to a solution of CT DNA (2.40 µM) and EB (3.03 µM) in 5 mM Tris–HCl (5 mM NaCl, pH 7.0) were added aliquots of a solution of each complex containing CT DNA (2.40 µM) and EB (3.03 µM) in the same buffer. The corresponding fluorescence spectra were measured (λex=510 nm) until saturation was observed. The apparent binding constant (Ka) was obtained by analyzing the relative fluorescence intensity (I/I0) as a function of the concentrations of each complex.45)
DNA Cleavage ExperimentsThe cleavage experiments were conducted by using the methods similar to those described previously.25,36–38) Specifically, a mixture of pBR322 DNA (0.5 g/L, 0.7 µL) and each of complexes 1–5 was diluted with 5 mM Tris–HCl buffer (5 mM NaCl, pH 7.0) to 16 µL and incubated at 37°C for 5 h. The reaction was quenched by adding loading buffer containing 0.035% bromophenol blue, 36% glycerol, 30 mM EDTA and 0.05% xylene cyanol FF. The solution was then loaded on 1% agarose gel containing EB (1.0 mg/L), and analyzed with electrophoresis in Tris–acetate–EDTA (TAE) buffer (pH 8.0). Bands were visualized by UV light and photographed.
The kinetics for the DNA cleavage was investigated at 37°C for different intervals of time, by varying the concentrations of complex 1 from 0 to 200 µM in 5 mM Tris–HCl buffer (5 mM NaCl, pH 7.0).36–38) The percentage of the supercoiled DNA form was determined, and plotted against time for each concentration of complex 1. The data were fitted with a single-exponential curve (pseudo first-order kinetics) to give the kobs values. The kobs values were then plotted versus the concentrations of complex 1 (Eq. 1), allowing the determination of the corresponding maximal first-order rate constant kmax and Michaelis constant KM.
For mechanistic investigations, inhibition reactions were carried out in the presence of DMSO (1.0 M), MeOH (1.0 M), NaN3 (0.1 mM), KI (0.1 M) and EDTA (0.1 M), followed by the addition of complex 1.