Abstract
In the efforts to find an anti-viral treatment for dengue, a simple tryptophan fluorescence-screening assay aimed at identifying dengue domain III envelope (EIII) protein inhibitors was developed. Residue Trp391 of EIII was used as an intrinsic probe to monitor the change in fluorescence of the tryptophan residue upon binding to a peptide. The analysis was based on the electron excitation at 280 nm and fluorescence emission at 300–400 nm of EIII, followed by quenching of fluorescence in the presence of potential peptidic inhibitors coded DS36wt, DS36opt, DN58wt and DN58opt. The present study found that the fluorescence of the recombinant EIII was quenched following the binding of DS36opt, DN58wt and DN58opt in a concentration-dependent manner. Since the λmax for emission remained unchanged, the effect was not due to a change in the environment of the tryptophan side chain. In contrast, a minimal fluorescence-quenching effect of DS36wt at 20 and 40 µM suggested that the DS36wt does not have any binding ability to EIII. This was supported by a simple native-page gel retardation assay that showed a band shift of EIII domain when incubated with DS36opt, DN58wt and DN58opt but not with DS36wt. We thus developed a low-cost and convenient spectrophotometric binding assay for the analysis of EIII–peptide interactions in a drug screening application.
More than 2.5 million people are at risk of dengue infections in over 100 countries, with several hundred thousand cases of life threatening dengue hemorrhagic fever (DHF)/dengue shock syndrome (DSS) occurring annually.1) Currently, there is no commercially available vaccine or antiviral agent against dengue virus (DENV) infections. In the efforts towards developing an anti-viral treatment for dengue, a simple tryptophan fluorescence quenching screening assay aimed at identifying dengue EIII protein inhibitors was developed.
DENV is a positive-sense, single stranded RNA virus belonging to the Flaviviridae family. The DENV consists of four antigenically distinct serotypes (serotypes 1–4). The glycosylated envelope (E) protein is a type 1 integral membrane protein, and makes up the major structural protein present on the surface of the mature dengue virions. It plays an important role in viral infection via virus attachment to cell-surface receptors and mediates viral-cell membrane fusion. The E protein is the major target for protective antibodies against dengue.2) It has been demonstrated that the mature DENV E protein in the pre-fusion state forms homodimers in an anti-parallel manner (head to tail orientation), which transforms to its trimeric form in the post-fusion state.2) The stability and function of the DENV E protein during conformational transition from dimeric to trimeric form is controlled by the change in pH. Each monomer is folded in three distinct domains, with the central domain (domain I) bordered by the immunoglobulin-like C-terminal domain (domain III) and the dimerization N-terminal domain (domain II) that carries the fusion peptide. Experimental evidences have shown that the EIII is involved in host receptor-binding domain.3–9) For this reason, the EIII protein is believed to be a potential target for anti-dengue drugs. The EIII inhibitors may confer inhibition of the cellular entry of the DENV.
Tryptophan is an important intrinsic fluorescence probe that can be used to monitor microenvironmental changes around protein tryptophan residues.10,11) In the current study, the Trp391 present in EIII was used as an intrinsic probe to monitor the change in fluorescence of the tryptophan residue upon binding to potential EIII peptide inhibitors. The peptides used in this study were designed based on a Monte Carlo method to identify the druggable regions in EIII.12) As described by Xu et al.,12) the DS36wt and DN58wt peptides sequences were identified from the hydrophobic region in EIII, and were predicted to show promising self-inhibitory. The DS36opt and DN58opt peptides sequences were derived from DS36wt and DN58wt, respectively, and the stability of the substitutes amino acids which indicates its potential to bind in situ to E protein was evaluated with residue-specific all-atom probability discriminatory function (RAPDF) scoring function. The chosen peptides used in this study have the potential as inhibitors by disrupting the protein–protein interactions in membrane fusion mediated by the E proteins. In the current study, an in vitro drug-screening assay was developed to assess the ability of the peptides to interact with EIII, that is, the peptides were screened for their binding to EIII. The binding interactions can be directly measured by the fluorescence intensity using a microplate reader. This simple, inexpensive and convenient method for drug screening may speed up the development of novel DENV inhibitors for viral envelops proteins.
Experimental
Peptide PreparationThe synthetic peptides used in this study were DS36wt, DS36opt, DN58wt and DN58opt (Table 1), were chemically synthesized by GL Biochem Ltd. (Shanghai) and Aurigene Discovery Technologies Ltd. (India). All peptides were determined to have more than 95% purity. The solvents used for the assay were ultra pure grade dimethyl sulfoxide (DMSO) and 99.9% HPLC grade dimethylformamide (DMF). DS36wt was dissolved in DMSO, while DS36opt, DN58wt and DN58opt were dissolved in DMF. Approximately 1 mM dithiothreitol (DTT) was dissolved in 100% DMF for stock preparation of the DS36opt, DS58wt and DS58opt peptides due to the availability of Cys, Met and Trp residues. The peptides were prepared as 10 mM stock solutions.
Table 1. Potential Peptidic Inhibitors Used in This Study
| Peptides | Amino acid sequence of the peptides | Peptide length | Peptide charge |
|---|
| DS36wt Mw=2.1 kDa | Leu-Ile-Thr-Val-Asn-Pro-Ile-Val-Thr-Glu-Lys-Asp-Ser-Pro-Val-Asn-Ile-Glu-Ala-Glu | 20 | Acidic |
| DS36opt Mw=3.0 kDa | Arg-His-Trp-Glu-Gln-Phe-Tyr-Phe-Arg-Arg-Arg-Glu-Arg-Lys-Phe-Trp-Leu-Phe-Phe-Trp | 20 | Basic |
| DN58wt Mw=3.2 kDa | Gly-Asp-Ser-Tyr-Ile-Ile-Ile-Gly-Val-Glu-Pro-Gly-Gln-Leu-Lys-Glu-Asn-Trp-Phe-Lys-Lys-Gly-Ser-Ser-Ile-Gly-Ser-Ser-Ile-Gly-Gln-Met-Phe | 33 | Neutral |
| DN58opt Mw=3.0 kDa | Thr-Trp-Trp-Cys-Phe-Tyr-Phe-Cys-Arg-Arg-His-His-Pro-Phe-Trp-Phe-Phe-Tyr-Arg-His-Asn | 21 | Basic |
| (Negative control) Insulin chain A oxidized ammonium salt (Sigma-Aldrich) Mw=2.5 kDa | Gly-Ile-Val-Glu-Gln-Cys(SO3H)-Cys(SO3H)-Ala-Ser-Val-Cys(SO3H)-Ser-Leu-Tyr-Gln-Leu-Glu-Asn-Tyr-Cys(SO3H)-Asn.xNH3 | | |
Mw=Molecular weight. (i) DS36wt, (ii) DS36opt, (iii) DN58wt, (iv) DN58opt.
Wildtype DENV2 isolated from dengue patients was obtained from the Medical Microbiology Department, Faculty of Medicine, University of Malaya. The DENV2 used throughout this study was propagated in C6/36 mosquito cells. The cells were grown in L-15 medium (Sigma-Aldrich) supplemented with 10% heat-inactivated fetal calf serum at 28°C. DENV2 RNA was extracted from virus-infected C6/36 cells using QIAamp Viral RNA kit (Qiagen). Reverse transcription was subsequently performed using OneStep reverse transcriptase-polymerase chain reaction (PCR) kit (Qiagen). Oligonucleotides were synthesized by 1st BASE (Malaysia). The encoding EIII region was amplified using the forward primer, 5′-GCAGGATCCG GAA TGT CAT ACT CTA TGT GC-3′ and the reverse primer, 5′-TGCAAGCTTT TAT TTC TTA AAC CAG TTG AGC-3.′ The restriction sites BamHI and HindIII (New England Biolabs) are italicized. A stop codon was included in the reverse primers after the EIII gene sequence. The PCR product of 297 bp was digested with respective restriction enzymes, and the DNA fragment was cloned into the pQE30-Xa using T4 ligase (Promega), and then transformed into Escherichia coli (E. coli) XL1-Blue MRF′ (Stratagene). The nucleotide sequence was confirmed via DNA sequence analysis. The resulting recombinant plasmid expressed the EIII protein together with a hexahistidine tag at the N-terminus for affinity purification and a Factor Xa protease recognition site upstream of the EIII gene.
Protein Expression and PurificationE. coli XL1-Blue MRF′ cells transformed with pQE30-Xa vector containing EIII inserts were grown in Luria–Bertani (LB) broth supplemented with ampicillin (100 µg/mL) at 37°C until the OD600 reached approximately 0.7. Protein expression was induced with 0.7 mM isopropyl β-D-thiogalactopyranoside (IPTG) at 37°C for 4 h. Cells were harvested by centrifugation at 8000×g for 15 min at 4°C and re-suspended in lysis buffer (0.05 M NaH2PO4 pH 8.0, 0.5 M NaCl, 1 mg/mL lysozyme). Cells were lysed by sonication and debris was removed by centrifugation at 17000×g for 30 min at 4°C. The resulting protein solution was loaded onto a 5 mL Ni–NTA agarose (Qiagen) packed in 10 mL purification column (BioRad) equilibrated with binding buffer (0.05 M NaH2PO4 pH 8.0, 0.5 M NaCl, 0.01 M imidazole). The resin was washed with 10 column volumes of wash buffer with increasing concentration of imidazole up to 0.08 M before a final elution with a buffer containing 0.25 M imidazole. Peak fractions were analyzed by 15% sodium dodecyl sulfate-polyacrylamide gel electrophoresis (SDS-PAGE). Western blot analysis was performed using a polyclonal HisTag Antibody® horseradish peroxidase (HRP) conjugate (Novagen) against the six His tag to determine the authenticity of the protein. Positive fractions were pooled and subsequently concentrated using spin concentrators with molecular weight cutoff of 3000 Da (Sartorius Stedim). A buffer exchange with 1X phosphate-buffered saline (PBS) pH 7.4 was carried out using the desalting column (GE Healthcare). The recombinant EIII protein was incubated for 6 h with Factor Xa protease (Novagen). A second round of affinity purification was done to separate the EIII protein from the other cleaved fragments. The concentration of the protein was determined by Bradford assay.
Absorption SpectroscopyFor absorbance measurements, Corning UV transparent 96 well flat bottom microplates (Sigma-Aldrich) were used. Absorbance spectroscopic scans of peptides were measured using Infinite M200 microplate reader (Tecan Group Ltd., Switzerland) from 230 nm to 400 nm in 1 nm increments. All compounds were diluted in 200 µL of 1X PBS pH 7.4 to a final concentration of 20 µM. All of the measurements were recorded in triplicates.
Fluorescence Microplate AssayThe tryptophan fluorescence was measured using an Infinite M200 microplate reader (Tecan Group Ltd.). Greiner Bio One black 96 wells flat bottom non-binding microplates (Sigma-Aldrich) were used for fluorescence determinations. All of the fluorescence intensity measurements were recorded in triplicates. The buffer used for fluorescence-quenching experiment was 1X PBS pH 7.4. The excitation wavelength was 280 nm, and the emission data were recorded between 300 and 400 nm. All measurements were made on triplicates of 200 µL aliquots pipetted into the microplate wells. The property of the intrinsic tryptophan fluorescence of EIII domain in 1X PBS pH 7.4 was assessed by determining the fluorescence intensity for EIII domain at concentrations of 30 and 50 µM. For comparison with the EIII tryptophan fluorescence, the unique properties of L-tryptophan (Sigma-Aldrich) fluorescence were investigated in 1X PBS pH 7.4 with a concentration of 50 µM. The effects of different DMSO and DMF concentrations on tryptophan fluorescence of EIII were assessed using dilutions of 1.0% and 2.0%. Each dilution was prepared in 1X PBS pH 7.4 containing 100 µM of EIII. The optimal concentrations of DMSO and DMF used in the fluorescence-binding assay were also determined to maintain compound solubility.
In the peptide-induced fluorescence quenching experiment, black 96-well microplates were filled with a final concentration of 100 µM of EIII in 1X PBS pH 7.4 containing the peptides of a varying concentrations (2, 8, 20 and 40 µM); and the samples were incubated at 25°C for 1 h. The final concentration of DMSO and DMF was fixed to 1%. To diminish the effects of DMSO and DMF on the tryptophan fluorescence of EIII in the peptide-induced fluorescence experiment, a reference control was prepared where 1% of each solvent was added to EIII without the presence of peptide. Insulin chain A oxidized ammonium salt from bovine pancreas (Table 1) (Sigma-Aldrich) was used as the negative control in the peptide induced fluorescence assay with the following concentrations; 2, 8, 20, 40 and 100 µM. Insulin chain A oxidized ammonium salt was prepared as a 1 mM stock in DMSO. The rationale of using insulin chain A as the negative control is due to the fact that the molecular weight is similar to the peptides used in this study. Secondly, the binding sites of insulin chain A is not present in the EIII as indicated by the pairwise sequence alignment and superimposition of the crystal structures of EIII2) and insulin receptor extracellular domain.13–16) These evidences increased the confidence level that insulin chain A oxidized ammonium salt should not have any interaction with EIII. Each individual plate contained the reference and negative controls.
The relative fluorescence-quenching intensity, FQ, was determined using the following equation:
 | (1) |
where FLEIII is the EIII fluorescence intensity (at the λmax of emission) in the absence of peptide, and FLEIII-peptide is the fluorescence intensity of the EIII-peptide complex (at the λmax of emission).
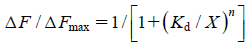
The affinities of the peptide binding to the EIII protein were measured from an equilibrium binding experiment with the starting assumption that the stoichiometry is 1 : 1. To determine the appropriate EIII protein concentration, pilot experiments were conducted with series of reactions, each with a fixed, low concentration of total EIII protein and a wide range of concentrations of peptide. A final concentration of 8 µM of EIII was chosen and was added to a buffer that contained various concentrations of peptide, and the samples were incubated at 25°C for 3 h. To determine the apparent dissociation constant (Kd) between the peptide and EIII protein, the peptide-induced fluorescence changes (ΔF) from three separate experiments (after the addition of peptides at 25°C) were averaged and fitted with the Hill equation using the GraphPad Prism software program (San Diego, CA, U.S.A.) as follows:
 | (2) |
where ΔFmax is the saturating value of the fluorescence change, X is the peptide concentration, Kd is the apparent dissociation constant, and n is the Hill coefficient.
Native-Page Gel Retardation AssayTo validate the tryptophan fluorescence quenching assay, a native-page gel retardation assay was performed to detect the EIII–peptide complex. The native page stacking gel was prepared as follow; 85.5% (v/v) of 0.375 M Tris–HCl pH 8.8, 13.4% (v/v) of 30% (v/v) acrylamide : bis-acrylamide 29 : 1, 1% (v/v) of 10% (w/v) ammonium persulfate and 0.1% (v/v) N,N,N′,N′-tetra-methylethylenediamine (TEMED). The solutions used for 10% native page separating gel were 64.9% (v/v) of 0.375 M Tris–HCl pH 8.8, 34% (v/v) of 30% (w/v) acrylamide : bis-acrylamide 29 : 1, 1% (v/v) of 10% (w/v) ammonium persulfate and 0.1% (v/v) TEMED. The running buffer composition consists of 25 mM Tris and 192 mM glycine. Sample buffer was prepared as 2X containing 62.5 mM Tris–HCL pH 6.8, 25% glycerol and 1% bromophenol blue. The EIII protein at 100 µM in 1X PBS pH 7.4 was incubated with 40 µM of the peptide for 1 h at 25°C. The protein–peptide mixture was electrophoresed at 90V (constant) at 4°C until the bromophenol blue tracking dye reached the bottom of the gel.
Results and Discussion
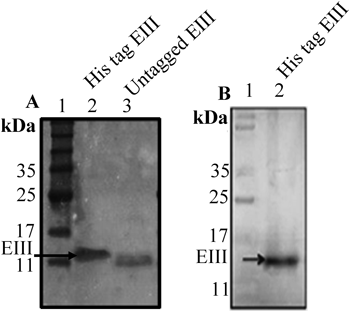
Production of Recombinant EIIITo date, the expression of recombinant EIII has been performed in various hosts, such as bacteria, yeast and in the leaves of tobacco plants.17–19) In this study, we cloned the EIII gene into pQE30-Xa expression vector and the expression of the recombinant EIII protein in E. coli XL1-Blue MRF′ was chemically induced with IPTG. SDS-PAGE analyses of the protein profiles demonstrated that recombinant EIII protein expression was optimal at approximately 4–5 h post-IPTG induction at 37°C. Furthermore, neither increased IPTG induction time nor IPTG concentration significantly improved recombinant EIII protein yield (data not shown). SDS-PAGE analysis demonstrated that the purified DENV 2 EIII protein has a molecular mass of approximately 15 kDa (Fig. 1A). In addition, the DENV2 EIII protein was detected using anti-His antibody via Western blot (Fig. 1B). Generally, per 1 L batch of E. coli MRF′ culture, approximately 1.0 mg of purified recombinant EIII protein was obtained. The SDS-PAGE analyses also demonstrated that the purity of the EIII protein after the His tag affinity purification was more than 95%.
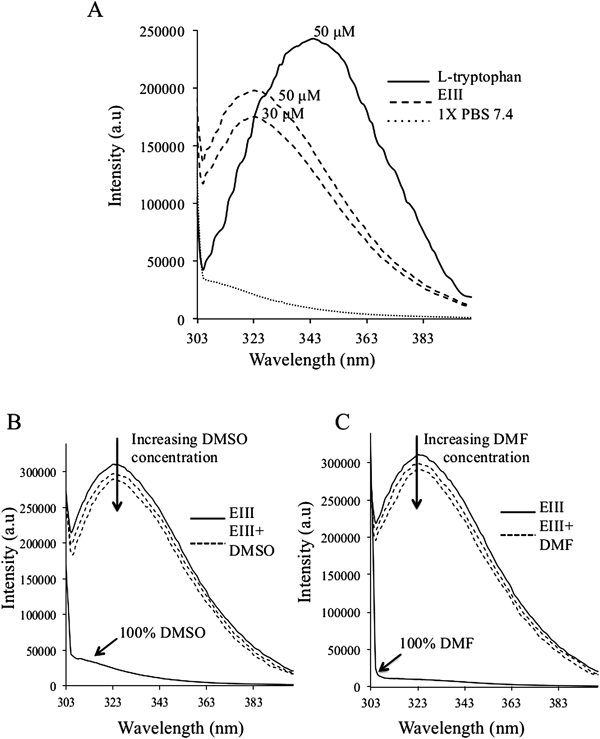
Tryptophan Fluorescence of EIII and Effects of the SolventsFigure 2A shows the emission spectra of free L-tryptophan and recombinant EIII protein in 1X PBS pH 7.4. It is known that tryptophan in solution displays a maximum excitation around 280 nm and an emission maximum around 350 nm. At 280 nm, tryptophan absorbs more light than either tyrosine or phenylalanine. The emission spectrum of tryptophan is sensitive to solvent polarity. If the tryptophan residues are buried in a hydrophobic environment within a protein, the emission will undergo a blue-shift to shorter wavelength (λ).11) In fact, from Fig. 2A, it was observed that the emission λmax for EIII tryptophan is at 323 nm and that for free L-tryptophan is close to 344 nm. Increasing fluorescence intensity of tryptophan EIII was observed with increasing EIII protein concentration. DMSO and DMF are strong polar organic solvents that can easily strip water from the surface of a protein, and can compete strongly for hydrogen bonds with atoms of the protein. Up to a certain concentration, these solvents are usually capable of denaturing the protein structure to a largely unfolded state.20) As shown in Figs. 2B and C, the addition of 1% of these solvents to the EIII protein quenched the tryptophan fluorescence intensity to a minimal effect as compared to the tryptophan fluorescence of EIII with the relative FQ of ca. 0.04. Further increase in the solvent concentration to 2% resulted in higher tryptophan fluorescence quenching effect with FQ of ca. 0.07.
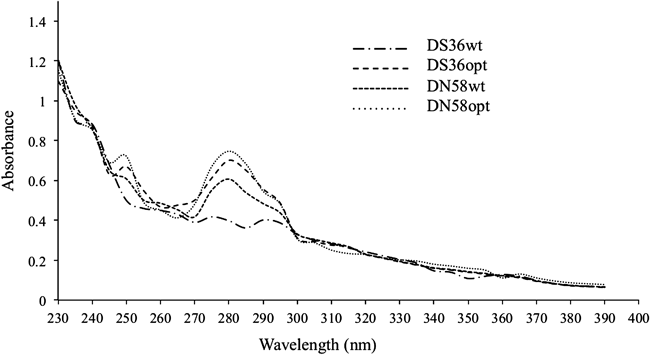
Absorbance Spectra of PeptidesThe absorbance of DS36opt, DN58wt and DN58opt illustrated bathochromic shifts of the primary and secondary bands of a benzene chromophore. As shown in Fig. 3, the primary bands of these peptides could be observed at 250 nm, and the secondary bands at 280 nm. These bathochromic shifts can be attributed to the high conjugation of the π-system in the aromatic ring of tryptophan. These peaks were not observed with DS36wt.
Intrinsic Tryptophan Fluorescence of PeptidesIn this study, fluorescence emission of DS36opt, DN58wt and DN58opt were investigated at the excitation λ of 280 nm since these peptides contained tryptophan residue. Figures 4A–C display the tryptophan fluorescence profiles of the three respective peptides at concentrations of 2, 8, 20 and 40 µM in 1X PBS at pH 7.4 buffer. The λmax for fluorescence of the peptides was close to 333 nm, which was 10 nm more than that for EIII (323 nm), but ca. 10 nm lower than that for free L-tryptophan (344 nm). As shown in Figs. 4A–C, the intensities of the fluorescence increased with increasing peptide concentrations.
Screening of Ligand Binding by Fluorescence-Quenching EffectPeptides designed by Xu et al.12) were used to test if the intrinsic Trp321 of EIII can be used to monitor the peptides binding to the DENV2 EIII. To mimic the physiological environment, PBS at 1X concentration, pH 7.4 was used as the buffer in the binding assay. The fluorescence spectrum for the EIII showed the emission λmax at 323 nm with approximately 330000 AU (Figs. 5A–D). As shown in Fig. 5A, no decrease in the fluorescence intensity of EIII was detected at concentrations of 2 and 8 µM for DS36wt. At peptide concentrations of 20 and 40 µM, DS36wt slightly decreased the fluorescence intensity of the EIII at 323 nm by 8596 and 21429 AU, respectively (Fig. 5A). On the contrary, analysis of DS36opt, DN58wt and DN58opt showed more interesting results. The three peptides, even at concentration as low as 2 µM, decreased the fluorescence intensity of EIII by 72322, 33142 and 54622 AU, respectively (Figs. 5B–D). The fluorescence of EIII was quenched following the binding of DS36opt, DN58wt, and DN58opt in a concentration-dependent manner, and this reflected the interaction of EIII with DS36opt, DN58wt and DN58opt. Even at 2 µM, approximately a 0.22, 0.10 and 0.16 fold relative fluorescence-quenching intensity was observed for EIII-DS36opt, EIII-DN58wt and EIII-DN58opt, respectively (Fig. 5F). In contrast, for DS36wt even at 40 µM, only approximately 0.06 fold relative fluorescence-quenching intensity of EIII was observed, indicating poor binding of EIII with DS36wt which may be due to non-specific interactions.
As expected, insulin chain A oxidized ammonium salt used as a negative control at concentrations of 2, 4, 20 and 40 µM did not quench the EIII tryptophan fluorescence. The negligible decrease in the EIII tryptophan fluorescence intensity observed at 100 µM of insulin chain A oxidized ammonium salt could be accounted by non-specific binding. These results showed that this simple intrinsic tryptophan-quenching assay was reliable and specific.
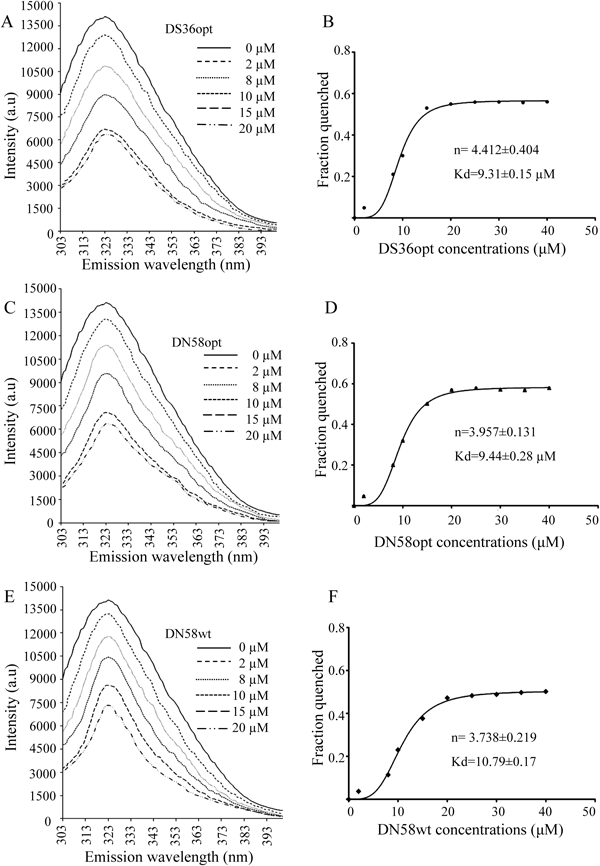
As shown in Fig. 6, the fluorescence quenching of the EIII protein by DS36opt, DN58opt and DN58wt were analyzed with the Hill plot after the addition of peptides. The affinity of DS36opt for the EIII protein (Kd of 9.31±0.15 µM) was slightly higher than that for the DN58opt (Kd of 9.44±0.28 µM). The DN58wt exhibited weaker binding affinity for the EIII protein (Kd of 10.79±0.17 µM) compared toDS36opt and DN58wt. As indicated previously (Fig. 5A), no significant fluorescence-quenching intensity of EIII was observed at a concentration of 8 µM of EIII. According to the n value, the binding between DS36opt, DN58opt, DN58wt and the EIII protein appeared to be cooperative. The incubation time for saturation binding experiment was prolonged to 3 h to allow the reactions to reach equilibrium. Low amount of EIII protein was used for the equilibrium binding experiment with a wide range of concentrations of peptides to simplify the analysis.
Native-Page Gel Retardation AssayA native page gel mobility assay was used to detect protein–peptide interactions. The assay is based on both the charge of the protein and its hydrodynamic size. The presences of the DS36opt, DN58wt and DN58opt at 40 µM retard the electrophoretic mobility of EIII protein in 1X PBS at pH 7.4 which indicates binding of the peptides to the EIII (Fig. 7). Small amount of excess unbound EIII protein were detected in the presence of DS36opt, DN58wt and DN58opt. In contrast, no EIII protein band shift was observed in the presence of DS36wt and insulin chain A oxidized ammonium salt at 40 µM, indicating that no EIII–peptide complex was formed. The findings on native-page gel retardation assay correlated with the results of the tryptophan fluorescence quenching assay; thus validating the latter assay.
Conclusion
In this study, we have developed a simple, and cheap binding assay using the tryptophan fluorescence properties that can be used to screen compounds (small molecule or peptides) capable of binding with the EIII of dengue virus. The proposed binding assay of the peptides to EIII protein is simple, economical and convenient. This assay can be easily adapted for routine drug screening application, which will be beneficial in the development of therapeutic agent against not only dengue, but also the Flaviviridae family, globally.
Acknowledgments
This research was supported by Grants from University of Malaya (UMRG RP002/2012C and UM-QUB collaboration). We would also like to acknowledge Aurigene Discovery Technologies, India, for the peptides.
References
- 1) Centers for Disease Control and Prevention (CDC).: <http://www.cdc.gov/Dengue/epidemiology>.
- 2) Modis Y., Ogata S., Clements D., Harrison S. C., Nature (London), 427, 313–319 (2004).
- 3) Watterson D., Kobe B., Young P. R., J. Gen. Virol., 93, 72–82 (2012).
- 4) Chen Y., Maguire T., Hileman R. E., Fromm J. R., Esko J. D., Linhardt R. J., Marks R. M., Nat. Med., 3, 866–871 (1997).
- 5) Pokidysheva E., Zhang Y., Battisti A. J., Bator-Kelly C. M., Chipman P. R., Xiao C., Gregorio G. G., Hendrickson W. A., Kuhn R. J., Rossmann M. G., Cell, 124, 485–493 (2006).
- 6) Pattnaik P., Babu J. P., Verma S. K., Tak V., Rao P. V., J. Chromatogr. B Analyt. Technol. Biomed. Life Sci., 846, 184–194 (2007).
- 7) Huerta V., Chinea G., Fleitas N., Sarria M., Sanchez J., Toledo P., Padron G., Virus Res., 137, 225–234 (2008).
- 8) Kaufmann B., Rossmann M. G., Microbes Infect., 13, 1–9 (2011).
- 9) Zidane N., Ould-Abeih M. B., Petit-Topin I., Bedouelle H., Biosci. Rep., 33, 113–124 (2012).
- 10) Gorinstein S., Goshev I., Moncheva S., Zemser M., Weisz M., Caspi A., Libman I., Lerner H. Z., Trakhtenberg S., Martin-Belloso O., J. Protein Chem., 19, 637–642 (2000).
- 11) Rawel H. M., Frey S. K., Meidtner K., Kroll J., Schweigert F., Mol. Nutr. Food Res., 50, 705–713 (2006).
- 12) Xu Y., Rahman N. A., Othman R., Hu P., Huang M., Proteins, 80, 2154–2168 (2012).
- 13) Williams P. F., Mynarcik D. C., Yu G. Q., Whittaker J., J. Biol. Chem., 270, 3012–3016 (1995).
- 14) Schäffer L., Eur. J. Biochem., 221, 1127–1132 (1994).
- 15) Smith B. J., Huang K., Kong G., Chan S. J., Nakagawa S., Menting J. G., Hu S.-Q., Whittaker J., Steiner D. F., Katsoyannis P. G., Ward C. W., Weiss M. A., Lawrence M. C., Proc. Natl. Acad. Sci. U.S.A., 107, 6771–6776 (2010).
- 16) Spassov V. Z., Yan L., Protein Sci., 17, 1955–1970 (2008).
- 17) Tripathi N. K., Babu J. P., Shrivastva A., Parida M., Jana A. M., Rao P. V., J. Biotechnol., 134, 278–286 (2008).
- 18) Tan L. C., Chua A. J., Goh L. S., Pua S. M., Cheong Y. K., Ng M. L., Protein Expr. Purif., 74, 129–137 (2010).
- 19) Etemad B., Batra G., Raut R., Dahiya S., Khanam S., Swaminathan S., Khanna N., Am. J. Trop. Med. Hyg., 79, 353–363 (2008).
- 20) Knubovets T., Osterhout J. J., Klibanov A. M., Biotechnol. Bioeng., 63, 242–248 (1999).