Abstract
The interaction of mycophenolate mofetil (MMF) with ferrous ions (Fe2+) in the solid state, in water, and in polar organic solvents was investigated using 1H-NMR, 13C-NMR, IR, and UV-visible (Vis) spectroscopies. A red-purple colored substance was formed after grinding solid MMF and FeSO4·7H2O in a mortar. The IR spectrum of taken as a KBr tablet of the colored substance showed a new absorption band at 1651 cm−1. Although the color disappeared when the sample was dissolved in water, it persisted in organic solvents such as MeOH or dimethyl sulfoxide (DMSO). The UV-Vis spectrum of a 0.25 mM MeOH solution of MMF showed a new absorption maximum at 507 nm in the presence of Fe2+ ions, while an aqueous solution of the same mixture showed no significant change from the MMF solution. All the signals in the 13C-NMR spectrum in DMSO-d6 solution were unambiguously assigned. Upon the addition of 0.5 eq. of Fe2+ ions, all the carbon signals except those of the 2-morpholinoethyl group almost disappeared, which clearly indicated that the Fe2+ ions were located far away from the 2-morpholinoethyl groups in the MMF molecules. On the basis of these results, we have concluded that the MMF–Fe2+ complex is actually formed in the solid state as well as in polar organic solvents such as MeOH or DMSO.
Mycophenolate mofetil (MMF), the ester of mycophenolic acid (MPA) with 2-morpholinoethanol, is an immunosuppressive agent with proven efficacy for the prevention of rejection in organ transplant recipients.1,2) Following oral administration, MMF is rapidly absorbed and hydrolyzed to form the active metabolite, MPA, which is converted to its 7-O-glucuronide (MPAG) for renal excretion (Chart 1).

Chart 1. Metabolic Pathway of Mycophenolate Mofetil (MMF)
Renal transplant recipients are given iron supplements for anemia. Morii et al. reported that concomitant administration of MMF and ferrous sulfate (FeSO4) to healthy volunteers significantly decreased MMF absorption, and ascribed this phenomenon to the formation of a chelation complex between MMF and iron ion (Fe2+).3) After this report, however, several groups reported that concomitant administration of MMF and Fe2+ to renal transplant recipients did not affect the pharmacokinetics of MMF.4–7) More recently, Naito et al. reported that concomitant administration of metal cations decreased the plasma concentration of MPA, the active metabolite of MMF, in kidney transplant patients receiving tacrolimus.8–11) These confusing observations on the interaction between MMF and metal cations in pharmacological therapy have yet to be resolved.
Only a few reports have been published on the interactions between MMF or MPA and metal cations compared to many studies on the effect of metal cations on the pharmacokinetics of these drugs.12–15) For example, Lidgate et al. examined the effect of Fe2+ ions on the solubility and chemical reactivity of MMF together with the partition coefficient of MMF and MPA. On the basis of these results, they concluded that the presence of Fe2+ ions did not suggest the formation of a MMF–iron complex.14) Badrick and Jones also reported that MMF and MPA showed no binding with Fe2+ ions in simulated gastrointestinal solution.13) However, no reports have been published on the spectroscopic studies of a complex formed between MMF and Fe2+ ions. The purpose of this study is to determine whether MMF interacts with Fe2+ ions under certain conditions using 1H-NMR, 13C-NMR, IR, and UV-visible (Vis) spectroscopies.
Experimental
ChemicalsMycophenolate mofetil was provided by Roche Ltd. All chemical reagents were purchased from Wako Pure Chemical Industries, Ltd.
Spectroscopic Measurements: IR SpectroscopyIR spectra were recorded on a Jasco FT/IR-230 instrument. After mycophenolate mofetil (34.8 µmol) and FeSO4 (34.8 µmol) were ground in a mortar, a KBr tablet was prepared and IR spectra were measured.
UV-Vis SpectroscopyPreparation of Aqueous SolutionOne millimolar solution of MMF was prepared by dissolving MMF in 0.1 M HCl. This solution was diluted with water 10 times (0.1 mM MMF). To 2 mL of this solution, a corresponding amount of 1 mM HCl solution of FeSO4 was added, and then this solution was diluted to 10 mL with distilled water (0.02 mM MMF).
Preparation of MeOH SolutionA 1.0 mM MeOH solution of MMF and a 10 mM MeOH solution of FeSO4 were prepared. To the MMF solution was added a calculated amount of the FeSO4 solution, which was diluted with MeOH to make a 0.05 mM solution. A concentrated MeOH solution of MMF (0.25 mM) was similarly prepared.
MeasurementThe UV-Vis spectra were recorded from 200 to 1000 nm on a Shimadzu UVmini-1240.
NMR Spectroscopy1H-NMR and 13C-NMR spectra were recorded in dimethyl sulfoxide (DMSO)-d6 and CD3OD solutions on a JEOL ECP-500 instrument operating at 500 MHz for 1H and 126 MHz for 13C. Chemical shifts were referenced to the residual peaks of DMSO-d6 and CD3OD. The NMR sample was prepared by the addition of 0.5 eq of solid FeSO4·7H2O to an NMR sample tube containing MMF (34.8 µmol) in DMSO-d6 (0.75 mL) and in CD3OD (0.75 mL). In each case, a clear solution was darkened after the addition of FeSO4 due to the low solubility of the complex.
Results
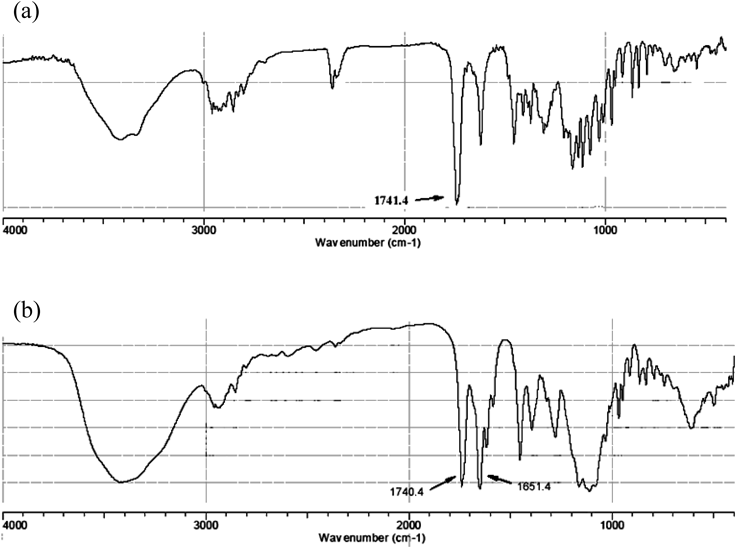
IR SpectroscopyThe IR spectra of KBr tablets containing MMF and a mixture of MMF and Fe2+ (FeSO4·7H2O) were measured, and they are shown in Figs. 1a and b, respectively. Comparison of these spectra clearly indicates that a new band appears at 1651 cm−1 upon addition of Fe2+.
UV-Vis SpectroscopyVarious amounts of Fe2+ (FeSO4·7H2O) were added to an aqueous MMF solution. No appreciable change was observed in the UV-Vis spectra even after the addition of 10 eq of Fe2+ relative to MMF. Changing the solvent from water to methanol produced no significant change in the spectra in the range of 200 to 500 nm (Fig. 2). Close inspection of the spectra revealed, however, the presence of a weak absorption band around 500 nm. In order to observe this weak band better, a concentrated MMF solution (0.25 mM) was prepared. Figure 3 shows that the absorption band at 507 nm increased with an increase in the number Fe2+ ions.
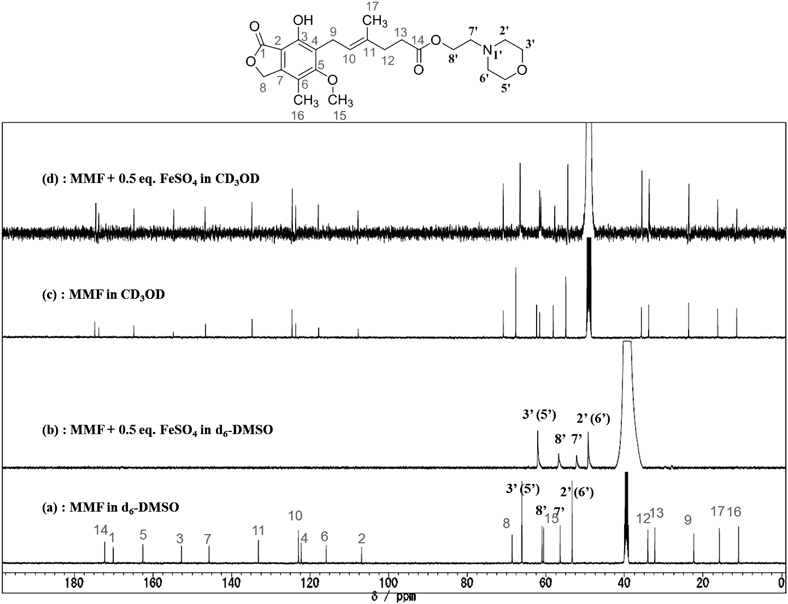
NMR SpectroscopyWhile no appreciable change was observed in the 1H-NMR spectra of MMF taken in D2O solution after the addition of 0.5 eq of Fe2+ (FeSO4·7H2O), broadening of the peaks and reduction of the sensitivity were observed in both DMSO-d6 and CD3OD solution (see supplemental information). The results are indicative of the interaction between Fe2+ and MMF in these solutions. However, because all the signals broadened to a similar extent, we could not get valuable information from the 1H-NMR spectra. By contrast, the 13C-NMR spectra in DMSO-d6 solution were quite informative. Figure 4a shows the 13C-NMR spectrum of MMF taken in DMSO-d6 solution. These signals were unambiguously assigned on the basis of the HH-correlation spectroscopy (COSY), CH-COSY, and heteronuclear multiple bond connectivity (HMBC) techniques and they are labeled in the spectrum. The assignment is consistent with that of MPA reported by Lu et al.16) When 0.5 eq. of Fe2+ was added, most of the peaks except for those of morpholinoethyl moiety around 50–70 ppm disappeared as shown in Fig. 4b. Figure 4c shows the 13C-NMR spectrum of MMF taken in CD3OD solution. In contrast to the case of DMSO-d6 solution, all the signals were observed even in the presence of 0.5 eq. of Fe2+ as shown in Fig. 4d though a slight downfield shift was detected in olefinic and carbonyl carbon signals.
Discussion
In aqueous solution, neither UV-Vis nor 1H-NMR spectra provided evidence for the formation of a complex between MMF and Fe2+. In fact, no appreciable change was observed in the UV-Vis spectra (figure not shown) and 1H-NMR spectra (Supporting Information) even upon the addition of 3 eq of Fe2+. Lidgate et al. studied whether the presence of Fe2+ affected the physicochemical properties of MMF and MPA. They concluded that a MMF–Fe2+ complex was not formed because the presence of Fe2+ did not affect the hydrolysis rate of MMF to MPA, solubility of MMF, or partition coefficient between MMF and MPA.14) Thus, our spectroscopic results in aqueous solution are consistent with Lidgate’s results. Furthermore, several groups have examined whether MMF absorption was affected by concomitant administration of MMF and Fe2+ in renal transplant recipients. These researchers concluded that concomitant administration had no significant effects on the MMF absorption in these recipients as well as in healthy adults.4–7)
The situation was quite different, however, in the solid state or in polar organic solvents such as methanol and DMSO. Our present study indicates that the interaction of MMF with Fe2+ ions does occur both in the solid state and in polar organic solvents. We noticed the development of a red-purple color when MMF was ground with FeSO4 in a mortar. The IR spectra taken in KBr tablets clearly showed a new band at 1651 cm−1 (Fig. 1), suggesting that some of the MMF molecules were involved in the coordination to Fe2+ ions through the carbonyl oxygen atom. Although the color disappeared when the sample was dissolved in water, it persisted in MeOH (Figs. 2, 3) and DMSO solution. These results suggest that the interaction of MMF with Fe2+ ions is maintained in these solvents; the presence of water disrupts such chelation due to the much stronger coordination of water molecules toward the Fe2+ ions. A similar absorption band was observed in methanol solution containing MPA and Fe2+ as reported by Badrick and Jones.13)
The interaction seemed to be more clearly observed in the 13C-NMR spectra taken in DMSO-d6 solution (Figs. 4a, b) We considered that, in the presence of 0.5 eq. of Fe2+ ion, the disappearance of some signals should be ascribed to the coordination of the MMF molecule to the paramagnetic Fe2+ ion to form MMF–Fe2+ complex17) (Fig. 4b). Furthermore, the appearance of the only 4 signals assigned to the morpholinoethyl moiety should be the indication that these carbons are located far away from the paramagnetic center. Thus, the possible structure of the complex is the one shown in Fig. 5 where MMF behaves as a bidentate ligand. Since the Fe2+ ion usually adopts 6-coordinated structure, the real structure could be expressed as [Fe(MMF)(Solvent)4]+, [Fe(MMF)2(Solven)2], and/or [Fe(MMF)3]−. The apparently weaker interaction between MMF and Fe2+ ion in CD3OD than in DMSO-d6 should be ascribed to the smaller solubility of the complex in CD3OD solution; the 13C-NMR spectrum in Fig. 4d is the mixture of free MMF (major) and MMF–Fe2+ (minor) complex where Fe2+ ion is rapidly exchanging on the NMR timescale.
Recent studies by Naito et al. revealed that concomitant administration of MMF and FeSO4 decreased the plasma concentration of MPA in patients receiving tacrolimus.10) They suggested that the chelate formation of MPA derived from biliary-excreted MPAG had more influence than that of MMF with Fe2+ ions on the MPA concentration in these patients. Correspondingly, our results indicated that the MMF–Fe2+ complex is formed not in aqueous solution but in less polar DMSO solution. It should be noted here that the carboxylate ion in MPA is a good bidentate ligand for various transition metal ions to form 2 : 1 complexes such as [Cu(MPA)2] and Fe(MPA)2].12,13) Thus, the coordination structure of MPA–Fe2+ should be different from that of MMF–Fe2+ proposed in this study. Although our findings could not be related to the pharmacological effect of concomitant administration of MMF and FeSO4 at the present time, it is possible that chelate formation of iron ion and MMF affects the pharmacokinetics, since there are many hydrophobic environments in vivo (e.g., cell membrane or biliary).
Conclusion
The interaction of MMF with Fe2+ was investigated using various spectroscopic methods. No evidence of an interaction was found in aqueous media, which was consistent with Ducray’s report.5) Our results using NMR, UV-Vis and IR spectroscopies indicated, however, that a MMF–Fe2+ complex was actually formed in the solid state as well as in polar organic solvents such as MeOH or DMSO. This is the first spectroscopic report to prove the formation of a complex between MMF and Fe2+.
Acknowledgment
This work was supported by a Grant-in-Aid for Scientific Research (No. 17590016) from the Ministry of Education, Culture, Sports, Science and Technology (MEXT) of Japan, by an “Open Research Center” project for private university matching fund subsidy from MEXT, and by the Uehara Memorial Foundation.
References
- 1) Staatz C. E., Tett S. E., Clin. Pharmacokinet., 46, 13–58 (2007).
- 2) Newbold N., Riley B., Hardinger K., Clinical Medicine: Therapeutics, 927–933 (2009-1).
- 3) Morii M., Ueno K., Ogawa A., Kato R., Yoshimura H., Wada K., Hashimoto H., Takada M., Tanaka K., Nakatani T., Shibakawa M., Clin. Pharmacol. Ther., 68, 613–616 (2000).
- 4) Lorenz M., Wolzt M., Weigel G., Puttinger H., Hörl W. H., Födinger M., Speiser W., Sunder-Plassmann G., Am. J. Kidney Dis., 43, 1098–1103 (2004).
- 5) Ducray P. S., Banken L., Gerber M., Boutouyrie B., Zandt H., Br. J. Clin. Pharmacol., 62, 492–495 (2006).
- 6) Mudge D. W., Atcheson B., Taylor P. J., Sturtevant J. M., Hawley C. M., Campbell S. B., Isbel N. M., Nicol D. L., Pillans P. I., Johnson D. W., Transplantation, 77, 206–209 (2004).
- 7) Gelone D. K., Park J. M., Lake K. D., Pharmacotherapy, 27, 1272–1278 (2007).
- 8) Naito T., Iryoyakugaku, 37, 277–287 (2011).
- 9) Naito T., Yakugaku Zasshi, 130, 1695–1700 (2010).
- 10) Naito T., Mino Y., Otsuka A., Ushiyama T., Ozono S., Kagawa Y., Kawakami J., Biol. Pharm. Bull., 31, 1292–1296 (2008).
- 11) Mino Y., Naito T., Shimoyama K., Ogawa N., Kawakami J., Biol. Pharm. Bull., 34, 755–759 (2011).
- 12) Jones C. E., Taylor P. J., McEwan A. G., Hanson G. R., J. Am. Chem. Soc., 128, 9378–9386 (2006).
- 13) Badrick A. C., Jones C. E., Transplantation, 84, 799–800 (2007).
- 14) Lidgate D., Brandl M., Holper M., Abubakari A., Wu X., Drug Dev. Ind. Pharm., 28, 1275–1283 (2002).
- 15) Kato R., Ooi K., Ikura-Morii M., Tsuchishita Y., Hashimoto H., Yoshimura H., Uenishi K., Kawai M., Tanaka K., Ueno K., J. Clin. Pharmacol., 42, 1275–1280 (2002).
- 16) Lu X., Zheng Z., Zhang H., Huo C., Dong Y., Ma Y., Ren X., Ke A., He J., Gu Y., Shi Q., J. Antibiot., 62, 527–529 (2009).
- 17) Bertini I., Luchinat C., “NMR of Paramagnetic Substances,” Vol. 150, Ch. 3, ed. by Lever A. B. P., Coord. Chem. Rev., Elsevier, Amsterdam, 1996, pp. 77–110.