Abstract
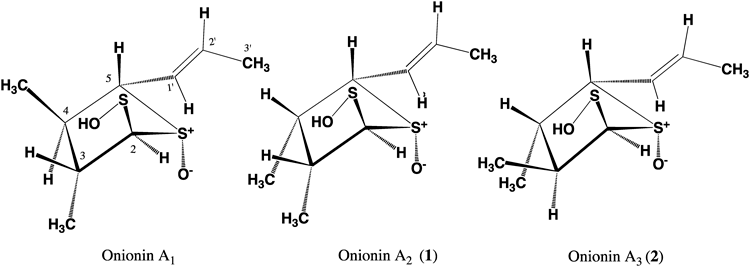
In this study, the new stable sulfur-containing compounds onionins A2 (1) and A3 (2) were isolated from the acetone extracts of the bulbs of Allium cepa L. and identified as the stereoisomers of onionin A1 discovered in our previous study. Their chemical structures, 3,4-dimethyl-5-(1E-propenyl)-tetrahydrothiophene-2-sulfenic acid-S-oxides, were characterized using various spectroscopic techniques. In addition, 1 and 2 together with onionin A1 were successfully isolated from the leaves of the Welsh onion, Allium fistulosum L. The onion-extracted fractions showed good potential to inhibit the polarization of M2 activated macrophages, indicating their possible ability to inhibit tumor cell proliferation.
Onion (Allium cepa L.), garlic (Allium sativum L.), and Welsh onion (Allium fistulosum L.) belong to the genus of Allium in Liliaceae family. In particular, garlic is ranked at the top of the list of designer foods showing anticancer effects by the National Cancer Institute.1) In general, the biological activities of onion and garlic can be classified into two categories: cardiovascular disease prevention and cancer prevention. The activities in the former category include the inhibition of cholesterol synthesis, platelet aggregation, and arterial smooth muscle cell proliferation as well as anti-inflammatory, antioxidant, and hydrogen sulfide-mediated vasodilatory effects. The activities in the latter category include the effects on carcinogen metabolism (i.e., enhanced cellular glutathione synthesis that induces cell cycle arrest and apoptosis), and prevention of Helicobacter pylori infection, gastric cancer, and colorectal cancer.2–5) The chemistry of garlic sulfides is summarized in a textbook edited by Block.4) In a previous study, we isolated a novel stable sulfide, 3,4-dimethyl-5-(1-propenyl)-tetrahydro- thiophene-2-sulfoxide-S-oxide, from A. capa and identified its inhibitive effect on macrophage activation. We originally named this compound as onionin A,6) and it was later shown that its structure at the geometry C-1′ should be revised as E, and renamed as onionin A1. Similarly, the sulfur-containing substances, garlicnins A,7) B1–B4,8,9) C1–C3,8,9) D,8) L-1–L-4, E, and F10) extracted from the acetone-soluble extract of the bulbs of A. sativum, were isolated and characterized to develop of natural and healthy foods that could prevent and combat various types of diseases, particularly cancers. In this study, cyclic sulfoxides correlated to onionin A1—two new sulfides named onionins A2 (1) and A3 (2)—were isolated as a syrup from the bulbs of onion and characterized by spectroscopic analysis. Moreover, onionins A1, A2 (1), and A3 (2) were successfully isolated from the leaves of A. fistulosum L. This paper will mainly discuss the chemical structures of these onionins characterized by using various spectroscopic techniques.
Three A. cepa bulbs (638.9 g) were roughly chopped and blended with acetone in a high-speed mixer. The mixture was then soaked in acetone for 3 d at room temperature. Then, the filtrate was evaporated at 40°C in vacuo to obtain a residue (43.94 g), which was partitioned between ethyl acetate (EtOAc) and water. The resulting respective residues, ethyl acetate layer (Fr. 1, 752.6 mg) and aqueous layer (Fr. 2, 40.5 g), were examined separately for evaluating their abilities to inhibit macrophage activation.
Macrophages that infiltrate cancer tissues are referred to as tumor-associated macrophages (TAMs) and are closely involved in the development of the tumor microenvironment.11–13) TAMs are categorized as alternatively activated macrophages (M2) because of their anti-inflammatory functions.14,15) Normally, the presence of TAMs in certain types of tumors is associated with a poor prognosis of the tumor-bearing patients.13,16,17) It is known that the inhibition of M2-macrophage polarization can suppress tumor cell proliferation. The incubation of human monocyte-derived macrophages with interleukin 10 (IL10) for two days could increase the expression of a M2 macrophage marker CD163. In the present study, the effects of Fr. 1 and Fr. 2 on IL10-induced CD163 expression were evaluated under the same conditions. It was found that Fr. 1 and Fr. 2 inhibited the expression of CD163, indicating their capability for suppressing M2 macrophages. Based on these results, we can assume that the ingredients of Fr. 1 and Fr. 2 may show the similar potential to suppress tumor cell proliferation.
The remaining extractive (732.0 mg) was then chromatographed on silica gel eluted with n-hexane–acetone (6 : 1, 5 : 1, 4 : 1, 3 : 1, and 2 : 1) and two new compounds, namely, onionin A2 (1, 23.5 mg) and onionin A3 (2, 16.2 mg), were obtained along with onionin A1 (42.2 mg). The results of qualitative analysis using the sodium nitroprusside test confirmed the presence of sulfur in these compounds.
Onionin A2 (1) was obtained as a syrup showing [α]D +16.0° (CHCl3). The mass spectrum of 1 from positive-mode high-resolution fast bombardment mass spectroscopy (HR-FAB-MS) showed a pronounced peak corresponding to [M+Na]+ at m/z 243.0486 (Calcd for C9H16O2S2Na, 243.0489), and a base peak corresponding to [C6H11OS]+ at m/z 131.0525 (Calcd for C6H11OS, 131.0531). The spectrum of 1 from IR spectroscopy showed absorption bands at 2365 and 1025 cm−1 due to SH group and sulfoxide, respectively. The 1H-NMR spectrum (in CDCl3) of 1 showed signals from three secondary methyl groups at δ 1.07 (3H, d, J=6.8 Hz), 1.17 (3H, d, J=6.9 Hz), and 1.95 (3H, dd, J=1.7, 6.9 Hz); two olefinic protons at δ 6.15 (1H, dd, J=1.7, 13.7 Hz) and 6.52 (1H, dq, J=6.9, 13.7 Hz); and four methine protons at δ 2.00 (1H, m), 2.24 (1H, m), 4.04 (1H, d, J=5.1 Hz), and 5.09 (1H, d, J=3.4 Hz). The 13C-NMR spectrum (in CDCl3) of 1 exhibited the signals from three methyl groups at δ 13.7, 18.0, and 20.0; four methine carbons signals at δ 37.4, 55.0, 75.5, and 85.8; and two olefinic carbon signals at δ 129.6 and 137.7. Moreover, the result of 1H–1H correlation spectroscopy (COSY) showed the presence of a series of correlations between the methine proton at δ 5.09 and three methine protons at δ 2.00, 2.24, and 4.04, and between the olefinic proton at δ 6.15 and the olefinic proton at δ 6.52 and the methyl protons at δ 1.95. The vicinal correlations between the methine proton at δ 2.00 and the methyl protons at δ 1.07 and between the methine proton at δ 2.24 and the methyl protons at δ 1.17 were also observed. In addition, the heteronuclear multiple-bond correlation (HMBC) spectrum exhibited correlations between the methine proton at δ 5.09 and the carbon at δ 75.5; between the methyl proton at δ 1.07 and three methine carbons at δ 37.4, 55.0, and 85.8; between the methyl protons at δ 1.17 to the three methine carbons at δ 37.4, 55.0, and 75.5; between the methine proton at δ 4.04 and the methine carbon at δ 85.8; between the olefinic proton at δ 6.15 and the methine carbon at δ 75.5 and olefinic carbon at δ 137.7; between the olefinic proton at δ 6.52 and the olefinic carbon at δ 129.6; and between the methyl protons at δ 1.95 and two olefinic carbons at δ 129.6 and 137.7 (Fig. 1). The planar structure of 1 to be 3,4-dimethyl-5-(1-propenyl)-tetrahydrothiophene-2-sulfenic acid-S-oxide was determined by analyzing the 1H–1H COSY and HMBC spectra.
Furthermore, the nuclear Overhauser effect (NOE) measurement showed the following the 1H–1H correlations between CH3 at C-3 and H-2, between CH3 at C-3 and CH3 at C-4, between H-3 and H-4, between H-4 and H-5, and between H-5 and H-1′ (Fig. 1).
To determine the relative configuration of the compound, the aromatic solvent-induced NMR shift18,19) was analyzed in the same way as that used for studying onionin A1. It is known that the conformational preference of a sulfoxide is the axial form20–22) (lower α-side). In the case of 1H-NMR analysis in C6D6, the molecule of 1 forms a collision complex18) opposite to the sulfoxide, indicating that C6D6 is oriented towards the opposite side (upper β-side) of the sulfoxide and affects the NMR chemical shifts. As compared with the spectrum in CDCl3, the 1H-NMR spectrum of 1 in C6D6 showed that most signals were shifted upfield, including those of H-2 (−0.17), H-3 (−0.42), H-4 (−0.45), CH3 at C-3 (−0.18), CH3 at C-4 (−0.14), and H-5 (−0.46). In summary, the signals due to H-3, H-4, and H-5 significantly shifted towards the higher field and the only signals that remained relatively unchanged were those of H-2, CH3 at C-3 and CH3 at C-4. The configuration at C-1′ was determined to be E by the 1H-NMR signal of H-1′ at δ 6.15 (1H, dd, J=1.7, 13.7 Hz), and the result of NOE measurement showed no correlation between H-1′ and H-2′. The geometry at C-1′ was deduced to be E by the coupling constant of H-1′ and NOESY. Based on these results, we proposed the relative structure of 1 shown in Fig. 2.
Onionin A3 (2) was obtained as a syrup showing [α]D +12.8° (CHCl3). The positive mode HR-FAB-MS spectrum of 2 showed a pronounced peak corresponding to [M+Na]+ at m/z 243.0492 (Calcd for C9H16O2S2Na, 243.0489). Its IR spectrum showed absorption bands at 2366 and 1027 cm−1 due to SH group and sulfoxide, respectively. The 1H-NMR spectrum (in CDCl3) of 2 showed the signals due to three secondary methyl groups appeared at δ 1.11 (3H, d, J=7.3 Hz), 1.37 (3H, d, J=6.4 Hz), and 1.91 (3H, d, J=6.9 Hz); two olefinic protons at δ 6.06 (1H, d, J=13.7 Hz), and 6.47 (1H, m); and four methine protons at δ 1.98 (1H, m), 2.30 (1H, m), 3.97 (1H, d, J=5.7 Hz), and 5.05 (1H, d, J=3.5 Hz). Moreover, its 13C-NMR spectrum (in CDCl3) exhibited the signals from three methyl groups at δ 15.9, 17.9, and 18.1; four methine carbons signals at δ 50.8, 53.4, 77.8, and 89.9; and two olefinic carbon signals at δ 130.8 and 139.4. The 1H–1H COSY spectrum showed the presence of a series of correlations between the methine proton at δ 5.05 and the methine proton at δ 1.98; between the methine proton at δ 2.30 and the methine proton at δ 3.97; and between the olefinic proton at δ 6.06 and the olefinic proton at δ 6.47 and methyl protons at δ 1.91. The vicinal correlations between the methine proton at δ 1.98 and the methyl protons at δ 1.11, and between the methine proton at δ 2.30 and the methyl protons at δ 1.37 were also identified. In addition, the HMBC spectrum showed the correlations between the methine proton at δ 5.05 and the carbon at δ 77.8; between the methyl protons at δ 1.11 and the three methine carbons at δ 53.4, 50.8, and 89.9; between the methyl proton at δ 1.37 and three methine carbons at δ 50.8, 53.4, and 77.8; between the methine proton at δ 3.97 and the methine carbon at δ 89.9; between the olefinic proton at δ 6.06 and the methine carbon at δ 77.8 and olefinic carbon at δ 139.4; between the olefinic proton at δ 6.47 and the olefinic carbon at δ 130.8; and between the methyl proton at δ 1.91 and two olefinic carbons at δ 130.8 and 139.4 (Fig. 1). The planar structure of 2, 3,4-dimethyl-5-(1E-propenyl)-tetrahydrothiophene-2-sulfenic acid-S-oxide was revealed by analyzing the 1H–1H COSY and HMBC spectra. Furthermore, the NOESY spectrum showed the 1H–1H correlations between H-2 and H-3, between H-3 and CH3 at C-4, between H-4 and H-5, and between H-5 and H-1′ (Fig. 1).
To determine the relative configuration of the active substituents in 2, the aromatic solvent-induced shift in NMR spectrum was analyzed in the same way used for studying 1. As compared with the spectrum in CDCl3, the 1H-NMR spectrum of 2 in C6D6 showed that most signals were shifted upfield, including those of H-2 (−0.15), H-3 (−0.18), H-4 (−0.46), CH3 at C-3 (−0.44), CH3 at C-4 (−0.16), and H-5 (−0.43). In summary, the signals due to CH3-3 at C-3, H-4, and H-5 significantly shifted towards the higher field and the only signals remaining relatively unchanged were those of H-2, H-3, and CH3 at C-4. The configuration at C-1′ was determined to be E by the 1H-NMR signal of H-1′ at δ 6.06 (1H, d, J=13.7 Hz) and NOESY. On the basis of these results, we proposed the relative configuration of 2 shown in Fig. 2.
In addition, the white parts of the fresh leaves (1146.12 g) of A. fistulosum L. were collected, chopped and blended with acetone in a mixer. Subsequently, the mixture was soaked in acetone for three days at room temperature. The filtrate was concentrated at 40°C in vacuum to obtain a syrup residue (63.77 g), which was then partitioned between AcOEt and water (300 mL of each). The organic layer was collected and evaporated under a reduced pressure to produce a residue (1.0038 g), which was then chromatographed on silica gel eluted with CHCl3–MeOH (100 : 1) to yield five fractions. Then, Fr. 3 (200.4 mg) was furthermore subjected to silica gel chromatography with n-hexane–acetone (6 : 1) and three compounds identical to onionin A1 (34.2 mg), 1 (22.1 mg), and 2 (16.4 mg).
The proposed production of 1 and 2 is shown in Chart 1: Allyl sulfonic acid derived from (+)-S-allyl-L-cysteine sulfoxide (alliin) present in garlic yields diallyl thiosulfinate (allicin), which was transformed into 1-propenyl 1-propene-thiosulfinate via double-bond rearrangement and then become converted to 2,3-dimethyl-butanedithial 1-oxide via [3,3]-sigmatropic rearrangement.23) Next, the generated compound was ring-closed to form a thiophene derivative, which was attached with 1-propenesulfenic acid derived from allicin to finally produce garlicnin A2 (1).

Chart 1. Plausible Production Pathway of Onionins A
The identification and characterization of these novel sulfoxides isolated from onion, Welsh onion, and garlic will contribute to the accumulation of information on new chemicals and pharmaceutical substances in the Allium sulfide group. Based on these findings, pharmacological investigations will be conducted in the future to develop natural and healthy foods and anti-cancer agents that can prevent or combat disease.
Experimental
General Experimental ProcedureThe optical rotation was measured with a JASCO P-1020 (l=0.5) automatic digital polarimeter. The IR spectrum was measured with Fourier Transform FT/IR-4200 spectrometer (JASCO). The 1H- and 13C-NMR spectra were measured in CDCl3 and C6D6 with JEOL alpha 500 spectrometer at 500 and 125 MHz, respectively, and chemical shifts are on the δ (ppm) scale. The HR-FAB-MS were measured with a JEOL JMS-DX303HF mass spectrometer and taken in a glycerol matrix containing NaI. Column chromatography was carried out on silica gel 60 (230–400 mesh, Merck). TLC was performed on silica gel plates (Kieselgel 60 F254, Merck). TLC spots were visualized by UV light (254/366 nm) and sprayed with 10% H2SO4 and anisaldehyde sprays followed by heating.
Plant MaterialsOnion (Allium cepa L. family Liliaceae, yellow variety) and Welsh onion (Allium fistulosum L.) cultivated in Kumamoto prefecture, Japan, were purchased in October 2013 and April 2014, respectively, from the market at Kumamoto city.
Extraction and Isolation of OnionThe fresh peeled bulbs (638.9 g) of onions were roughly chopped and blended in a mixer along with acetone. Subsequently, the mixture was soaked in acetone for 3 d at room temperature. The filtrate was concentrated at 40°C in vacuo to obtain a syrup residue (43.94 g), which was then partitioned between ethyl acetate and water. The respective residues (Fr. 1: ethyl acetate layer 752.6 mg; Fr. 2: aqueous layer 40.5 g) were examined for their ability to control macrophage activation. The remaining extractive (732.0 mg) was then chromatographed on silica gel with n-hexane–acetone=6 : 1→5 : 1→4 : 1→3 : 1→2 : 1 to yield two new compounds named onionin A2 (1, 23.5 mg) and onionin A3 (2, 16.2 mg) along with onionin A1 (42.2 mg).
Determination of the Inhibitory Effect of Fractions on CD163 ExpressionHuman monocyte-derived macrophages (5×10⁴ cells per well of a 96-well plate) were incubated with fractions (100 µg/mL) for 24 h after treatment with IL-10 (20 nM) for 2 d, followed by the determination of CD163 expression by cell enzyme-linked immunosorbent assay (cell-ELISA).
Cell-ELISAExpression of CD163 on human monocyte-derived macrophages was evaluated using a cell-ELISA procedure, as described previously.24) Briefly, each well of a 96-well plate was blocked with Block Ace, and washed 3 times with phosphate buffered saline containing 0.05% Tween 20 (washing buffer). The wells were incubated with anti-CD163 antibody AM3K (2 µg/mL) and dissolved in washing buffer for 1 h. The wells were then washed with washing buffer 3 times and reacted with HRP-conjugated anti-mouse immunoglobulin G antibody followed by reaction with Ultrasensitive TMB (Moss, Inc., Pasadena, MD, U.S.A.). The reaction was terminated by the addition of 1 M sulfuric acid, and the absorbance at 450 nm was then read on a micro-ELISA plate reader.
StatisticsAll data are representative 2 or 3 independent experiments. Data are expressed as means (S.D.). Mann–Whitney’s U-test was used for 2-group comparison. A value of p<0.05 was considered statistically significant.
Effects of the Fractions on CD163 ExpressionNonload: 0.60 (absorbance at 450 nm); IL-10: 1.35; IL-10+ Fr. 1: 0.19; IL-10+ Fr. 2: 0.62. Human monocyte derived macrohages (5×10⁴ cells per well of a 96-well plate) were incubated with fractions (100 µg/mL) for 24 h after treatment with IL-10 (20 nM) for 2 d followed by determination of CD163 expression determination using cell-enzyme-linked immunosorbent assay as described in Materials and Methods. The data are presented as the means (S.D.). * p<0.01, ** p<0.001 vs. IL-10.
Onionin A2 (1)A syrup; [α]D24 +16.0° (c=0.5, CHCl3); IR νmax (KBr) 2365 (SH group), 1025 (sulfoxide) cm−1; positive HR-FAB-MS m/z: 243.0486 [M+Na]+ (Calcd for C9H16O2S2Na, 243.0489) (70%); and base peak at m/z 131.0525 [C6H11OS]+ (Calcd for C6H11OS, 131.0531).
1H-NMR (CDCl3) δ: 1.07 (3H, d, J=6.8 Hz, CH3 at C-3), 1.17 (3H, d, J=6.9 Hz, CH3 at C-4), 1.95 (3H, dd, J=1.7, 6.9 Hz, CH3 at C-3′), 2.00 (1H, m, H-3), 2.24 (1H, m, H-4), 4.04 (1H, d, J=5.1 Hz, H-5), 5.09 (1H, dd, J=3.4 Hz, H-2), 6.15 (1H, dd, J=1.7, 13.7 Hz, H-1′), 6.52 (1H, dq, J=6.9, 13.7 Hz, H-2′); 1H-NMR (C6D6) δ: 0.89 (3H, d, J=6.8 Hz, CH3 at C-3), 1.03 (3H, d, J=6.9 Hz, CH3 at C-4), 1.58 (1H, m, H-3), 1.79 (1H, m, H-4), 3.58 (1H, d, J=5.1 Hz, H-5), 4.92 (1H, d, J=3.2 Hz, H-2); 13C-NMR (CDCl3) δ: 13.7 (CH3-3), 20.0 (CH3-4), 18.0 (C-3′), 37.4 (C-4), 55.0 (C-3),75.5 (C-5), 85.8 (C-2), 129.6 (C-1′) and 137.7 (C-2′).
Onionin A3 (2)A syrup, [α]D24 +12.5° (c=0.5, CHCl3), IR νmax (KBr) 2366 (SH group), 1027 (sulfoxide) cm−1, positive HR-FAB-MS m/z: 243.0492 [M+Na]+ (Calcd for C9H16O2S2Na, 243.0489) .
1H-NMR (CDCl3) δ: 1.11 (3H, d, J=7.3 Hz, CH3 at C-3), 1.37 (3H, d, J=6.4 Hz, CH3 at C-4), 1.91 (3H, d, J=6.9 Hz, H3-3′), 1.98 (1H, m, H-3), 2.30 (1H, m, H-4), 3.97 (1H, d, J=5.7 Hz, H-5), 5.05 (1H, d, J=3.5 Hz, H-2), 6.06 (1H, d, J=13.7 Hz, H-1′), 6.47 (1H, m, H-2′); 1H-NMR (C6D6) δ: 0.67 (3H, d, J=7.3 Hz, CH3-3), 1.21 (3H, d, J=6.4 Hz, CH3-4), 1.80 (1H, m, H-3), 1.84 (1H, m, H-4), 3.54 (1H, d, J=5.7 Hz, H-5), 4.90 (1H, d, J=3.5, H-2); 13C-NMR (CDCl3, 125 MHz) δ: 15.9 (CH3 at C-3), 18.1 (CH3 at C-4), 17.9 (C-3′), 50.8 (C-4), 53.4 (C-3), 77.8 (C-5), 89.9 (C-2), 130.8 (C-1′) and 139.4 (C-2′).
Extraction and Isolation of Welsh OnionThe white parts of the fresh leaves (1146.12 g) of Welsh onion was chopped and blended in a mixer along with acetone. Subsequently, the mixture was soaked in acetone for three days at room temperature. The filtrate was concentrated at 40°C in vacuo to obtain a syrup residue (63.77 g), which was then partitioned between AcOEt and water (each 300 mL), and the organic layer was taken and evaporated under reduced pressure to give a residue (1.0038 g). The residue was then chromatographed on silica gel with CHCl3–MeOH=100 : 1 to give five fractions. Fr. 3 (200.4 mg) was furthermore subjected to silica gel chromatography with n-hexane–acetone=6 : 1 to afford three compounds identical with onionin A1 (34.2 mg), onionin A2 (22.1 mg), and onionin A3 (16.4 mg).
References
- 1) Theisen C., J. Natl. Cancer Inst., 93, 1049–1050 (2001).
- 2) Rose P., Whiteman M., Moore P. K., Zhu Y. Z., Nat. Prod. Rep., 22, 351–368 (2005).
- 3) Amagase H., J. Nutr., 136 (Suppl.), 716S–725S (2006).
- 4) Block E., “Garlic and Other Alliums: The Lore and Science,” The Royal Society of Chemistry, U.K., 2010.
- 5) Dewick P. M., “Medicinal Natural Products a Biosynthetic Approach,” 2nd ed., John Willey & Sons, U.K., 2002.
- 6) El-Aasr M., Fujiwara Y., Takeya M., Ikeda T., Tsukamoto S., Ono M., Nakano D., Okawa M., Kinjo J., Yoshimitsu H., Nohara T., J. Nat. Prod., 73, 1306–1308 (2010).
- 7) El-Aasr M., Fujiwara Y., Takeya M., Ono M., Nakano D., Okawa M., Kinjo J., Ikeda T., Miyashita H., Yoshimitsu H., Nohara T., Chem. Pharm. Bull., 59, 1340–1343 (2011).
- 8) Nohara T., Kiyota Y., Sakamoto T., Manabe H., Ono M., Ikeda T., Fujiwara Y., Nakano D., Kinjo J., Chem. Pharm. Bull., 60, 747–751 (2012).
- 9) Nohara T., Fujiwara Y., Ikeda T., Murakami K., Ono M., Nakano D., Kinjo J., Chem. Pharm. Bull., 61, 695–699 (2013).
- 10) Nohara T., Fujiwara Y., Ikeda T., Yamaguchi K., Manabe H., Murakami K., Ono M., Nakano D., Kinjo J., Chem. Pharm. Bull., 62, 477–482 (2014).
- 11) Mantovani A., Schioppa T., Biswas S. K., Marchesi F., Allavena P., Sica A., Tumor, 89, 459–468 (2003).
- 12) Sica A., Schioppa T., Mantovani A., Allavena P., Eur. J. Cancer, 42, 717–727 (2006).
- 13) Lewis C. E., Pollard J. W., Cancer Res., 66, 605–612 (2006).
- 14) Hagemann T., Biswas S. K., Lawrence T., Sica A., Lewis C. E., Blood, 113, 3139–3146 (2009).
- 15) Gordon S., Nat. Rev. Immunol., 3, 23–35 (2003).
- 16) Joyce J. A., Pollard J. W., Nat. Rev. Cancer, 9, 239–252 (2009).
- 17) Sica A., Larghi P., Mancino A., Rubino L., Porta C., Totaro M. G., Rimoldi M., Biswas S. K., Allavena P., Mantovani A., Semin. Cancer Biol., 18, 349–355 (2008).
- 18) Juaristi E., Cruz-Sanchez J. S., Petsom A., Glass R. S., Tetrahedron, 44, 5653–5660 (1988).
- 19) Ronayne J., Williams D. H., J. Chem. Soc. B, 1967, 540–546 (1967).
- 20) Johnson C. R., McCants D., J. Am. Chem. Soc., 86, 2935–2936 (1964).
- 21) Martin J. C., Uebel J. J., J. Am. Chem. Soc., 86, 2936–2937 (1964).
- 22) Lambert J. B., Keske R. G., J. Org. Chem., 31, 3429–3431 (1966).
- 23) Bayer T., Wagner H., Block E., Grisoni S., Zhao S. H., Neszmelyi A., J. Am. Chem. Soc., 111, 3085–3086 (1989).
- 24) Komohara Y., Hirahara J., Horikawa T., Kawamura K., Kiyota E., Sakashita N., Araki N., Takeya M., J. Histochem. Cytochem., 54, 763–771 (2006).