Results and Discussion
Compound 1 was isolated as an amorphous powder, and had a molecular formula of C26H38O11 based on the ion peak at m/z 549.2316 ([M+Na]+) in the high resolution-fast atom bombardment mass spectrometry (HR-FAB-MS) spectrum. The infrared (IR) spectrum of 1 suggested the presence of hydroxyl group (3328 cm−1), carbonyl group (1748 cm−1) and aromatic absorption (1418 cm−1). The 1H-NMR spectrum of 1 displayed signals for four methyl groups at δH 0.88 (H-11), 0.93 (H-12), 1.15 (H-10) and 1.59 (H-13), eight methylene proton signals at δH 1.41 (Hax-2), 1.77 (Heq-2), 1.99 (Hax −4), 2.26 (Heq-4), 1.86 (H-7a), 2.14 (H-7b), 1.43 (H-8a), and 1.45 (H-8b), and two oxymethine proton signals at δH 3.93 (H-3) and 3.68 (H-9) as well as aromatic proton signal at δH 7.10 (H-2″, H-6″) (Table 1). The 13C-NMR and distortionless enhancement by polarization transfer (DEPT) spectra showed the presence of a sugar moiety, four methyl groups at δC 23.3 (C-10), 28.8 (C-11), 30.2 (C-12), and 20.1 (C-13), four methylene groups at δC 47.7 (C-2), 39.9 (C-4), 25.6 (C-7), and 40.7 (C-8), two methines with oxygen function at δC 74.5 (C-3) and 69.3 (C-9), one quaternary carbon at δC 38.9 (C-1) and a tetrasubstituted double bond at δC 125.0 (C-5) and 138.7 (C-6) and remaining five signals of a galloyl unit which was characterized by δC 168.4 (C-7″), 110.4 (C-2″, C-6″), 146.7 (C-3″, C-5″), 139.9 (C-4″) and 121.5 (C-1″).9) These results suggested that 1 was a derivative of ionol (megastigmane) glycoside.10) The place of tetrasubstituted double bond in the megastigmane skeleton was between the 5- and 6-positions. This fact was confirmed by heteronuclear multiple bond connectivity (HMBC) between H-11, H-12 and C-6; H-13 and C-5, C-6 (Fig. 2A). The signals from the sugar moiety appeared at δC 103.1 (C-1′), 78.1 (C-3′), 75.5 (C-2′), 75.3 (C-5′), 72.2 (C-4′), 65.1 (C-6′) suggested the presence of D-glucopyranose.10) The coupling constant J=7.6 Hz of the anomeric proton of D-glucopyranose indicated it to be the β-form.10) The glycosidic and galloyl unit sites were determined base on the long-range correlation between the H-1′ (δH 4.42, d) and C-3 (δC 74.5) as well as H-6′ (δH 4.48, dd; 4.42, m) and C-7″ (δC 168.4) in the HMBC spectrum. Furthermore, the long-range correlations between the following protons and carbons (H-2, H-4, H-7, H-8, H-11, H-12, H-13 and C-6; H-2 and C-3; H-4, H-13 and C-5; H-2″ and C-1″, C-3″, C-4″, C-7″) were also observed in the HMBC spectrum (Fig. 2A). The glycosylated proton of H-3 at δH 3.93 showed couplings in the correlation spectroscopy (COSY) with Hax-2, Heq-2, Hax-4 and Heq-4. Thus, compound 1 was determined as 5-megastigmen-3,9-diol-3-O-(6′-galloyl)-β-D-glucopyranoside. To determine the absolute configuration of 3- and 9-positions, enzymatic hydrolysis of 1 with β-glucosidase yielded an aglycone as 5-megastigmen-3,9-diol, and then the modified Mosher’s method was applied.11) The (R)-α-methoxy-α-trifluoromethylphenyl acetyl (MTPA) and (S)-MTPA esters were prepared. The 1H-NMR spectrum of (S)-MTPA ester showed the upfield chemical shift for H2-2, H3-11, and H3-12 and downfield chemical shift for the H2-4 relative to the same groups in the alternate diastereomer prepared from (S)-(+)-MTPA-Cl, so that the C-3 position has R configuration (Fig. 2B). In addition, the 1H-NMR spectrum of (S)-MTPA ester showed the downfield chemical shift for H-10 and upfield chemical shift for H2-8, H2-7 compared with the same groups in other diastereomer obtained from (S)-(+)-MTPA-Cl, which also lead to determine the absolute configuration at C-9 was R11) (Fig. 2B). From the above, 1 was identified as (3R,9R)-5-megastigmen-3,9-diol-3-O-(6′-galloyl)-β-D-glucopyranoside named galloyl linarionoside A.
Table 1.
1H- and
13C-NMR Spectroscopic Data for Compound
1| Position | δH (J in Hz)a) | δCb) |
|---|
| 1 | | 38.9 |
| 2ax | 1.41 (m) | 47.7 |
| 2eq | 1.77 (br d, 12.5) |
| 3 | 3.93 (m) | 74.5 |
| 4ax | 1.99 (dd, 9.6,16.0) | 39.9 |
| 4eq | 2.26 (br dd, 4.8, 16.0) |
| 5 | | 125.0 |
| 6 | | 138.7 |
| 7a | 1.86 (td, 6.4, 11.2) | 25.6 |
| 7b | 2.14 (td, 6.4, 11.2) |
| 8a | 1.43 (m) | 40.7 |
| 8b | 1.45 (m) |
| 9 | 3.68 (sext, 6.4) | 69.3 |
| 10 | 1.15 (d, 6.4) | 23.3 |
| 11 | 0.88 (s) | 28.8 |
| 12 | 0.93 (s) | 30.2 |
| 13 | 1.59 (s) | 20.1 |
| Glc |
| 1′ | 4.42 (d, 7.6) | 103.1 |
| 2′ | 3.19 (t, 7.6) | 75.5 |
| 3′ | 3.38 (m) | 78.1 |
| 4′ | 3.34 (m) | 72.2 |
| 5′ | 3.58 (m) | 75.3 |
| 6′ | 4.48 (dd, 4.8, 11.2), 4.42 (m) | 65.1 |
| Galloyl |
| 1″ | | 121.5 |
| 2″ | 7.10 (s) | 110.4 |
| 3″ | | 146.7 |
| 4″ | | 139.9 |
| 5″ | | 146.7 |
| 6″ | 7.10 (s) | 110.4 |
| 7″ | | 168.4 |
a) 1H-NMR (CD3OD, 400 MHz, δ value) spectroscopic data. b) 13C-NMR (CD3OD, 100 MHz) spectroscopic data.

Fig. 2. Selected 1H–1H COSY and Key HMBC Correlations of Compound 1 (A) and Chemical Shift Difference for the (S)-MTPA Ester (1c) and (R)-MTPA Ester (1b) in ppm (δS–δR) (B)
The known compounds were identified as linarionoside A (2),12) 2,3-trans-3,4-trans-4,5-trans-2,5-bis-(4-hydroxyphenyl)-3,4-dimethyltetrahydrofuran (3),13) 3α,24-dihydroxyolean-12-en-27-oic acid (4),14) 3α-hydroxyolean-12-en-27-oic acid (5),15) β-amyrin (6),16) 3-oxolean-12-en-27-oic acid (7),15) isoquercitrin (8), astragalin (9), kaempferol-3-O-α-L-rhamnopyranosyl-(1→6)-β-D-glucopyranoside (10), rutin (11),8) quercetin-3-O-(6′-galloyl)-β-D-glucopyranoside (12),9) 1,2,3,4,6-penta-O-galloyl-β-D-glucopyranoside (13)17) and dihydromyricetin (14)18) on basis of spectroscopic analysis, chemical evidence and the literature data.
The cytotoxic effects of isolated compounds (1–14) were evaluated by 3-(4,5-dimethylthiazol-2-yl)-2,5-diphenyltetrazolium bromide (MTT) assay.19) These compounds did not affect the cell viabilities of RAW264.7 cells in either the present or absence of LPS, even at a dose of 30 µM after a period of 24 h (data not shown). In murine RAW264.7 macrophages, LPS stimulation alone can induce iNOS transcription and protein synthesis and subsequent NO production.20) Therefore, this cell system is an excellent model for evaluating topical agents and screening potential inhibitors of the pathways that induce iNOS and NO production. Due to the rapid half-life of NO in vivo, we used nitrite production as a biomarker of NO production in LPS-stimulated RAW264.7 cells. To investigate the effect of compounds 1–14 on NO production, the Griess assay was applied.19) RAW264.7 cells were stimulated with LPS in the presence or absence of 1–14 for 24 h. Nitrite levels in LPS-stimulated cells increased significantly compared to control. As shown in Table 2, compounds 4, 5, 6 and 7 showed potent inhibitory activity with IC50 values of 12.5, 9.5, 10.5 and 9.3 µM, respectively. Compound 13 displayed moderate inhibitory effect with IC50 value of 17.2 µM, but the others were inactive. In this experiment, celastrol, a positive inhibitor, significantly inhibited LPS-induced NO production with IC50 value of 1.0 µM.21–23)
Table 2. Inhibition of NO Production in Macrophage RAW264.7 Cells by Compounds
1–
14| Compound | IC50 (µM)a) |
|---|
| 1 | >30 |
| 2 | >30 |
| 3 | >30 |
| 4 | 12.5±3.0 |
| 5 | 9.5±2.0 |
| 6 | 10.5±1.8 |
| 7 | 9.3±2.4 |
| 8 | >30 |
| 9 | >30 |
| 10 | >30 |
| 11 | >30 |
| 12 | >30 |
| 13 | 17.2±2.8 |
| 14 | >30 |
| Celastrolb) | 1.0±0.1 |
a) The inhibitory effects are represented as the molar concentration (µM) giving 50% inhibition (IC50) relative to the vehicle control. These data represent the average values of three repeated experiments (mean±S.D.). b) Positive control for NO production.
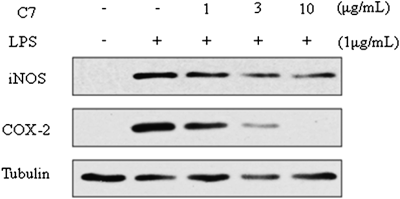
In a variety of inflammatory cells, including macrophages, COX-2 is induced by cytokines and other activators, such as LPS, resulting in the release of large amounts of PGE2 at inflammatory sites.3) Among the tested compounds, 7 was most effective on the LPS-induced production of NO in RAW264.7 cells. Therefore, Western blot was performed to determine the inhibitory effects of compound 7 on the modulation of iNOS and COX-2 expression. In unstimulated RAW264.7 cells, iNOS and COX-2 proteins were not detected, but LPS markedly upregulated their protein levels, and pre-treatment with 7 inhibited these up-regulations. Compound 7 (1–10 µg/mL) dose-dependently reduced the LPS-induced iNOS and COX-2 expressions, but did not change the α-tubulin expression. Particularly, the LPS-induced COX-2 was changed clearly as the concentration of compound 7 increased from 3 to 10 µg/mL (Fig. 3).
The translocation of nuclear factor-kappa B (NF-κB) to the nucleus is preceded by the phosphorylation, ubiquitination, and proteolytic degradation of inhibitor kappa B-alpha (IκB-α).24) We determined whether the inhibition of LPS-induced NF-κB activation by compound 7 was caused by inhibition of IκB-α degradation. Cells were exposed to LPS for various times. Cytoplasmic extracts were analyzed for the presence of IκB-α using Western blots. IκB-α was almost completely degraded in 15 min after stimulation with LPS and resynthesized in 30 min (Fig. 4A). We pretreated cells with difference concentrations of 7 (3–30 µg/mL) and then exposed them to LPS for 10 min. However, compound 7 could not significantly prevent LPS-induced degradation and resynthesis of IκB-α (Fig. 4B). Thus, this study could be combined suggesting that compound 7 produced anti-inflammatory activity through reducing inducible nitric oxide synthase and cyclooxygenase-2 proteins, not through IκB-α dependent nuclear factor-kappa B pathway.
Experimental
Materials and MethodsThe aerial parts of A. rossii were collected at Jeongbong-san, Kangwondo, Korea, in June 2007 and identified by Dr. Hyeong Kyu Lee. A voucher specimen (PB-1636) was deposited at the herbarium of the Korea Research Institute of Bioscience and Biotechnology, Korea. The aerial parts (3.0 kg) were extracted reflux with MeOH (5 L×3 times). After evaporation of the solvent under reduced pressure, the crude MeOH extract (290 g) was obtained and suspended in hot water and partitioned with n-hexane, CHCl3, EtOAc and BuOH, successively, to afford n-hexane- (39.5 g), CHCl3- (3.2 g), EtOAc- (53.8 g), BuOH- (67.2 g) soluble fractions, respectively. By the activity-guided fractionation, the CHCl3 soluble fraction (3.2 g) was chromatographed over a silica gel column (6×60 cm, 63–200 µm particle size, Merck) and eluted with n-hexane–EtOAc (20 : 1→1 : 1, each 1 L) yielded eight fractions (F1–F8). Subfraction F4 (430.0 mg) was subjected to a silica gel column (4×50 cm, 40–63 µm particle size, Merck), eluted with CHCl3–EtOAc (15 : 1→2 : 1, each 0.5 L) to obtain compounds 3 (3.4 mg) and 7 (50.0 mg). Subfraction F6 (280 mg) was applied to a silica gel column (3×40 cm, 40–63 µm particle size, Merck), eluted with CHCl3–EtOAc (25 : 1→5 : 1, each 0.5 L) to afford six subfractions (F6.1–F6.6). The subfraction F6.2 (55.6 mg) was chromatograped over a silica gel column (2×40 cm, 40–63 µm particle size) and eluted with CHCl3–MeOH (30 : 1→5 : 1, each 0.4 L) to obtain compounds 4 (7.0 mg) and 5 (7.2 mg). Compound 6 (7.1 mg) was crystallized from subfraction F6.4 (18 mg) with CHCl3–MeOH (10 : 1). The EtOAc-soluble fraction (53.8 g) was also subjected to a silica gel column (12×60 cm, 63–200 µm particle size), eluted with CHCl3–MeOH–H2O (9 : 1 : 0.1→1 : 1 : 0.02, each 2 L) to obtain nine subfractions (E1–E9). Subfraction E3 (3.5 g) was applied to RP-C18 silica gel column (6×60 cm, 40–63 µm particle size), eluted with MeOH–H2O (1 : 4→1 : 1) to yield ten subfractions (E3.1–E3.10). Subfraction E3.4 (72.0 mg) was applied to one more RP-C18 silica gel column (2×60 cm, 40–63 µm particle size) and eluted with ACN–H2O (1 : 8→2 : 3, each 1 L) to afford compounds 1 (15.0 mg) and 8 (25.0 mg). Subfraction E3.6 (85.0 mg) was purified by HPLC [eluting with MeOH–H2O (75 : 25→55 : 45) over 90 min; flow rate: 5 mL/min; UV detection at 210 nm; column COSMOSIL (20×250 mm, 5 µm)] to obtain compounds 9 (8.0 mg, tR=29.8 min), 10 (3.4 mg, tR=42.6 min) and 11 (7.1 mg, tR=51.3 min). Subfraction E8 (2.2 g) was subjected to RP-C18 silica gel column (6×60 cm, 40–63 µm particle size), eluted with ACN–H2O (1 : 5→2 : 3, each 1.2 L) to afford 8 subfractions (E8.1–E8.8). Subfraction E8.4 (65.0 mg) was applied to RP-C18 silica gel column (2×40 cm, 40–63 µm particle size) using MeOH–H2O (1 : 4→2 : 3, each 0.6 L) to obtain compounds 12 (20.0 mg) and 14 (10.8 mg). Compound 2 (30.0 mg) was crystallized from subfraction E8.6 (45.0 mg). Subfraction E8.5 (48.0 mg) was chromatogaphed over RP-C18 silica gel column (2×40 cm, 40–63 µm particle size), eluted with ACN–H2O (1 : 5→1 : 2, each 0.5 L) to afford compound 13 (32.0 mg).
Galloyl Linarionoside A (1): Amorphous powder; [α]D25 0 (c=0.1, MeOH); UV (MeOH) λmax (log ε) 277 (3.98), 216 (4.36); IR νmax (KBr) 3328, 2943, 2831, 2527, 2356, 1748, 1449, 1418, 1116, 1024 cm−1; HR-FAB-MS m/z 549.2316 [M+Na]+ (Calcd for C26H38O11Na, 549.2312). 1H- and 13C-NMR spectroscopic data, see Table 1.
Enzymatic Hydrolysis of 1Compound 1 (10.0 mg) was dissolved in AcOH–NaOAc buffer (pH 5.0, 5 mL) with naringinase (Sigma, EC 232-962-4, β-glucosidase activity: 69 units/g) (25.0 mg) and incubated at room temperature for 14 h. The crude reaction mixture was extracted with EtOAc (5 mL×3 times). The organic layer was dried under reduced pressure. The residue (5.1 mg) was applied to a RP-C18 silica gel column (2×20 cm, 40–63 µm particle size, Merck), eluted with acetone–H2O (2 : 3, 0.5 L) to yield 1a (3.2 mg).25)
Preparation of (R)- and (S)-MTPA Esters (1b, c) from 1aA solution of 1a (1.0 mg) in dry pyridine (50 µL) was reacted with 5 µL of (S)-(−)-MTPA-Cl and 2 mg of 4-DMAP at room temperature for 30 min. The reaction mixture was dried by N2 gas. The dried product was partitioned with CH2Cl2 and H2O. The organic layer was dried using Na2SO4 and concentrated under reduced pressure. The residue was purified by preparative TLC silica gel (0.25 mm thickness) developed with CH2Cl2, and the product was eluted with CH2Cl2–MeOH (10 : 1, 0.2 L) to furnish (R)-MTPA ester, 1b (1.3 mg). In a similar manner, 1a (1.7 mg) yielded (S)-MTPA ester (1c, 1.1 mg).26)
5-Megastigmen-3,9-di-(R)-MTPA Ester (1b): Colorless oil; 1H-NMR (CDCl3, 400 MHz) δH 1.571 (1H, m, Hax-2), 1.796 (1H, ddd, J=2, 3.6, 12 Hz, Heq-2), 5.228 (1H, m, H-3), 2.283 (1H, dd, J=6.4, 16.8 Hz, Heq-4), 2.114 (1H, m, Hax-4), 1.899 (1H, td, J=4.4, 12.4 Hz, H-7a), 2.051 (1H, m, H-7b), 1.617 (2H, m, H-8a, H-8b), 5.090 (1H, sext, J=5.6 Hz, H-9), 1.271 (3H, d, J=6.4 Hz, H-10), 1.045 (3H, s, H-11), 0.990 (3H, s, H-12), 1.520 (3H, s, H-13).
5-Megastigmen-3,9-di-(S)-MTPA Ester (1c): Colorless oil; 1H-NMR (CDCl3, 400 MHz) δH 1.521 (1H, m, Hax-2), 1.708 (1H, ddd, J=1.2, 3.2, 12 Hz, Heq-2), 5.207 (1H, m, H-3), 2.338 (1H, dd, J=5.6, 16.4 Hz, Heq-4), 2.128 (1H, m, Hax-4), 1.826 (1H, td, J=5.2, 16.1 Hz, H-7a), 1.982 (1H, m, H-7b), 1.582 (2H, m, H-8a, H-8b), 5.117 (1H, sext, J=6.0 Hz, H-9), 1.340 (3H, d, J=6.4 Hz, H-10), 1.000 (3H, s, H-11), 0.910 (3H, s, H-12), 1.470 (3H, s, H-13).
Cell CultureThe murine macrophage cell line (RAW264.7) was purchased from the Korean Cell Line Bank (KCLB, Seoul, Korea). These cells were cultured in Dulbecco’s modified Eagle’s medium (DMEM; GIBCO, Inc., NY, U.S.A.) supplemented with 100 U/mL of penicillin, 100 U/mL of streptomycin and 10% fetal bovine serum (FBS, GIBCO, Inc., NY, U.S.A.). The cells were incubated in an atmosphere of 5% CO2 at 37°C and were subcultured every 3 d.
Determination of NO Production and the Cell Viability AssayThe level of NO production was determined by measuring the amount of nitrite present in cell culture supernatants as described previously.19,23) Briefly, the RAW264.7 cells (1×10⁵ cells/well) were stimulated with or without 1 µg/mL of LPS (Sigma Chemical Co., St. Louis, MO, U.S.A.) for 24 h in the presence or absence of the test compounds (0.5−25 µM). The cell culture supernatant (100 µL) was then reacted with 100 µL of Griess reagent (1% sulfanilamide in 5% phosphoric acid and 0.1% naphtylethylenediamine dihydrochloride in distilled H2O). The absorbance at 540 nm was determined with a microplate reader (Molecular Devices, Emax, Sunnyvale, CA, U.S.A.), and the absorption coefficient was calibrated using a NaNO2 solution standard. The amount of TNF-α in the culture supernatant was measured using the enzyme-linked immunosorbent assay (ELISA) kit (R&D Systems, Minneapolis, MN, U.S.A.). Cell viability was measured with MTT-based colorimetric assay. For this experiment, celastrol was used as a positive control.
Immunoblot AnalysisProteins were extracted from cells in ice-cold lysis buffer (50 mM Tris–HCl, pH 7.5, 1% Nonidet P-40, 1 mM ethylenediamine tetraacetic acid (EDTA), 1 mM phenylmethyl sulfonyl fluoride, 1 µg/mL leupeptin, 1 mM sodium vanadate, 150 mM NaCl). Fifty micrograms of protein (for iNOS) per lane was separated by sodium dodecyl sulfate (SDS)-polyacrylamide gel electrophoresis (PAGE), and transferred to a polyvinylidene difluoride membrane (Millipore, Bedford, MA, U.S.A.). The membrane was blocked with 5% skim milk, and then incubated with the corresponding antibody. The antibody for iNOS was obtained from Santa Cruz Biotechnology (Santa Cruz, CA, U.S.A.). The antibody for α-tubulin was obtained from Sigma. Antibody for IκB-α was obtained from Cell Signaling Technology (Danvers, MA, U.S.A.). After binding of an appropriate secondary antibody coupled to horseradish peroxidase, proteins were visualized by enhanced chemiluminescence according to the instructions of the manufacturer (Amersham Pharmacia Biotec, Buckinghamshire, U.K.).23,27)

