Abstract
The purpose of this study was to develop a novel simulation program to accurately predict the maximum product temperature and the primary drying time in lyophilization using the predictive model for dry layer resistance, which is the resistance of dried cake against water vapor flow. Ten percent sucrose aqueous solution was selected as a model formulation. It was demonstrated that the deviations between the predicted and measured maximum product temperature were attributed to the error of dry layer resistance at a given drying condition, which was different from the measured dry layer resistance in a preliminary lyophilization run for the simulation program. However, when the predictive model of dry layer resistance was used for the simulation program, the model remarkably enhanced the accuracy of the simulation program to predict the maximum product temperature and primary drying time under various operating conditions. Furthermore, the primary drying condition required for minimized drying at a close collapse temperature was successfully discovered through one preliminary run. Therefore, it is expected that the developed simulation program is useful for designing the lyophilization cycle without a trial and error approach.
Lyophilization is widely employed in pharmaceutical industries to enhance the stability of drug products for parenteral injection. The lyophilization cycle mainly consists of three steps: freezing, primary drying, and secondary drying. Generally, the primary drying process is carried out through sublimation, and requires up to a few days. In order to maximize the sublimation rate in primary drying, it is important that the vial heat transfer rate is as high as possible, resulting in a minimized primary drying time and high product temperature. However, the maximum product temperature has to be kept below the collapse temperature, where a lyophilized cake loses macroscopic structure and collapses, to ensure the elegant appearance of the lyophilized cake and its stability. Hence, enormous efforts have been spent to minimize the primary drying time without the collapse of lyophilized cakes by adjusting the shelf temperature and chamber pressure in pharmaceutical development.
In order to minimize the trial and error experiments, the mathematical model for the prediction of the optimized product temperature is thought to be useful. The mathematical model expressed by heat and mass transfer has been investigated for the expression of the sublimation phenomenon by many researchers.1–5) In the heat and mass transfer model, two parameters, heat transfer coefficient and dry layer resistance, are important for estimating the product temperature during primary drying. The heat transfer coefficient for the estimation of the heat transfer rate depends on the lyophilizer and the glass vial container and its stopper, and is experimentally determined by a water sublimation test.6–8) The heat transfer coefficient obtained from a water sublimation test could be utilized to estimate the heat transfer rate for various lyophilized products unless the lyophilizer and container are changed. The dry layer resistance means the resistance of the dried cake against the water vapor flow generated from the interface of the sublimation of the frozen layer. One preliminary lyophilization run using a drug solution is carried out to determine the dry layer resistance of each formulation, because the dry layer resistance is dependent on the component and the concentration in the formulation.9,10) The heat transfer coefficient and dry layer resistance experimentally obtained by two preliminary lyophilization runs using pure water and a drug solution allows us to estimate the product temperature during primary drying at a given shelf temperature and chamber pressure.
In recent years, two simulation programs have been practically evaluated for their ability to predict the product temperature during primary drying. Passage/Freeze drying software of Technalysis Inc.11) and SCANPT program reported by Kuu et al.12) are based on the heat and mass transfer model, and are thought to be useful tools for predicting the maximum product temperature and primary drying time. Using the novel simulation program (Kyowa FD program, Kyowa Vacuum Engineering Co.), an attempt was also made to predict the product temperature in our previous study, while the large error, 2.7°C, between the predicted and the measured maximum product temperature was observed.13) This large error of the product temperature is not thought to be negligible, even considering the accuracy of temperature between T-type thermocouple and the recorder (generally no less than 0.5°C), when the optimized shelf temperature and the chamber pressure are investigated to control the product temperature below the collapse temperature and to minimize the primary drying time. This suggested that the variation of dry layer resistance depending on the heat transfer rate made it difficult to predict the product temperature during primary drying. Hence, the predictive model for the dry layer resistance was developed, and the dry layer resistance under various shelf temperatures and chamber pressures was successfully predicted from the measured dry layer resistance with a preliminary run. However, the impact of the predictive model for dry layer resistance on the simulation of the product temperature has not been investigated.
In this study, one of the purposes was to demonstrate the hypothesis that the mistaken dry layer resistance contributed to the inaccurate prediction for the maximum product temperature. For this purpose, a comparison study of the simulation program without and with the predictive model for dry layer resistance was conducted. In the comparison study, the prediction accuracy of maximum product temperature and primary drying time of 10 w/v% sucrose aqueous solutions under various conditions of shelf temperatures and chamber pressures was evaluated. Furthermore, another purpose was to develop the simulation program to optimize the shelf temperature and chamber pressure for primary drying. In order to evaluate the prediction accuracy of the simulation program, the optimized primary drying condition, which was set to be the maximum product temperature close to the collapse temperature and the minimized primary drying time was investigated.
Materials and Methods
Mathematics of Simulation Program for Primary DryingThe simulation program (Kyowa FD program, Kyowa Vacuum Engineering Co., Ltd.) was developed to mathematically predict the product temperature at the bottom-center of the glass vial during primary drying. The overall heat transfer rate around the glass vial is comprised of three types of heat transfer rates, these are 1) the shelf heat transfer rate from the shelf to the bottom of the glass vial, Qsh, 2) the conductive heat transfer rate from the tray flame to the side of the glass vial, Qt, and 3) the radiative heat transfer rate from the chamber wall to the top and side of the glass vial, Qr. The estimation of each heat transfer rates is shown in our previous study.13) From three types of heat transfer rates, the sublimation rate, dm/dt, can be calculated as a pseudo-steady state which defines the state of overall heat quantity which is spent for latent heat of sublimation.14)
 | (1) |
Where, ΔHs is the latent heat of sublimation. Qt is used for estimation of the heat transfer rate of an “edge vial,” which is placed on the peripheral position on a shelf and has direct contact with the stainless tray flame. Then, the pressure at the interface of sublimation, Pi, is calculated from Eq. 2.
 | (2) |
Where, Pc is the chamber pressure. Rppre. is the predicted dry layer resistance profile, calculated by the empirical formula of Eqs. 3 and 4.
 | (3) |
Where, Rp-maxpre. is the maximum value in the dry layer resistance profile. Pimeas. and dm/dtmeas. are determined in a preliminary run. dm/dtpre. is estimated at a given condition of shelf temperature and chamber pressure. These parameters are determined at the period where the maximum values of the predicted or the measured dry layer resistance was observed. Slope a is obtained from linear regression consisting of two values consisting of the pressure at the interface of sublimation and the sublimation rate of each edge and center vial calculated from the product temperature in a preliminary run. The predicted dry layer resistance profile, Rp-profilepre., is estimated by Eq. 4.
 | (4) |
Where, Rp-maxmeas. is the maximum value in the measured dry layer resistance profile, Rp-profilemeas., at a preliminary run. In Eq. 5, the temperature at the interface of sublimation, Ti, is converted from Pi.
 | (5) |
On the other hand, the frozen layer thickness, L, at any time can be calculated in Eq. 6.
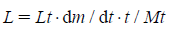 | (6) |
Where, Lt is the total frozen layer thickness, t is the elapsed time, and Mt is the total amount of sublimated water. The product temperature at the bottom-center of the vial, Tb, can be calculated by Eq. 7.
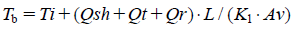 | (7) |
Where, K1 is the thermal conductivity of the frozen layer. Here, the thermal conductivity of ice was used for K1. Av is the area of sublimation per vial (calculated based on the inside diameter). The predicted maximum product temperature can be determined, when the maximum value in the predicted product temperature of the edge vial is observed during early and middle stages of primary drying. After sublimation, the product temperature, Tb, can be determined by Eq. 8.
 | (8) |
Where, Tb(t-1) is the product temperature at the previous point of elapsed time. C is the heat capacity of 1 vial, including glass vial, stopper, lyophilized cake, and unfrozen water in the lyophilized cake. The predicted primary drying time can be estimated, when the predicted product temperature of the center vial is unchanged within 0.5°C/h in the late stage of primary drying.
Measurement of Maximum Product Temperature and Primary Drying Time of 10 w/v% Sucrose Aqueous SolutionThe lyophilization test was performed using a laboratory scale lyophilizer (DFM-09A-S, ULVAC, Inc., shelf area: 0.3 m2). Five milliliter of the aqueous solution containing 10 w/v% sucrose (purchased from Merck) was filled into each ϕ20 mL vial (Transparent Type 1 glass vial, Japan Glass Industry Co., Ltd., 320 vials), and the filled vials were partially stoppered with rubber stoppers (Two leg 20 mm gray butyl rubber stoppers, Daikyo Seiko, Ltd.). The lyophilization was conducted as follows, 1) Freeze at −45°C, 2) annealing at −10°C, 3) re-freezing at −45°C, 4) primary drying at the target shelf temperature. The shelf temperature and chamber pressure were set at a range of −20 to 0°C and 5 to 15 Pa in six experiments. The product temperature profiles of thermocouples were recorded at two positions, which are the edge vial and the center vial located on the peripheral and center positions on the shelf. The maximum product temperature of the edge vial observed in the early and middle phase of primary drying were determined, and the primary drying time of the center vial was determined by the same criteria in Section 2.1.
Measurement for Collapse TemperatureThe collapse temperature of 10 w/v% sucrose aqueous solution was determined by freeze-dry microscopy (Lyostat 2, Biopharma Technology Ltd.). Aliquot of 1–2 µL of 10 w/v% sucrose aqueous solution was dropped at the stage of freeze-dry microscopy. The temperature of the stage was controlled as follows: 1) Freezing at −45°C, 2) Turn on the vacuum at 8 Pa, 3) Heating from −45°C to −27°C (1°C/min). The appearance of the dry layer and the setting temperature were monitored during the heating process. When the white spot in the dry layer was clearly observed, the setting temperature of 10 w/v% sucrose was determined as the collapse temperature.
Prediction of Maximum Product Temperature and Primary Drying Time of 10 w/v% SucroseThe shelf heat transfer coefficient, the dry layer resistance profile, and the parameters related to the lyophilizer, the vial, and the formulation were input to the simulation program. The prediction was carried out for the product temperature of each edge and center vial at various conditions of shelf temperatures (−20 to 0°C) and chamber pressures (5 to 15 Pa), according Section 2.1 without and with the predictive model for dry layer resistance of Eqs. 3 and 4. The optimized shelf temperature at 10 Pa of chamber pressure, where the predicted maximum product temperature was identical to the collapse temperature of 10 w/v% sucrose aqueous solution, was also predicted by the simulation program with the predictive model for dry layer resistance.
Results and Discussion
Determination of Shelf Heat Transfer Coefficient and Dry Layer ResistanceThe simulation program for predicting product temperature requires various parameters related to the lyophilizer, vial, and formulation. In particular, two parameters of shelf heat transfer coefficient and dry layer resistance are essential to predict the product temperature during primary drying.
The shelf heat transfer coefficient is necessary to estimate the heat transfer rate from the shelf to the bottom of the vial, and can be calculated with the mean separation distance between the glass vial and shelf (0.59 mm), which was determined by performing a water sublimation test according to the procedure in our previous study.13) For example, the shelf heat transfer coefficient was estimated to be 10.3 kcal/h·m2°C at 10 Pa of the chamber pressure. When the chamber pressure was changed, the shelf heat transfer coefficient was recalculated.
The dry layer resistance, defined as the resistance of the dried cake against the water vapor flow generated from the interface of sublimation, affects the product temperature during primary drying. The dry layer resistance of 10 w/v% sucrose solution of each edge and center vial as a function of dry layer thickness was mathematically determined from each product temperature profile measured at −20°C of shelf temperature and 10 Pa of chamber pressure in Fig. 1. The mathematical procedure to calculate dry layer resistance was referred to our previous study.13) As presented in Table 1, the dry layer resistance of the center vial increases as the dry layer thickness increases. On the other hand, the dry layer resistance of the edge vial shows the maximum values at 2.0 mm of the dry layer distance, and then the dry layer resistance did not increase and roughly remained constant from 2.0 to 5.0 mm of the dry layer thickness. Similar dry layer resistance profiles of sucrose formulation have been observed in other reports.9,15,16) Milton et al. initially reported about the mechanism where the small hole in the micro-structure of 5% lactose lyophilized cake was formed without shrinkage and the macro-collapse of the lyophilized cake, providing a non-linear dry layer resistance.17) The phenomenon was called “micro-collapse” as a small scale collapse of the lyophilized cake. On the other hand, the edge vial is positioned closer to the chamber wall and the tray flame than the center vial, and is exposed to additional heating from the chamber wall and the tray flame,18,19) resulting in the higher product temperature. We believe that the higher heat transfer rate allows the edge vial to form the dry layer of rough porous structure due to the micro-collapse, resulting in lower resistance of edge vial, compared to the center vial. Therefore, it is important to determine two types of dry layer resistance regarding the edge and center vials for the simulation of the product temperature for the highest product temperature of edge vial and the lowest product temperature of center vials on the shelf in the primary drying process.

Table 1. Dry Layer Resistance of Each Edge and Center Vial with the Dry Layer Thickness
| Dry layer thickness (×10−3 m) | Dry layer resistance (kPa·m2·s/kg)a) |
|---|
| Edge vial (S.D.) | Center vial (S.D.) |
|---|
| 0.5 | 76±13 | 46±4 |
| 1.0 | 107±7 | 68±8 |
| 2.0 | 121±5 | 100±10 |
| 3.0 | 117±7 | 125±11 |
| 4.0 | 105±6 | 136±10 |
| 5.0 | 98±4 | 144±12 |
S.D: Standard deviation. a) The dry layer resistance of each edge and center vial was converted from the product temperature profiles during primary drying (shelf temperature, −20°C; chamber pressure, 10 Pa).
The prediction of maximum product temperature of the edge vial and the primary drying time of the center vial are useful information for optimizing the shelf temperature and chamber pressure in primary drying, to provide a minimized primary drying time without the collapse of the lyophilized cake. An attempt was made to predict the maximum product temperature of the edge vial and the primary drying time of the center vial under various shelf temperatures (−20 to 0°C) and chamber pressures (5 to 15 Pa) using the simulation program without the predictive model for dry layer resistance. For the simulation, the dry layer resistance of each edge and center vial was used at −20°C of shelf temperature and 10 Pa of chamber pressure in a preliminary run.
The results show that the predicted primary drying time is similar to those measured under these experiments (Table 2). Overcashier et al. observed a similar phenomenon that the sublimation rate was less affected by the variation of dry layer resistance.9) With our calculations, the sublimation rate is governed by three kinds of heat transfer rates, which are mathematically calculated by the difference between the product temperature and the temperature of three kinds of materials (shelf, chamber wall, and tray flame) in the lyophilizer. In addition, the product temperature is often much lower than the temperature of the shelf, chamber wall, and tray flame due to the latent of sublimation. This large difference of temperature indicates that a little variation of product temperature does not impact remarkably on the heat transfer rate, and the prediction of sublimation rate is not really affected by the slight error in the product temperature.
Table 2. Comparison of the Predicted and the Measured Maximum Product Temperature and Primary Drying Time Using the Simulation Program with/without the Predictive Model for Dry Layer Resistance (
Rp-model)
| Shelf temperature (°C) | Chamber pressure (Pa) | Maximum product temperature of the edge vial (°C) | Primary drying time of the center vial (h) |
|---|
| Predicted without Rp-model | Predicted with Rp-model | Measured (S.D.) | Predicted without Rp-model | Predicted with Rp-model | Measured (S.D.) |
|---|
| −20 | 5 | −36.8 | −34.2 | −34.1±0.3 | 40.0 | 39.4 | 38.5±0.8 |
| −20 | 10 | −33.0 | −33.4 | −33.3±0.2 | 31.5 | 30.6 | 29.9±1.1 |
| −20 | 15 | −31.0 | −32.9 | −32.5±0.3 | 30.4 | 26.4 | 27.3±2.4 |
| −10 | 5 | −34.6 | −33.1 | −33.4±0.2 | 30.4 | 31.4 | 30.6±0.2 |
| 0 | 5 | −32.6 | −32.3 | −32.4±0.3 | 26.9 | 26.2 | 26.0±0.3 |
However, the errors of the maximum product temperature were observed under some conditions of shelf temperature and chamber pressure in Table 2. In particular, a 2.7°C difference between the prediction and the measurement was observed under the primary drying condition of −20°C and 5 Pa. This error of product temperature is not acceptable for optimizing the shelf temperature and chamber pressure, even when considering an error of the thermocouple. As found in Fig. 2, the cause of the error was revealed by the relationship between the maximum product temperature and the dry layer resistance under five conditions of shelf temperature and chamber pressure. It is obvious that the difference between the predicted and measured maximum product temperature of the edge vial (Tb-maxpre.–Tb-maxmeas.) is proportional to the difference of the measured maximum dry layer resistance at between −20°C and 10 Pa of the preliminary run and the given conditions (Rp−20°C, 10 Pa–Rpmeas.). In particular, the difference between the predicted and the measured maximum product temperature dried at −20°C and 5 Pa, where Rp−20°C, 5 Pa was most different from Rp−20°C, 10 Pa of the edge vial, was largest among the temperature differences of the five conditions.

Therefore, it was concluded that the error of dry layer resistance caused the obstacle to predict the maximum product temperature in primary drying. In other words, the prediction of dry layer resistance has a possibility to accurately predict the maximum product temperature in the simulation program. In the next section, the predictive model of dry layer resistance was applied for the simulation program.
Simulation Program with Predictive Model of Dry Layer ResistanceIn our previous study, we discovered the specific dry layer resistance, which is the modified dry layer resistance under the assumption that the chamber pressure is zero.13) The characteristic of specific dry layer resistance is to correlate well with the corresponding sublimation rate. Thus, the predictive model including the empirical formula of the sublimation rate and the specific dry layer resistance was developed to predict the dry layer resistance under various conditions of shelf temperature and chamber pressure from the dry layer resistance of both edge and center vials in a preliminary run. It is expected that the product temperature would be more accurately predicted by the modified simulation program with this predictive model for dry layer resistance.
In order to demonstrate our hypothesis, the product temperature profile of edge vials at the primary drying condition of −20°C and 5 Pa, where the largest error of predicted maximum product temperature of the edge vial was observed among the five conditions in the previous section, were predicted by the modified simulation program as a first simulation case. Simultaneously, the dry layer resistance under the same conditions was predicted by this predictive model in the simulation program. As shown in Fig. 3, the predicted product temperature profile of the edge vial was comparable to the measured temperature profiles. Moreover, it is apparent that the predicted product temperature profile of the edge vial are different from the predicted profile using the unmodified simulation program, which predicts the product temperature without the modification of the measured dry layer resistance under the primary drying condition of −20°C and 10 Pa in a preliminary run.

The comparison study between the predicted and the measured values for the maximum product temperature of the edge vial and the primary drying time of the center vial under various conditions of shelf temperatures (−20 to 0°C) and chamber pressures (5 to 15 Pa) were evaluated as well. As shown in Table 2, it was found that the maximum product temperature of the edge vial and the primary drying time of the center vial were almost the same as the measured values. In particular, the prediction accuracy of maximum product temperature of the edge vial was improved within the maximum error of temperature from 2.7 to 0.4°C. The deviations of maximum product temperature are close to the measurement accuracy of temperature between T-type thermocouple and the recorder (no less than 0.5°C). Hence, it is obvious that the predictive model for dry layer resistance in the modified simulation program contributes to the enhancement of accurate prediction for the maximum product temperature. It indicates that the prediction of maximum product temperature allows us to safely carry out the primary drying below the collapse temperature during this process.
Prediction of Optimized Primary Drying ConditionA higher heat transfer rate to the glass vial is important to maximize the sublimation rate, resulting in the minimized primary drying time. The maximum product temperature, however, should be controlled at no more than the collapse temperature, to avoid the collapse of the lyophilized cake by the excess heat transfer rate. The freeze dry microscopy study indicated that the onset of collapse of 10 w/v% sucrose aqueous solution was microscopically observed at −31.5°C of temperature, which is defined as the collapse temperature in this work. Thus, the results show that the maximum product temperature of the edge vial needs to be controlled below −31.5°C of the collapse temperature during primary drying.
The maximum product temperature and the primary drying time at various shelf temperatures (−20 to 0°C) and chamber pressures (5 to 15 Pa) were predicted by the modified simulation program. From these predicted data, the contour plots of the predicted maximum product temperature and the primary drying time on the shelf temperature and chamber pressure were drawn using JMP® software. As can be seen from Fig. 4, the optimized shelf temperature and chamber pressure in the contour plots can be easily discovered to control the maximum product temperature below the collapse temperature, −31.5°C, and to minimize the primary drying time. For example, the optimized shelf temperature at 10 Pa of the chamber pressure was predicted to be approximately −8°C at which the maximum product temperature is close to the collapse temperature, −31.5°C. The predicted maximum product temperature of the edge vial and the primary drying time of the center vial calculated by the modified simulation program were −31.6°C and 20.3 h, respectively. These predicted values were almost identical to −31.5±0.4°C and 19.3±0.3 h experimentally measured at the same shelf temperature and chamber pressure.

Conventionally, many lyophilization experiments have been required to optimize the shelf temperature and chamber pressure in pharmaceutical development. In this study, it was demonstrated that the modified simulation program could predict the optimized operating parameters of shelf temperature and chamber pressure using the predictive model for dry layer resistance. It is noteworthy that repeated lyophilization runs are not necessary for the modified simulation program, except two preliminary runs for the heat transfer coefficient and the dry layer resistance of both edge and center vials. Thus, this modified simulation program has great potential to design the lyophilization cycle without the trial and error approach.
Conclusion
In this study, it was demonstrated that the deviation of dry layer resistance caused the inaccuracy of the prediction for the maximum product temperature of the edge vial for 10 w/v% sucrose aqueous solution under various conditions of the shelf temperature and chamber pressure. These accurate predictions were achieved by the developed simulation program including the predictive model for the variable dry layer resistance, which is mathematically predicted using the measured dry layer resistance of both edge and center vials in one preliminary run. Furthermore, the developed simulation program successfully predicted the optimized conditions of the shelf temperature and chamber pressure for the primary drying stage, so that the product temperature was close but below the collapse temperature. Therefore, it is expected that the novel simulation program for optimization of the primary drying condition could save on cost and time for pharmaceutical development.
References
- 1) Pikal M. J., Roy M. L., Shah S., J. Pharm. Sci., 73, 1224–1237 (1984).
- 2) Nail S. L., J. Parenter. Drug Assoc., 34, 358–368 (1980).
- 3) Ho N. F., Roseman T. J., J. Pharm. Sci., 68, 1170–1174 (1979).
- 4) Jennings T. A., J. Parenter. Sci. Technol., 42, 118–121 (1988).
- 5) Kuu W. Y., Hardwick L. M., Akers M. J., Int. J. Pharm., 313, 99–113 (2006).
- 6) Rambhatla S., Tchessalov S., Pikal M. J., AAPS PharmSciTech, 7, E61 (2006).
- 7) Pikal M. J., J. Parenter. Sci. Technol., 39, 115–139 (1985).
- 8) Schneid S. C., Gieseler H., Kessler W. J., Pikal M. J., J. Pharm. Sci., 98, 3406–3418 (2009).
- 9) Overcashier D. E., Patapoff T. W., Hsu C. C., J. Pharm. Sci., 88, 688–695 (1999).
- 10) Pikal M. J., Shah S., Senior D., Lang J. E., J. Pharm. Sci., 72, 635–650 (1983).
- 11) Koganti V. R., Shalaev E. Y., Berry M. R., Osterberg T., Youssef M., Hiebert D. N., Kanka F. A., Nolan M., Barrett R., Scalzo G., Fitzpatrick G., Fitzgibbon N., Luthra S., Zhang L., AAPS PharmSciTech, 12, 854–861 (2011).
- 12) Kuu W. Y., Nail S. L., J. Pharm. Sci., 98, 3469–3482 (2009).
- 13) Kodama T., Sawada H., Hosomi H., Takeuchi M., Wakiyama N., Yonemochi E., Terada K., Int. J. Pharm., 452, 180–187 (2013).
- 14) Pikal M. J., Cardon S., Bhugra C., Jameel F., Rambhatla S., Mascarenhas W. J., Akay H. U., Pharm. Dev. Technol., 10, 17–32 (2005).
- 15) Johnson R. E., Oldroyd M. E., Ahmed S. S., Gieseler H., Lewis L. M., J. Pharm. Sci., 99, 2863–2873 (2010).
- 16) Parker A., Rigby-Singleton S., Perkins M., Bates D., Le Roux D., Roberts C. J., Madden-Smith C., Lewis L., Teagarden D. L., Johnson R. E., Ahmed S. S., J. Pharm. Sci., 99, 4616–4629 (2010).
- 17) Milton N., Pikal M. J., Roy M. L., Nail S. L., PDA J. Pharm. Sci. Technol., 51, 7–16 (1997).
- 18) Rambhatla S., Pikal M. J., AAPS PharmSciTech, 4, 22–31 (2003).
- 19) Gan K. H., Bruttini R., Crosser O. K., Liapis A. I., Int. J. Heat Mass Transf., 48, 1675–1687 (2005).