Abstract
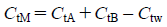
The purpose of this study was to predict the stability of octreotide in a mixed infusion containing sodium bisulfite (SBS). In aqueous solution the hydrolysis of octreotide was found to be accelerated by pH, and by increasing concentrations of SBS. Equations for the degradation rate constants (kobs) of pH and SBS were derived. The fractional rate constants were estimated by the nonlinear least-squares method (quasi-Newton method using the solver in Microsoft Excel) at 25°C. The activation energy (Ea) and frequency factor (A) were calculated using the Arrhenius equation. The pH of the mixed infusion was estimated using the pH characteristic (PHC) curve. From these results, an equation was derived giving the residual ratio (%) of octreotide at any time after mixing an infusion containing SBS at any temperature in the pH range 4.0–7.0. A high correlation was shown to exist between the estimated and determined residual ratios (%).
Octreotide acetate, chemical formula D-phenylalanyl-L-cysteinyl-L-phenylalanyl-D-tryptophyl-L-lysyl-L-threonyl-N-[(1R,2R)-2-hydroxy-1-(hydroxymethyl)propyl]-L-cysteine amide cyclic (2→7)-disulfide acetate (salt), is a long-acting octapeptide with pharmacologic actions mimicking those of the natural hormone somatostatin.1–3) The cyclic structure of octreotide (Fig. 1) seems to play an important role in determining its unique pharmacological activity.
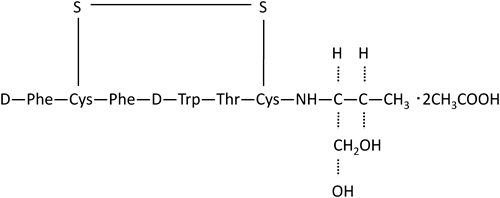
Fig. 1. Structure and Amino Acid Sequence of Octreotide
Octreotide is increasingly used to treat symptoms of sickness and vomiting in terminal care patients suffering from gastrointestinal ileus. It is also used, in combination with standard therapies, in the symptom management of inoperable bowel obstructions in terminal cancer patients.4–6) In Japan, octreotide is usually administered subcutaneously, but in the U.S. it is more often administered by deep subcutaneous (intrafat) or intravenous injection.3) The pharmacokinetics of octreotide are similar to those of many other agents administered continuously via intravenous or subcutaneous infusion,7) and similar changes in pharmacokinetics would be expected if octreotide were to be administered by continuous intravenous administration instead of sustained subcutaneous administration, i.e., without the need for special equipment (e.g., miniature pump).
We have been unable to find any reports describing the time-dependent stability of octreotide in amino acid infusions under different pH, temperature and ingredient such as sodium bisulfite. Especially, we have been unable to find reports evaluating such time-dependent stability of octreotide in amino acid infusions quantitatively.
Hanamura et al.8) report on the stability of octreotide in glucose and saline infusions, but its stability in amino acid infusion fluids was not investigated in detail. We have been unable to find any reports describing the stability of octreotide in amino acid infusions. Sodium bisulfite (SBS), which is used as a stabilizer in injectable preparations, is known to degrade various drugs, including thiamine,9) epinephrine,10) gabexate mesilate,11) nafamostat mesilate,12) urokinase,13) morphine,14) fluorouracil15) and imipenem.16) However, there are no reports of detailed kinetic studies on the degradation of octreotide in the presence of SBS.
Prediction of the stability of a drug in a mixed intravenous infusion is important to ensure accurate and safe drug administration. Generally, the stability of a drug in a mixed infusion can be predicted from its pH profile and the Arrhenius equation of its degradation rate constants, as long as the temperature and pH of the test solution are known.
In this study we set out to develop a method for predicting the pH of mixed infusions, in order to evaluate the compatibility of the components of the mixed infusion. Employing the pH characteristic (PHC) curve, a kind of pH titration curve,17) Hirouchi et al.18) reported a method for pH estimation based on computer simulation. However, the theoretical equations described by Hirouchi et al. were derived from model preparations for injection and did not take into account the influence of dilution with titrant. The PHC curve of a mixed infusion cannot therefore be fitted to the equations of Hirouchi et al., but must be derived from observed values, a painstaking and time-consuming exercise. In the present study, a simple, theoretical, pH estimation method for mixed infusions has been developed, using a fitted PHC curve and curve simulation using Microsoft Excel.
In addition, we re-examined the degradation of octreotide due to catalytic hydrolysis by SBS. From our results, we derived an equation for predicting the residual ratio (%) of octreotide at any time after mixing, on the basis of the simulated pH of the mixed infusion using the PHC curve, SBS concentrations, and the temperature.
Experimental
MaterialsOctreotide was supplied by Wako Pure Chemical Industries, Ltd., Osaka, Japan. SBS and other reagents were special grade commercial products. As buffer solutions, 0.05 m acetate buffer (pH 4.0–5.0) and 0.05 m phosphate buffer (pH 6.0–7.0) were adjusted to an ionic strength of 0.15 with sodium chloride. Sandostatin® for subcutaneous (s.c.) injection (Novartis Pharmaceuticals Co., Ltd., Tokyo, Japan), BFLUID® Injection, AMINOFLUID® Injection (Otsuka Pharmaceutical Factory, Inc., Tokushima, Japan) and AMIGRAND® and AMICALIQ® (Terumo Co., Ltd., Tokyo, Japan) were used as injectable preparations.
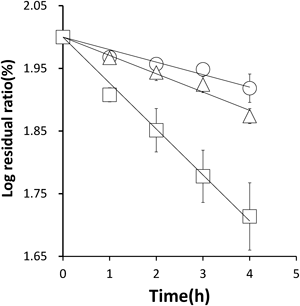
Determination of OctreotideOctreotide concentration was measured by high-performance liquid chromatography (HPLC). Octreotide concentrations were determined 0, 1, 2, 3 and 4 h after mixing with SBS. Each degradation rate constant (kobs) was calculated from the slope of the relationship between the log residual ratio of octreotide (%) and time after mixing. Data of log residual ratio (%) of octreotide at pH 7.0 in Fig. 4 was shown as the mean±S.E. (n=3). Data in Figs. 1–3 and Figs. 5–8 was shown as the mean (n=3).
EquipmentA Shimadzu LC-10AT VP high-performance liquid chromatograph, a Shimadzu SPD-10A VP UV-VIS detector, and a Shimadzu C-R7A plus chromatopack were used.
Measurement Condition8,19)A CAPCELL PAK C18 HPLC packed column type MG 5 µm (4.6 mm I.D.×150 mm); flow rate 1.5 mL/min; column oven set at 40°C; injection volume 200 µL; detection wavelength 215 nm. The mobile phase consisted of deionized water containing 1% trifluoroacetic acid (TFA) and acetonitrile (75 : 25).
Estimation of the pH of the Mixed InfusionObserved values from pH titration were used to plot the PHC curve of the mixed infusion. Based on the general equation for PHC curves, the PHC curve of each preparation was fitted from the observed values, from which the pH of the mixed infusion could be estimated.
pH TitrationVarious commercial injections were diluted to 500 mL with distilled water and titrated against 0.5 M hydrochloric acid and sodium hydroxide. Similarly, 500 mL aliquots of various commercial infusions were titrated against 0.5 M hydrochloric acid and sodium hydroxide.
Fitting the PHC Curve of the Injection PreparationInjectable drugs are generally classified as weak acids, weak bases or salts. Taking a preparation of a weak acid, concentration Ca1, the ionization of the weak acid may be represented as: HA→H++A−, where HA is the non-ionized acid, A− is the ionized acid and H+ is hydrogen ion. Applying the laws of mass action, material balance and charge balance to the equilibrium of this weak acid, the general equation of the PHC curve for the preparation can be expressed as in Eq. 1.
 | (1) |
Similarly, taking a preparation containing two weak acids with concentrations Ca1 and Ca2, the general equation for the preparation can be expressed as in Eq. 2. If a preparation contains n kinds of weak acids, the general equation of the PHC curve for the preparation can be expressed as in Eq. 3.
 | (2) |
 | (3) |
In order to improve solubility, preparations of weak bases often contain a strong acid as an excipient. Therefore, the preparation of the weak base can be assumed to be equivalent to a preparation of a conjugated weak acid. Accordingly, the general equation of the PHC curve for the preparation of a weak base can be expressed as in Eq. 1, and the PHC curve of the preparation of n kinds of weak bases can be represented as in Eq. 3.
The general equation of the PHC curve for injectable preparations can therefore, for practical purposes, be represented as Eqs. 1, 2 or 3. The influence of dilution with titrants can be corrected for by Eqs. 4–6.
 | (4) |
 | (5) |
 | (6) |
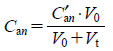
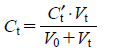
where Ca1, Ca2, Ca3⋯Can are the concentrations of weak acids 1, 2, 3⋯n in the sample solution; K1, K2, K3⋯Kn are the dissociation constants of the weak acids 1, 2, 3⋯n, respectively; C is the concentration of the strong acid (represented as a positive value) or the base (negative value) present as an excipient in the sample solution; Ct is the concentration of HCl (represented as a positive value) or NaOH (negative value), added as titrant to the sample solution; C′an is the initial concentration of the weak acid plus the strong acid (positive value) or base (negative value) in the sample solution, respectively; C′t is the concentration of HCl or NaOH added to the sample solution as titrant; V0 is the initial volume of the titration sample (500 mL); Vt is the volume of titrant added to the sample; [H+] is the hydrogen ion concentration; and Kw is the ion product of water. For practical purposes, [H+] and Kw at 25°C were regarded as 10−pHobs and 1.0×10⁻¹⁴, respectively.
The parameters of the general equations for the PHC curve (i.e., concentrations and pKs of weak acids and concentrations of strong acid or base) were fitted with some of the observed values. The parameters for the PHC curve were then obtained by solving the simultaneous equation Eq. 2. Next, the parameters other than pK were fitted by the nonlinear least-squares method (simplex method). The PHC curves simulated by these parameters and the observed titration values were drawn graphically. If the PHC curve only partially fitted, the parameters of the PHC curve were modified by the simultaneous equation Eq. 1 and the simplex methods.
Simulation of the PHC Curve of Mixed InfusionsThe effect of dilution was an important factor when the parameters of the PHC curve were fitted to the titration data. Nevertheless, once these parameters had been obtained, the PHC curves of the preparations could be treated simply according to Eqs. 1, 2, or 3, without Eqs. 4–6. Therefore, assuming the general equations of the PHC curves for an injection, an infusion, a mixed infusion of these preparations and water, to be Eqs. 7, 8, 9 and 10, respectively, the relationship Eq. 9=Eq. 7+Eq. 8–Eq. 10 held at a constant ion concentration. Each of the terms except CtA, CtB, Ctw and CtM could then be eliminated from Eqs 7–10 at a constant hydrogen ion concentration, to obtain Eq. 11. Since each PHC curve represents the relation between the pH and the volume of the titrants (i.e., Ctn), the PHC curves of mixed infusions could be simulated by applying Eq. 11 at all pHs. If n kinds of preparations were mixed, the PHC curve of the mixed infusion could be simulated from the PHC curves of n−1 kinds of preparations and another additive injection.
 | (7) |
 | (8) |
 | (9) |
 | (10) |
 | (11) |
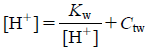
The influence of dilution with additional injection components is not taken into account in Eq. 11. If the infusion volume of a mixed infusion is increased, the PHC curves of the mixed infusion must be corrected by Eq. 12. This equation was obtained following the same process as for Eq. 11.
 | (12) |
where r is the concentration ratio of the initial infusion volume (500 mL): final (mixed) infusion volume, CtC is the corrected concentration of HCl or NaOH (added as the titrant) in the mixed infusion at a constant pH, Ct is the concentration of HCl or NaOH in a 500-mL aliquot of the mixed infusion at the same pH, and Ctw is the concentration of HCl or NaOH in a 500-mL aliquot of distilled water at the same pH. At Ct and Ctw, the influence of dilution with additive injections was omitted.
Simulation of the PHC Curve of a Mixed InfusionAccording to Eqs. 11 and 12, the PHC curve of the mixed infusion can be simulated from the PHC curves of each constituent preparation.
Estimated pH of a Mixed InfusionThe pHs of the injections (diluted to 500 mL with distilled water) or infusions are represented by the pHs at the origin of the PHC curve of the preparations. The estimated pH of the mixed infusion obtained is thus the pH at the origin of the simulated PHC curve.
Kinetic ProceduresThe stability of the octreotide solution (0.6 µg/mL) buffered at pH 4.0–7.0 in the presence of SBS (0, 0.125 and 0.25 mM), and of Sandostatin® for s.c. injection 300 µg in 500 mL of BFLUID® Injection, AMINOFLUID® Injection, AMIGRAND® and AMICALIQ®, were examined at 4, 25 and 40°C.
Results and Discussion
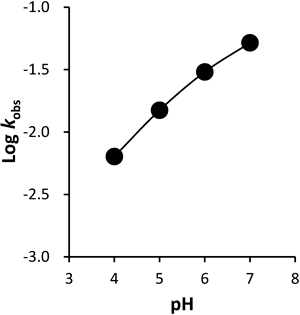
Factors Affecting the Stability of Octreotide. Degradation of Octreotide at pH 4.0–7.0The degradation of octreotide, 0.6 µg/mL, was studied at 25°C. The pH profile of octreotide degradation in the pH range 4.0–7.0 is shown in Fig. 2, where the rate constants are expressed on a logarithmic scale. It was concluded that specific hydroxide-ion-catalyzed degradation occurred at pH 4.0–7.0.
As the data plot in Fig. 2 seemed to display specific acid-base catalysis kinetics, Eq. 13 was used as the model kinetic equation for the effect of pH on k0.
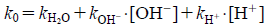 | (13) |
Where kH+ and kOH− are the second order rate constants for the hydrogen-ion-catalyzed degradation and the hydroxide-ion-catalyzed degradation reaction, respectively, and kH2O is the first order rate constant for the spontaneous water-catalyzed degradation reaction.
The residual octreotide concentration determined by HPLC and the [H+] and [OH−] calculated from pH at 25°C, were assigned to Eq. 13. The fractional rate constants, kH2O, kOH− and kH+ were estimated by the nonlinear least-squares method (quasi-Newton method using the solver in Microsoft Excel) and determined to be: kH2O, 1.33×10⁻² h−1; kOH− 4.54×10⁵ M−1 h−1 and KH+, 0 M−1 h−1.
The influence of temperature was also investigated. The Arrhenius equation (Eq. 14) shows the relationship between the degradation rate constant and the absolute temperature.
 | (14) |
where kobs is the degradation rate constant, Ea is the activation energy, R is the gas constant (1.987 cal mol−1), T is absolute temperature (K), and A is the frequency factor. As shown in Fig. 3, Arrhenius plots revealed good linearity in the range pH 4.0–7.0, with Ea values for octreotide of 6.13 kcal/mol (pH 4.0), 5.12 kcal/mol (pH 5.0), 6.70 kcal/mol (pH 6.0) and 1.77 kcal/mol (pH 7.0).
Degradation Rate of Octreotide in the Presence of SBSSBS, present as a stabilizer in injectable preparations, is known to degrade octreotide. However, the mechanism by which the SBS concentration affects this degradation has not yet been elucidated. Therefore, kinetic experiments were performed, and the residual octreotide concentration measured at various time points by HPLC. The degradation of octreotide, at an initial concentration of 0.6 µg/mL, by SBS at various concentrations was evaluated at 25°C and pH 4.0–7.0. The degradation rate constant of octreotide in the presence of SBS (kobs) was measured at 25°C. A linear relationship was observed between time and log residual ratio (%) at pH 7.0 (Fig. 4), indicating that the degradation of octreotide follows pseudo-first-order kinetics. This was also the case at other pHs. The apparent first order rate constants were obtained from the slopes of the semi-log plots. The slope of the line increased with increasing SBS concentration.
The rate constant for the catalytic hydrolysis of octreotide by SBS (kSBS) is obtained from Eq. 15.
 | (15) |
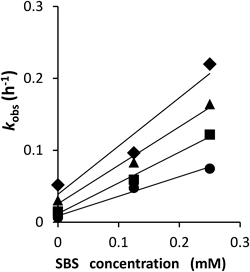
where kobs is the pseudo-first-order reaction rate constant, t is time after mixing, and r is the residual ratio (%). Typical plots for SBS concentration versus degradation rate constants of octreotide (pH 4.0, 25°C) yielded a straight line, as shown in Fig. 5. The degradation rate of octreotide was proportional to the total concentration of SBS ([SBS]total). Therefore, the rate constant of octreotide in the presence of SBS (kobs) can be represented by Eq. 16.
 | (16) |
where SBS concentration ([SBS]total) is represented by Eq. 17.
 | (17) |
Based on the dissociation constant of SBS at 25°C (100 kPa), kSBS1=1.72×10⁻² (pKSBS1=1.8) and kSBS2=6.24×10⁻⁸ (pKSBS2=7.2).16) SBS in this pH range (pH 4.0–7.0) was considered to be present as bisulfate ions (HSO3−) and sulfite ions (SO32−). kSBS×[SBS]total can therefore be represented as Eq. 18:
 | (18) |
and the dissociation constants of SBS (KSBS1, KSBS2) can be represented by Eqs. 19 and 20.
 | (19) |
 | (20) |
From Eqs. 16–20, kSBS can be represented as shown in Eq. 21.
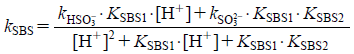 | (21) |
where kHSO3− is the second order degradation constant of HSO3−, and kSO32− is the second order degradation constant of SO32−. The fractional rate constants, kHSO3− and kSO32− were estimated by nonlinear least-squares method (quasi-Newton method using solver in Microsoft Excel), and values of kHSO3− (398.4 M−1 h−1) and kSO32− (1093.5 M−1 h−1) were obtained. These results show that the accelerating effect of sulfite ions on the hydrolysis of octreotide was four times greater than that of bisulfate ions at pH 4.0–7.0 and 25°C.
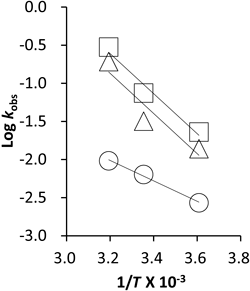
The influence of temperature on the degradation of octreotide by SBS was also investigated. As shown in Fig. 6, Arrhenius plots revealed good linearity between SBS concentrations of 0, 0.125 and 0.25 mM at pH 4.0, and the values obtained for the Ea) of octreotide, 6.13 kcal/mol, 12.01 kcal/mol, and 12.33 kcal/mol, respectively.
pH Estimation Method for a Mixed InfusionAfter mixing Sandostatin® for s.c. injection 300 µg in 500 mL of BFLUID® Injection, AMINOFLUID® Injection, AMIGRAND® and AMICALIQ®, the pH was estimated at 25°C using the PHC curve. Figure 7 shows the correlation between the estimated and determined pH values in the mixed infusion (y=1.0098x, r2=0.9832). The pH of each mixed infusion could be estimated correctly using the PHC curve.
Stability Prediction of Octreotide in Mixed InfusionsFrom the above results, the degradation rate constant of octreotide after mixture with an infusion containing SBS at pH 4.0–7.0, can be represented by Eq. 22.
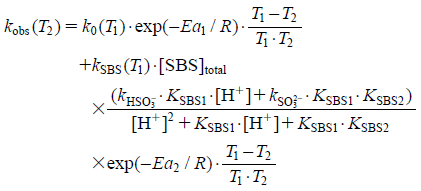 | (22) |
where Ea1 is the activation energy in the presence of the acid-base catalytic effect, Ea2 is the activation energy in the presence of SBS; kobs at any temperature (T2) can be calculated if 298 K (25°C) is assigned to T1 and the derived concentrations and constants at 298 K (25°C) and activation energy values (Ea1 to Ea2) are assigned to Eq. 22. The octreotide residual ratio (%) is represented by Eq. 23:
 | (23) |
From Eqs. 22 and 23, the octreotide residual ratio (%) can be predicted at any time after mixing into an infusion containing SBS at pH 4.0–7.0.
The octreotide product used in the clinical field is Sandostatin® for s.c. injection. SBS is reported to increase the hydrolysis of β-lactam rings and esters. Consequently, we examined the degradation of octreotide due to catalytic hydrolysis by SBS at different pHs. The correlation between the estimated and determined residual ratios (%) of octreotide in Sandostatin® for s.c. injection 0, 1, 2, 3 and 4 h after mixing with BFLUID® Injection, AMINOFLUID® Injection, AMIGRAND® and AMICALIQ® at 4, 25 and 40°C (y=1.0098x, r2=0.9832) is shown in Fig. 8. The high correlation correlation q2 (0.983), shows that there is a high correlation between the estimated and determined residual ratios (%) of octreotide in the drug combinations which might be encountered in clinical use. When we evaluated the relationship among simultaneous injection data on fixed temperature, the high correlations were also obtained at 4°C (y=1.0143x, r2=0.9825, q2=0.982), 25°C (y=1.0142x, r2=0.975, q2=0.9746) and 40°C (y=0.9971x, r2=0.9861, q2=0.986), respectively (data not shown as figure). These results confirm that an equation capable of predicting the stability of octreotide, at any time and at any temperature after mixing with an infusion containing SBS at pH 4.0–7.0 has been derived in this study.

In the present study, the concentrations of SBS was a critical factor in the degradation of octreotide. Asahara et al.20) reported that insulin was easily degraded by disulphide bond cleavage in the presence of SBS. Although octreotide also contains a disulfide bond, Tanabe et al.21) reported that degradation of octreotide was mainly due to hydrolysis not to cleavage of the disulphide bond in the molecule. Our results confirm this conclusion and show that octreotide seems to be easily hydrolysed.
Conclusion
The key factors influencing the stability of octreotide in a mixed infusion were found to be pH and SBS concentration. Equations describing the degradation rate constants (kobs) for pH and SBS have been derived, and the Ea and A calculated using the Arrhenius equation. The pH of the mixed infusion could be estimated using the PHC curve. Finally, an equation has been derived giving the residual ratio (%) of octreotide at any time after mixing any infusion at any temperature at pH 4.0–7.0. A high correlation was shown between the estimated and the determined values for residual ratio (%).
References
- 1) Novartis Pharmaceuticals Co., Ltd., 2009, “Sandostatin® for s.c. injection: Prescribing Information,”: ‹http://product.novartis.co.jp/sas/pi/pi_sas.pdf›, cited 24 Aug. 2013
- 2) Novartis Pharmaceuticals Co., Ltd., 2009, “Sandostatin® for s.c. injection: Interview Form,”: ‹http://product.novartis.co.jp/sas/if/if_sas.pdf›, cited 24 Aug. 2013
- 3) Novartis Pharmaceuticals Co., Ltd., 2013, “Sandostatin® for s.c. injection: Sandostatin® Prescribing Information,”: ‹http://www.pharma.us.novartis.com/cs/www.pharma.us.novartis.com/product/pi/pdf/sandostatin_inj.pdf›, cited 24 Aug. 2013
- 4) Tanimura K., Onda S., Mitsunobu M., Gan To Kagaku Ryoho, 37, 1991–1993 (2010).
- 5) Shima Y., Ohtsu A., Shirao K., Sasaki Y., Jpn. J. Clin. Oncol., 38, 354–359 (2008).
- 6) Japanese Society for Palliative Medicine, Clinical Guidelines for Gastrointestinal Symptoms in Cancer Patients, Kinbara, Tokyo, pp. 45–51, 2011.
- 7) Kutz K., Nuesch E., Rosenthaler J., Scand. J. Gastroenterol. Suppl., 119, 65–72 (1986).
- 8) Hanamura M., Sasaki H., Ooi K., Sawabe K., J. Jpn. Soc. Hosp. Pharm., 46, 1501–1504 (2010).
- 9) Williams R. R., Waterman R. E., Keresztesy J. C., Buckman E. R., J. Am. Chem. Soc., 57, 536–537 (1935).
- 10) Schroeter L. C., Higuchi T., Schler E. E., J. Am. Pharm. Assoc., 47, 723–728 (1958).
- 11) Asahara K., Yamada H., Yoshida S., Hirose S., Chem. Pharm. Bull., 37, 1595–1599 (1989).
- 12) Asahara K., Yamada H., Yoshida S., Hirose S., Chem. Pharm. Bull., 38, 492–497 (1990).
- 13) Asahara K., Yamada H., Yoshida S., Hirose S., Chem. Pharm. Bull., 38, 1675–1679 (1990).
- 14) Yeh S. Y., Lach J. L., J. Pharm. Sci., 60, 793–794 (1971).
- 15) Rork G. S., Pitman I. H., J. Pharm. Sci., 64, 216–220 (1975).
- 16) Yoshida M., Takasu Y., Shimizu K., Asahara K., Uchida T., Chem. Pharm. Bull., 61, 1–7 (2013).
- 17) Asahara K., Yamada H., Byouin Yakugaku, 9, 431–440 (1983).
- 18) Hirouchi Y., Hirouchi S., Matsui J., Yakuzaigaku, 45, 312 (1985).
- 19) Na D. H., Deluca P. P., Pharm. Res., 22, 736–742 (2005).
- 20) Asahara K., Yamada H., Yoshida S., Hirose S., Chem. Pharm. Bull., 39, 2662–2666 (1991).
- 21) Tanabe K., Ohkubo J., Ikezaki T., Kitayama S., Tsuneda Y., Nitta A., Imamura L., To H., Shimada M., Murakami N., Kitazawa H., Palliative Care Res., 8, 177–183 (2013).


 ), AMINOFLUID® Injection (
 ), AMIGRAND® (
 ) and AMICALIQ® (
 ) at 4, 25 and 40°C
 BFLUID® Injection at 25°C,
  AMINOFLUID® Injection at 25°C
  AMIGRAND® at 25°C and
  AMICALIQ® at 25°C ■ BFLUID® Injection at 40°C, ● AMINOFLUID® Injection at 40°C ▲ AMIGRAND® at 40°C and ◆ AMICALIQ® at 40°C