Regular Articles
Assessment of Blending Ratio of Powdered Medicine Mixtures by Image Analysis
2014 年 62 巻 4 号 p. 322-327
詳細
2014 年 62 巻 4 号 p. 322-327
In the dispensing process, powdered medicines are often blended with diluents or different kinds of powder. With blending, the mass percent of the medicine in the mixture is unknown until the active pharmaceutical ingredient is determined with techniques such as spectroscopy and chromatography. However, pharmacists need to confirm the exact blending ratio of the dispensing mixture in pharmacies. We aimed to develop a precise and concise method to measure the mass percent of powdered medicine mixtures without an expensive analytical apparatus. Digital photographs of three kinds of mixture of lactose powder, as diluents, with Adona®, Anginal®, or Asverin® powder were taken with a microscope at a 30× magnification. Thereafter, the mass percent was calculated from digital images of the mixture using calibrated color information in the YCbCr color space. A linear regression, between the mass percent and color difference signal, Cb, value was obtained from 10 to 90% of the medicines (r2=0.9806–9993) in all systems. The intra-day accuracy and precision were 0.67–12% (relative error) and <5% (relative standard deviation), respectively. Moreover, the mass percent measured using image analysis was consistent with the concentration of the active pharmaceutical ingredient determined spectrophotometrically. This effective image analysis method enables pharmacists to nondestructively ensure the exact mass percent of the medicine in the dispensing mixture in pharmacies.
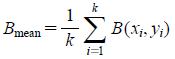
In a pharmacy, blending powdered medicines is conducted during the procedure of dispensing powdered medicines. In this process, many kinds of medicines are mixed with diluents or different powders at various blending ratios. Pharmacists check the dispensing mixtures before giving them to patients. At that time, they check the total mass of the dispensing mixtures by measuring with a balance. The mass percent of the individual medicines in the dispensing mixtures, however, is checked only on receipt due to a lack of convenient measuring methods which are practicable in pharmacies. Thus, it is important to devise measurement methods for pharmacists to ensure the exact mass percent of medicine in powdered mixtures in the dispensing procedure. From this point of view, we aimed to develop a nondestructive and concise method to assess the mass percent in powdered medicine mixtures using image analysis.
Recently, digital images are easily obtained owing to progress in electronic devices, such as digital compact cameras as well as microscopes. Figure 1 displays the handy microscope used in this study.
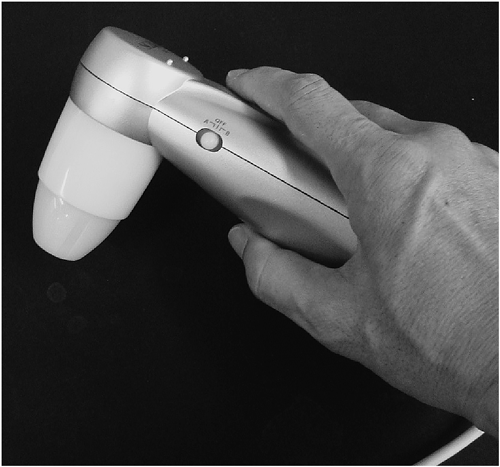
The microscope connects to a personal computer with a universal serial bus (USB) connection cable, and is powered from the USB. Moreover, digital image processing has become commonplace, and can be performed on a personal computer. In this study, ImageJ software was used for image analysis and processing. ImageJ is a Java based software program available as freeware for download from the ImageJ homepage (National Institute of Health, U.S.A.).1) There are available plugins and abundant online help.2) One of the great aspects of about the software is that it works with all operating systems: MacOS, Linux, and Windows. ImageJ incorporates a whole host of features, such as the ability to open several types of files (TIFF, JPEG, BMP), adjustable image display, image enhancements, measuring, histograms, calibration, editing, and color processing. There is also the ability to create macros to customize functions and speed up data analysis. Therefore, we were able to capture digital images of powdered medicine mixtures using the microscope, and then analyze the images with ImageJ to obtain color information.
At the start of this study, we focused on colored medicines because color variation is indicative of the blending degree of powdered mixtures.3) Thus, we examined two kinds of color spaces, namely RGB (Red-Green-Blue) color space and YCbCr color space.
RGB color space is the most commonly used color space in digital images.4) It encodes colors as an additive combination of three primary colors: red (R), green (G), and blue (B). RGB color space is often visualized as a three-dimensional cube where R, G, and B are the three perpendicular axes with red, green, and blue at the corners on each axis. Black is at the origin. White is at the opposite end of the cube. The gray scale follows the line from black to white. For example, in a 24-bit color graphics system with 8-bits per color channel, red is 255, 0, 0, and on the color cube, it is 1, 0, 0.
YCbCr color space has been defined in response to increasing demands for digital algorithms in handling video information, and has since become a widely used model in digital video and digital photography systems.5) It belongs to the family of television transmission color spaces for National Television System Committee (NTSC) systems. YCbCr color space is commonly used in image processing as it separates the luminance, in Y component, from the chrominance described through Cb and Cr components. Several definitions of this transformation exist. In this study, the luminance component Y is constructed as a weighted sum of R, G, and B components, and the blue-difference chroma component Cb and red-difference chroma component Cr are obtained by subtracting Y from B and R components, respectively, as follows:
 |
YCbCr is one of two primary color spaces used to represent digital component video (the other is RGB color space).
The difference between the color spaces YCbCr and RGB is that YCbCr color space represents color as brightness and two color difference signals, while RGB color space represents color as red, green, and blue. The reason for selecting the YCbCr color space in this study is less reflection from the luminance information obtained from images. Accordingly, we have examined color difference signals, Cb and Cr, in the YCbCr color space for indicators of the blending uniformity.3) However, the YCbCr color space has never been applied to assess the blending ratio of dispensing mixtures.
The aim of present study was to analyze the correlation between the mass percent and color difference signals, Cb and Cr, of the mixtures and establish a concise method for determining the mass percent in the blended powder medicines without an expensive apparatus.
Adona® powder 10% (carbazochrome sodium sulfonate hydrate, Mitsubishi Tanabe Pharma Co.), Anginal® powder 12.5% (dipyridamole, Choseido Pharmaceutical Co., Ltd.), and Asverin® powder 10% (tipepidinehibenzate, Mitsubishi Tanabe Pharma Co.) were used as model colored powders. We selected these medicines from the top of an alphabetical list of powdered medicines with different colors as shown in Fig. 2.
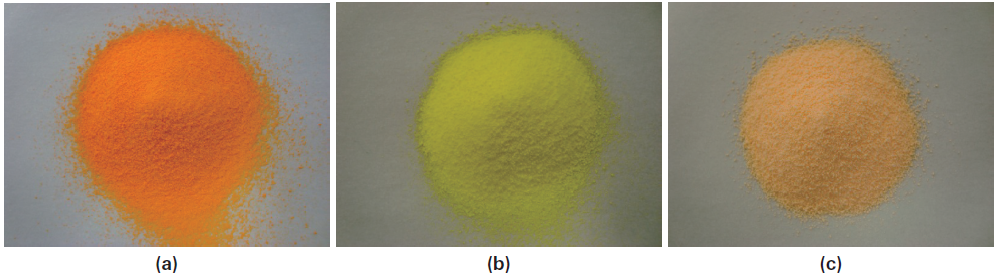
Powdered lactose (lactose hydrate, Mylan Seiyaku Co., Ltd.) was obtained for model diluents. These medicines have been approved as ethical drugs in Japan, so were used as supplied. Carbazochrome sodium sulfonate hydrate, dipyridamole, and tipepidine hibenzate were purchased from Wako Pure Chemical Industries, Ltd. (Osaka, Japan) as standard compounds.
Powdered Medicine Mixture PreparationMixtures of powdered lactose with three kinds of medicines were prepared at a certain ratio according to the experimental protocol. The medicines were blended 60 times using a pestle and mortar according to the methods of the Japanese Guidelines for Dispensation.6) During the experiments, the room temperature was controlled in the range of 20–22°C, and the relative humidity was kept between 35 and 45%.
Powdered medicine mixtures for accuracy of determination, what is termed “quality control samples,” were prepared independently at mass percents of 10, 50, and 90% by the addition of lactose.
Digital ImagesAt five different points of mixtures spread on the stage, digital images of the powdered medicine mixtures were taken with a microscope (M3, Schalar Co., Ltd., Tokyo, Japan) equipped with a 30× magnification lens (30N, Schalar Co., Ltd., Tokyo, Japan), as shown in Fig. 1. The magnification was decided according to our previous study.3) One digital image (640×480 pixels, Windows® Bitmap file) covered an actual area of 47 mm2.
Color Difference Signal MeasurementThe flow chart of the framework of the present quantitative method, what is named “color difference signal method,” is shown in Fig. 3.
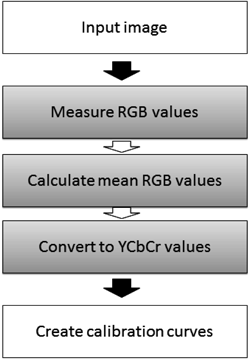
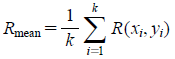
The image processing is divided into three parts as shown in gray-back squares within Fig. 3. In the first step, R, G, and B values of each pixel were obtained by analyzing a given digital image of powdered mixtures with ImageJ (ver.6, National Institute of Health, Washington, D.C., U.S.A.).1) In the second step, for all the whole pixels in the image, the mean values of the three components in RGB color space are calculated as,
 | Eq. 1 |
 | Eq. 2 |
 | Eq. 3 |
where (xi, yi) is the pixel, Rmean, Gmean, and Bmean are the mean values of R, G, and B channels of pixels, respectively, and k is the total number of pixels in the image. In the final step, Rmean, Gmean, and Bmean were converted to Y, Cb, and Cr values, respectively, by calculation according to the equations below7):
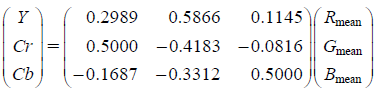 | Eq. 4 |
In this step, we did not manipulate with any additional color enhancement.
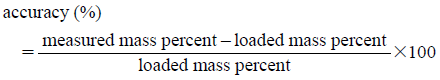
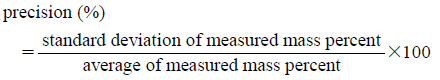
Calibration CurvesRegression analysis was performed between mass percent and the three components in YCbCr color space, and led to obtaining calibration curves for Cb value in the three kinds of powdered medicine mixtures. We confirmed accuracy of determination with respect to the calibration curves using the quality control samples. Three levels of the quality control samples, 10, 50, and 90%, were prepared as described above in the powdered medicine mixture preparation section, and measured mass percent in the mixtures according to the calibration curves. The experiments were repeated three times. Accuracy (%) and precision (%) are defined as:
 | Eq. 5 |
 | Eq. 6 |
Thus, accuracy means the closeness of a measured value to a known value, and precision means the closeness of a number of measurements to each other.
Spectrophotometrical DeterminationThe same quality control samples prepared for image analysis were also analyzed with an UV spectrometer. An aliquot (100 mg) of the mixture was dissolved in the buffer, and then the solutions were examined by a spectrophotometer (U-2010, Hitachi, Ltd., Japan). The concentrations of the active pharmaceutical ingredients (API) were determined with calibration curves using standard compounds. Wave lengths of 363 nm for carbazochrome, 284 nm for dipyridamole, and 286 nm for tipepidine were used. All components of the medicines, except APIs, did not have any absorbance at the wave lengths. The experiments were repeated three times.
Measurement of Physical PropertiesMean diameter, poured density, and tapped density were determined according to Japanese pharmacopeia XVI. In brief, mean diameter was calculated from the cumulative amount curve remaining on the sieves with openings of 53, 75, 100, 150, 250, and 355 µm. Poured density was measured with a measurable cylinder (25 mL) using 10 g of powder, and calculated from dividing mass by poured volume. Then, the measurable cylinder was tapped until constant volume was reached which corresponds to the maximum packing density of the medicine. Tapped density was determined from dividing mass by the constant volume. By measuring both the poured and the tapped density, Carr’s index8) and Hausner ratio9) were determined by the followings:
 | Eq. 7 |
The smaller the Carr’s index the better the flow properties. For example 5–10 indicates excellent, 11–20 good, 21–25 fair and >26 poor flow.
 | Eq. 8 |
A Hausner ratio of <1.25 indicates a powder that is free flowing whereas >1.25 indicates poor flowability.
Three kinds of mixture of powdered lactose with Adona®, Anginal®, or Asverin® powder were investigated to determine the relationship between mass percent of the medicine and Y, Cr, and Cb values of the mixture. Figure 4 shows Y, Cr, and Cb values as a function of the mass percent of the medicine in the three systems.
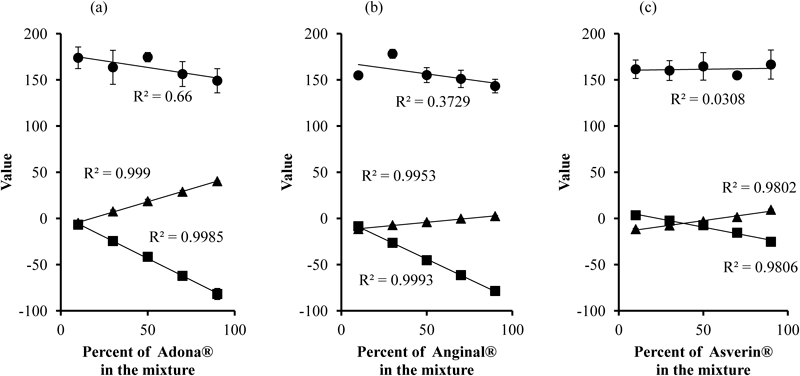
Keys: ●: Y, ▲: Cr, ■: Cb. Each point represents the mean±S.D. (n=5). Regression curves are displayed as solid lines with their determination coefficients (R2).
The relationship between them was evaluated by calculating regression lines with the method of least squares. The determination of coefficient was also displayed in Fig. 4. Regression analysis revealed that Y value changed independently from the mass percent in all systems, so was not a suitable indicator. In contrast, the color difference signals Cr and Cb values showed good linear correlations with the mass percent in the mixtures (p<0.01). Y value means mean grey value when color image converts to grey scale one. Mean grey value was known to change nonlinearly against powder mixing ratio.10–12) Therefore, our result was consistent with previous reports. Compared to Cr value, the Cb value varied over a wider range, indicating that it is a more sensitive indicator. This was owing to hue of the pigment containing in the medicines. For example, Cr was more changeable than Cr in another medicine (data not shown). In this study, therefore, we used Cb as an indicator of the mass percent for further experiments. Thus, the regression curve for Cb value was prepared with five different rates of the medicine in the mixtures. The calibration curves were linear over the range of 10–90%, with coefficient of determination in the range of 0.9806–0.9993.
Accuracy of DeterminationThe accuracy and precision of this quantitative method was evaluated by intra- and inter-day tests using quality control samples. For the accuracy and intra-day variation, the Cb value was determined by assaying three different mass percents of the quality control samples during the same day, and inter-day variation was analyzed using the same quality control samples as used for intra-days precision on three different days in the same laboratory. Accuracy and precision are presented in Table 1.
| Sample | Intra-day | Inter-day | |||
|---|---|---|---|---|---|
| Medicine | Mass percent | Accuracy | Precision | Accuracy | Precision |
| Adona® powder | 10 | 4.0 | 1.47 | 3.0 | 0.562 |
| 50 | 1.4 | 1.06 | 1.6 | 2.07 | |
| 90 | 0.67 | 0.403 | 0.89 | 0.543 | |
| Anginal® powder | 10 | 2.9 | 3.57 | 0.30 | 6.43 |
| 50 | 2.4 | 1.02 | 3.0 | 0.595 | |
| 90 | 1.0 | 1.33 | 2.8 | 1.53 | |
| Asverin® powder | 10 | 12 | 4.73 | 12 | 0.517 |
| 50 | 2.6 | 2.34 | 4.4 | 2.57 | |
| 90 | 1.1 | 0.348 | 5.9 | 3.89 | |
Data (%) are calculated from three experiments.
The accuracy calculated according to Eq. 5 was found to be 0.67–12% and 0.30–12% in the intra- and inter-day tests, respectively. The precision calculated according to Eq. 6 was in the range of 0.348–4.73% and 0.517–6.43% for the intra- and inter-day tests, respectively. Therefore, this method would be the usual quantitative analysis for pharmacies.
Comparison of Image Analysis to Spectrophotometric MethodThe measurement data obtained by image analysis were compared to those determined with a UV spectrometer. The same quality control samples were used in this study. The mass percent determined by image analysis and the UV method are summarized in Table 2. Correlation coefficients between mass percents measured by image analysis and those determined using the UV method in each content level are also shown in Table 2.
| Medicine | Mass percent | Image analysis (%) | UV method (%) | Correlation coefficient (r) |
|---|---|---|---|---|
| Adona® powder | 10 | 10.4±0.15 | 7.39±1.6 | 0.9986 (p<0.001) |
| 50 | 49.3±0.52 | 49.8±1.7 | ||
| 90 | 90.6±0.36 | 89.4±2.9 | ||
| Anginal® powder | 10 | 9.71±0.38 | 10.4±0.16 | 0.9996 (p<0.001) |
| 50 | 51.2±0.55 | 52.5±0.14 | ||
| 90 | 90.9±1.2 | 91.5±0.44 | ||
| Asverin® powder | 10 | 11.2±0.49 | 11.8±0.31 | 0.9939 (p<0.001) |
| 50 | 48.7±1.2 | 54.1±0.48 | ||
| 90 | 91.0±0.32 | 93.0±0.29 |
Data (%) are presented as mean±S.D. (n=3). Correlation coefficient, r, was calculated using all data (n=9).
The mass percent measured by image analysis was correlated to those determined using UV method in all samples (r=0.9939–0.9996) as shown in Table 2. For both image analysis and UV method, relative standard deviation of all samples except Adona® 10% sample were less than 5%. A possible reason for Adona® 10% sample using UV method was that it was difficult to pick up samples keeping uniform blending. The variation in the dispending process is recognized as less than 10%.13) Thereby, image analysis was a sufficient method for practical use.
Influence of Physical Properties of the MedicinesMany factors influence the degree of blending powdered medicines. Therefore, physical properties of the medicines used in this study are listed in Table 3.
| Medicine | Carr’s index | Hausner ratio | Mean diameter (µm) |
|---|---|---|---|
| Adona® powder | 14.4±0.4 | 1.17±0.01 | 143.2±2.4 |
| Anginal® powder | 15.9±0.5 | 1.19±0.01 | 139.2±4.5 |
| Asverin® powder | 12.7±1 | 1.15±0.01 | 170.1±9.2 |
| Powdered lactose | 38.0±0.8 | 1.61±0.02 | <50 |
Each value represents the mean±S.D. (n=3). Mean diameter of powdered lactose was estimated to be less than 50 µm.
In general, powders with similar gravity and diameter tended to be blended homogeneously.14,15) From this point of view, all of the mixtures showed relatively poor uniformity because the flowability and mean diameters of these medicines were quite different from those of powdered lactose. This made it difficult to maintain uniformity for small-amount sampling. In the case of Adona®, accuracy of 10% samples was low in the UV method (Table 2). In the case of Anginal®, inter-day precision of 10% samples was slightly high (Table 1). In the case of Asverin®, 10% samples showed poor accuracy in image analysis (Table 1). Although binary mixtures using these medicines are not an ideal combination, the mixtures are routinely blended in pharmacies according to the same method used in this study. In practice, however, it is unusual to dilute 10% by adding of powdered lactose. The results of determination suggested a possible issue of blending uniformity of the samples as well as good tolerance of image analysis.
In this study, image analysis using color difference signals involving Cb values of the YCbCr color space was developed to assess the blending ratio of the dispensing mixture. Cb values of the mixture showed a favorable correlation with the mass percent of the medicine in the dispensing mixture (Fig. 4). Therefore, the blending ratio was quantitatively determined by the calibration curve. Using a quality control sample, the accuracy and precision of intra- and inter-day measurements were sufficient to identify the blending ratio in the dispensing mixtures (Table 1). The mass percent measured using image analysis was consistent with the concentration of the active pharmaceutical ingredient determined with a spectrophotometer (Table 2). In addition, the standard deviation in image analysis was equivalent to that of the spectrophotometric method. This nondestructive and efficient method has been established for pharmacies.
In the pharmaceutical field, color information in the CIE-L*a*b* color space has also been used as an indicator of the mixing degree of powders.16) CIE-L*a*b* color space is one of the uniform color spaces, which was provided by Commission International de I’Eclairage (CIE) in 1976.4) In a uniform color space, the differences between points plotted in the color space correspond to visual differences between the colors plotted. The CIE-L*a*b* color space is organized in a cube form. The L* axis runs from top to bottom. The maximum for L* is 100, which represents a perfect reflecting diffuser. The minimum for L* is zero, which represents black. The a* and b* axes have no specific numerical limits. Positive a* is red. Negative a* is green. Positive b* is yellow. Negative b* is blue. Matsuda et al. reported that the measured curves related color information L*, a*, and b* to the concentration of colored powder deviated greatly from those theoretical lines.16) They suggested that the complicated behavior of a powder to reflected light derived from luster and surface characteristics of the powder.
On the other hand, mean gray value has been indicative of the blending ratio of powdered mixtures in the field of powder technology.10–12) The mean gray value coincides with Y value in this study, and which was calculated as:
 | Eq. 9 |
where nj is the number of pixels with gray level j. The present study, however, showed that Y value was not a suitable indicator for powdered medicine mixtures due to no significant correlation (p>0.01). Furthermore, it was reported that the calibration curve was quite sensitive to many variables, such as changes in optical properties of solids, illumination conditions, intensity of reflected light, and fouling of camera lenses.17)
In order to use color as a feature for determinant of blending ratio, we have to resolve these issues. It is also robust towards changes in orientation and scaling. A disadvantage of the color cue is its sensitivity to illumination color changes and, especially in the case of RGB, sensitivity to illumination intensity. One way to increase tolerance toward intensity changes in images is to transform the RGB image into a color space whose intensity and chromaticity are separate and use only the chromaticity part for detection. This is why we chose the YCbCr color space.
In quantitative assessment, two criteria are useful for the selection of an optimal indicator for a particular material. The first criterion is to obtain the smallest relative standard deviation from multiple measurements using replicate sample preparations, thus yielding the highest measurement precision. The second criterion is to obtain the largest difference between samples so as to augment the separation in order to allow the robust setting of specifications. From this point of view, Cr and Cb values in the YCbCr color space were found to meet the precision and separation criteria. In this study, one sample of each powdered medicine mixture was assessed using five replicates (n=5) and values were averaged. These values indicated favorable precision for assessment of the blending ratio (Table 1). In these cases, the color difference signal Cb was more changeable to the mass percent than the corresponding Cr values (Fig. 4). This was due to the hue of the medicines used (Fig. 2). More precisely speaking, the hue of the pigment in the medicines would determine a sensitive color difference signal.
In addition, the mass percent estimated by image analysis was consistent with the concentration determined by the UV method (Table 2). This suggested that the drug content could be indirectly measured with this method without an expensive apparatus. In the case of the image analysis method, the sample amount could be enlarged as it was a nondestructive method. This is important because the dispensing mixture is given to patients. Further studies are needed to improve this image analysis method for white medicines or ternary mixtures. However, it may be possible to identify white powder using colored diluents, such as colored lactose, in some cases.14,16) In this study, we applied the image analysis method to the dispensation of powdered medicines, and developed a robust and versatile method. From the standpoint of practical use, the results may be applied, for example, to estimate the mixing ratio or mixing degree of powder mixtures in the industrial field.
We reported a novel method for the quantitative assessment of colored medicines in diluents by digital image processing. A favorable linear correlation between color difference signal Cb value in the YCbCr color space of the powdered medicine mixture and mass percent of each medicine was found. The method has been fully validated using quality control samples. Moreover, the information provided by image analysis was consistent with that obtained spectrophotometrically. This nondestructive method was found to be effective in evaluating the mass percent of blended medicines during the dispending process in pharmacies.