Abstract
In this study, green tea compounds (flavonoids, alkaloids, and phenolic acids) were analyzed in green tea-containing dentifrices, and their stability at different pH levels was evaluated. The compounds were separated under 0.01% phosphoric acid–acetonitrile gradient conditions and detected by photodiode array detector at 210, 280, 300, 335 nm. Column temperature was set at 20°C based on the results of screening various temperatures. Each compound showed good linearity at optimized wavelength as well as showing good precision and accuracy in dentifrices. Using this method, the stability of compounds was investigated in pH 4, 7, 8, and 10 solutions for 96 h, and in pH 7 and pH 10 solutions for 6 months. The green tea compounds were more stable at low pH levels; purine alkaloids were more stable than flavonoids. In particular, gallocatechin (GC), epigallocatechin (EGC), epigallocatechin gallate (EGCG), gallocatechin gallate (GCG), and myricetin almost disappeared in pH 10 solutions after 96 h. In dentifrices, the compounds were gradually decreased until 6 months in both pH types, while gallic acid was increased because of production of galloyl ester of other green tea compounds. Therefore, it is beneficial to adjust to as low a pH as possible when produce green tea-containing dentifrices.
Green tea is obtained from the leaf of the Camellia sinensis, which grows in Southeast Asia. Drinking green tea, a health-promoting beverage, has been common for more than 2000 years.1) As researchers have found beneficial health applications for herbal extracts in the pharmaceutical and food areas, herbal tea products have attracted significant attention.2) Pharmacologically, the most interesting green tea compounds are the polyphenols.3) Polyphenols are a large class of chemical compounds synthesized by fruits, vegetables, teas, cocoa, and other plants that possess certain health benefits. Polyphenols have antioxidant,4,5) anti-inflammatory,6,7) hypoglycemic, hypolipidemic,8) depression of hypertension,9) and other biological properties. Polyphenols are divided into several groups, one of which is represented by flavonoids. The main flavonoid in green tea are catechins (flavoa-3-ols), such as epicatechin, epigallocatechin (EGC), epicatechin gallate (ECG), epigallocatechin gallate (EGCG), gallocatechin (GC), gallocatechin gallate (GCG), catechin, and catechin gallate (CG).3) Besides catechins, apigenin, apigenin-7-O-glucoside (Api-G), myricetin, kaempferol, and vitechin are reported as green tea flavonoids.10,11) In addition, phenolic acids (chlorogenic acid, gallic acid, and caffeic acid) and purine alkaloids (caffeine, theobromine, and theophylline) are contained in green tea.10)
Green tea is one of the beneficial herbal ingredients for dental health.12) The cariogenic bacteria, such as Streptococcus mutans and lactobacilli produce organic acids by sugar metabolism, and then the organic acids reduce the pH of oral environments13) and cause demineralization by hydrogen ion attacks.14) Numerous recent papers have reported the effects of catechins in anti-bacterial activity by inhibiting bacterial adherence to the tooth surface and dental plaque formation by inhibiting the synthesis of adherent glucan by gucosyltranserace.15–17) Flavonols such as kaempferol and myricetin also demonstrated inhibitory activity against S. mutans and the two periodontal pathogens, Porphyromonas gingivalis and Prevotella intermedia.18) The green tea catechins also prevent periodontal disease by anti-oxidant effects.19)
Therefore, many herbal products have been added to oral hygiene products to enhance prevention of caries, and the beneficial effect has been proved by clinical study.20–22) However, there are not enough studies about the quality control of herbal-containing dentifrices, including the analysis of their stability in dentifrices. If the bioactive compounds are easily decomposed in dentifrice matrixes, the beneficial effects of green tea would be short-lived.
The decomposition factors of natural compounds are light, high temperature, microorganism, moisture, and pH level. Among them, light, high temperature, and microorganism can be discounted as dentifrices are generally stored in light-resistant tubes at room temperature with preservatives. In addition, dentifrices are stored in constant moisture conditions. Therefore, the pH of dentifrices could be an important factor to decide the stability of green tea compounds. Generally, the pH of dentifrices can range from 7–10, depending on its additives. Dentifrice is not produced at low pH because the mineral of the enamel and dentine are dissolved, and dental prosthesis is corroded in acidic conditions.23)
Therefore, it is necessary to investigate the chemical stability of green tea compounds in dentifrices at different pH levels to determine the optimum dentifrice matrix for green tea compound preservation. Moreover, an analytical method is required to analyze green tea compounds in dentifrices in order to observe the chemical stability of compounds.
In this study, the green tea compounds including catechins, purine alkaloid, flavonoids, and phenolic acids were simultaneously analyzed by HPLC and photodiode array detector. Numerous reports have simultaneously analyzed green tea compounds with the HPLC method and photodiode array detector.10,24) The simultaneous analysis of green tea compounds is very complicated, requiring readjustment of the analytical condition in order to apply it in another laboratory condition. Moreover, a precise and selective analytical method was required in order to apply in green tea-containing dentifrices.
In this study, the retention behavior of 20 kinds of green tea compounds including flavonoids, purine alkaloid, and phenolic acid were observed according to the column temperature as temperature is the most easily changeable factor that can improve peak selectivity. In addition, the stability of green tea compounds were observed in different pH solutions, and then the decomposition rates were investigated for 6 months in neutral (pH 7) and alkaline (pH 10) dentifrices.
Results and Discussion
Separation of the Green Tea CompoundsTo find optimum separation condition, the compounds were analyzed altering the column temperature at 210 nm, and 335 nm. All compounds were detected at short wavelength (200–230 nm) and only caffeic acid, chlorogenic acid, vitechin, isovitechin, Api-G, myricetin, apigenin, and kaempferol were detected at both short (200–230 nm) and long weavelength (>300 nm). We screened both at 210 and 335 nm in order to distinguish some interference peaks, and all peaks were identified by UV spectrum.
Figure 1 shows the chromatogram of standard mixtures in different temperature. The retention of all target compounds indicated an exothermic process which means retention decreases with increasing temperature. The slope of Van’t Hoff plots of each compounds were slightly different, and this difference makes resolution change as the column temperature changing.

For example, retention of GC (peak 3) was decreased more steeply as increasing column temperature than that of theobromine (peak 2). Thereby, the GC (peak 3) and theobromine (peak 2) were overlapped at 25°C, and GC was eluted anteriorly at higher temperature, and theobromine was eluted anteriorly at lower temperature. For another example, the resolution between EGC (peak 5) and caffeine (peak 6) was enhanced as column temperature increasing. The caffeine (peak 6) and catechin (peak 7) were also overlapped at 25°C and catechin was eluted anteriorly at higher temperature, and caffeine was eluted anteriorly at lower temperature. The chlorogenic acid and caffeic acid peaks were indentified at 335 nm because one of them was always overlapped with peak 6 or 7 as changing column temperature. The resolution between chlorogenic acid and caffeic acid, and the resolution epicatechin (peak 10) and EGCG (peak 11) was enhanced as decreasing the column temperature. The resolution between vitexin (peak 13) and isovitexin (peak 14) and the resolution between ECG (peak 15) and CG (peak 16) was enhanced as increasing the column temperature.
It was very difficult to simultaneously separate 20 kinds of green tea compounds. Chlorogenic acid, caffeic acid, vitexin and isovitexin which were overlapped with other peaks was confirmed to be not detected in green tea by detecting green tea at 335 nm. Therefore, we analyzed the other 16 compounds in this study at 20°C, and chlorogenic acid, caffeic acid, vitexin and isovitexin was excluded in the analysis. If they are target compounds, they can selectively analyze at over 300 nm because other overlapped peaks (peak 6, 7, 15, and 16) were not detected the long wavelength. The 16 compounds showed baseline separation (Rs>1.2). Gallic acid was detected at 300 nm, and apigenin and kaempferol was detected at 335 nm in order to distinguish from other green tea interference peaks. Theophylline was detected at 280 nm to avoid the overlapping with a peak from dentifrices. The others were detected at 210 nm.
Linearity, Precision and AccuracyThe parameters of linear range, linear equation, correlation coefficient, limit of detection (LOD) and limit of quantification (LOQ) were investigated in Table 1. All compounds was good linearity (r2>0.99) up to 50 µg/mL. The LODs and LOQs of compounds were 0.004–0.018 µg/mL and 0.011–0.054 µg/mL, respectively.
Table 1. Investigated Linear Range, Linear Equation, Correlation Coefficient, Limits of Detection (LOD) and Limits of Quantitation (LOQ)
| Compounds | Detection (nm) | Linear range (µg/g) | Linear equation | r2 | LOD (µg/g) | LOQ (µg/g) |
|---|
| Gallic acid | 300 | 0.05–50 | y=1.1902+0.2949 | 0.9948 | 0.018 | 0.054 |
| Theobromine | 210 | 0.05–50 | y=8.7235+0.5243 | 1.0000 | 0.011 | 0.035 |
| GC | 210 | 0.02–50 | y=13.714+0.2777 | 0.9997 | 0.005 | 0.017 |
| Theophyllin | 280 | 0.05–50 | y=4.2674+0.3366 | 0.9990 | 0.022 | 0.066 |
| EGC | 210 | 0.02–50 | y=13.0971+0.2340 | 0.9974 | 0.005 | 0.015 |
| Caffeine | 210 | 0.02–50 | y=11.0578+0.6024 | 0.9997 | 0.007 | 0.021 |
| Catechin | 210 | 0.02–50 | y=12.1579+1.0475 | 0.9994 | 0.005 | 0.016 |
| Epicatechin | 210 | 0.02–50 | y=11.2187–0.1260 | 0.9996 | 0.007 | 0.020 |
| EGCG | 210 | 0.02–50 | y=16.5546+0.5768 | 0.9995 | 0.004 | 0.011 |
| GCG | 210 | 0.02–50 | y=13.5943+0.3872 | 0.9991 | 0.005 | 0.014 |
| ECG | 210 | 0.02–50 | y=11.2144+0.2067 | 0.9995 | 0.007 | 0.021 |
| CG | 210 | 0.02–50 | y=10.3377+0.1578 | 0.9953 | 0.008 | 0.025 |
| Api-G | 210 | 0.02–50 | y=3.2560+0.4152 | 0.9937 | 0.004 | 0.013 |
| Myricetin | 210 | 0.05–50 | y=7.6105–0.1933 | 0.9923 | 0.014 | 0.043 |
| Apigenin | 335 | 0.02–50 | y=3.5015–0.0290 | 0.9968 | 0.005 | 0.014 |
| Kaempferol | 335 | 0.02–50 | y=2.0676–0.0342 | 0.9973 | 0.008 | 0.024 |
The precision and recovery was evaluated by intra- and inter-day assay with 5 µg/g and 50 µg/g spiked samples of blank dentifrices (Table 2). The recoveries were 93.4–107.7% in 5 µg/g spiked sample and were 95.3–105.1 in 50 µg/g spiked samples, and the %R.S.D. were not excess 12.6% in 5 µg/g spiked sample and 9.9% in 50 µg/g spiked sample in all compounds. These data was shown in Fig. 2.
Table 2. Intra- and Inter-Day Validation Results for Recovery Tests of Compounds in the Blank Dentifrices
| Compounds | Spiked (µg/g) | Intra-day assay (n=4) | Inter-day assay (n=16) |
|---|
| Day 1 | Day 2 | Day 3 | Day 4 |
|---|
| Founded (µg/g) | Recovery (%) | Founded (µg/g) | Recovery (%) | Founded (µg/g) | Recovery (%) | Founded (µg/g) | Recovery (%) | Founded (µg/g) | Recovery (%) |
|---|
| Gallic acid | 5 | 5.1±0.4 | 102.1 | 4.9±0.1 | 98.2 | 4.9±0.5 | 98.4 | 4.9±0.3 | 98.7 | 5.0±0.3 | 99.3 |
| 50 | 49.0±1.6 | 98.0 | 48.0±1.7 | 96.0 | 51.1±2.1 | 102.1 | 49.4±4.3 | 98.9 | 49.4±2.6 | 98.8 |
| Theobromine | 5 | 4.9±0.4 | 98.5 | 5.2±0.2 | 104.8 | 4.8±0.3 | 95.3 | 5.1±0.5 | 101.1 | 5.0±0.4 | 99.9 |
| 50 | 50.6±1.8 | 101.2 | 48.3±1.9 | 96.6 | 49.9±2.6 | 99.8 | 51.2±4.2 | 102.4 | 50.0±2.7 | 100.0 |
| GC | 5 | 5.1±0.3 | 101.1 | 5.1±0.2 | 102.5 | 4.9±0.1 | 98.1 | 4.9±0.2 | 98.0 | 5.0±0.2 | 99.9 |
| 50 | 50.3±2.9 | 100.6 | 48.0±1.7 | 96.0 | 48.9±1.3 | 97.8 | 50.7±1.7 | 101.4 | 49.5±2.1 | 99.0 |
| Theophyllin | 5 | 5.1±0.4 | 101.1 | 5.1±0.2 | 101.9 | 4.9±0.2 | 98.5 | 4.9±0.3 | 98.1 | 5.0±0.2 | 99.9 |
| 50 | 50.3±2.9 | 100.6 | 48.0±1.8 | 96.1 | 50.5±1.8 | 100.9 | 49.6±0.3 | 99.2 | 49.6±2.0 | 99.2 |
| EGC | 5 | 5.0±0.2 | 99.4 | 5.4±0.6 | 107.1 | 4.9±0.3 | 97.6 | 5.1±0.3 | 102.2 | 5.1±0.4 | 101.6 |
| 50 | 49.0±2.0 | 98.1 | 50.9±4.6 | 101.7 | 50.6±1.8 | 101.1 | 49.0±1.6 | 98.0 | 49.9±2.6 | 99.7 |
| Caffeine | 5 | 5.1±0.4 | 102.4 | 5.1±0.2 | 102.3 | 4.9±0.6 | 97.7 | 4.9±0.3 | 98.2 | 5.0±0.4 | 100.2 |
| 50 | 48.8±1.4 | 97.5 | 48.0±1.8 | 96.0 | 49.2±2.7 | 98.4 | 50.1±1.3 | 100.2 | 49.0±1.8 | 98.0 |
| Catechin | 5 | 5.0±0.4 | 99.7 | 4.7±0.3 | 93.4 | 5.0±0.3 | 100.1 | 5.1±0.6 | 101.7 | 4.9±0.4 | 98.7 |
| 50 | 49.1±3.3 | 98.2 | 48.2±1.4 | 96.3 | 51.0±4.0 | 102.0 | 51.2±2.3 | 102.4 | 49.9±2.9 | 99.7 |
| Epicatechin | 5 | 5.0±0.2 | 100.4 | 5.1±0.3 | 101.4 | 4.8±0.5 | 96.3 | 4.8±0.5 | 95.9 | 4.9±0.4 | 98.5 |
| 50 | 48.5±1.6 | 96.9 | 48.6±2.0 | 97.2 | 50.9±3.3 | 101.8 | 49.7±1.5 | 99.4 | 49.4±2.2 | 98.9 |
| EGCG | 5 | 5.0±0.3 | 101.0 | 5.2±0.2 | 103.9 | 4.9±0.6 | 97.9 | 5.0±0.5 | 99.4 | 5.0±0.4 | 100.5 |
| 50 | 49.2±1.1 | 98.4 | 48.0±1.8 | 96.0 | 50.3±2.2 | 100.7 | 50.3±0.8 | 100.5 | 49.4±1.7 | 98.9 |
| GCG | 5 | 5.0±0.1 | 99.6 | 5.1±0.0 | 102.6 | 4.9±0.6 | 98.0 | 4.9±0.3 | 98.9 | 5.0±0.3 | 99.8 |
| 50 | 49.9±1.1 | 99.8 | 48.5±1.6 | 97.0 | 49.6±1.7 | 99.2 | 52.5±1.4 | 105.1 | 50.1±2.0 | 100.3 |
| ECG | 5 | 4.9±0.2 | 98.1 | 5.1±0.3 | 102.3 | 5.0±0.3 | 99.2 | 4.9±0.4 | 97.6 | 5.0±0.3 | 99.3 |
| 50 | 49.1±1.3 | 98.1 | 48.5±1.5 | 96.9 | 51.0±1.8 | 101.9 | 49.7±1.7 | 99.4 | 49.5±1.7 | 99.1 |
| CG | 5 | 5.0±0.5 | 99.8 | 4.9±0.2 | 98.2 | 5.0±0.6 | 100.6 | 5.0±0.3 | 99.6 | 5.0±0.4 | 99.5 |
| 50 | 47.7±4.0 | 95.3 | 48.4±1.6 | 96.7 | 50.2±1.2 | 100.5 | 51.1±1.4 | 102.3 | 49.3±2.5 | 98.7 |
| Api-G | 5 | 5.0±0.1 | 99.4 | 5.0±0.3 | 100.6 | 5.0±0.6 | 100.6 | 5.0±0.2 | 100.7 | 5.0±0.3 | 100.3 |
| 50 | 49.3±0.9 | 98.6 | 48.5±2.2 | 97.0 | 49.5±1.7 | 99.0 | 50.9±0.7 | 101.9 | 49.6±1.6 | 99.1 |
| Myricetin | 5 | 5.1±0.4 | 102.9 | 5.1±0.2 | 101.4 | 4.9±0.4 | 98.5 | 5.2±0.3 | 103.7 | 5.1±0.3 | 101.6 |
| 50 | 49.5±1.7 | 99.0 | 50.0±2.2 | 99.9 | 49.3±4.9 | 98.6 | 48.8±3.7 | 97.6 | 49.4±3.0 | 98.8 |
| Apigenin | 5 | 5.1±0.6 | 102.4 | 4.7±0.3 | 95.0 | 5.3±0.6 | 106.0 | 5.4±0.2 | 107.7 | 5.1±0.5 | 102.8 |
| 50 | 50.3±1.2 | 100.5 | 49.7±2.6 | 99.3 | 50.1±1.9 | 100.3 | 49.3±4.2 | 98.6 | 49.8±2.5 | 99.7 |
| Kaempferol | 5 | 5.1±0.4 | 102.8 | 5.1±0.1 | 101.0 | 4.9±0.2 | 98.9 | 5.0±0.1 | 100.1 | 5.0±0.2 | 100.7 |
| 50 | 50.7±1.4 | 101.4 | 51.4±4.0 | 102.9 | 50.3±1.2 | 100.7 | 49.1±0.7 | 98.2 | 50.4±2.2 | 100.8 |
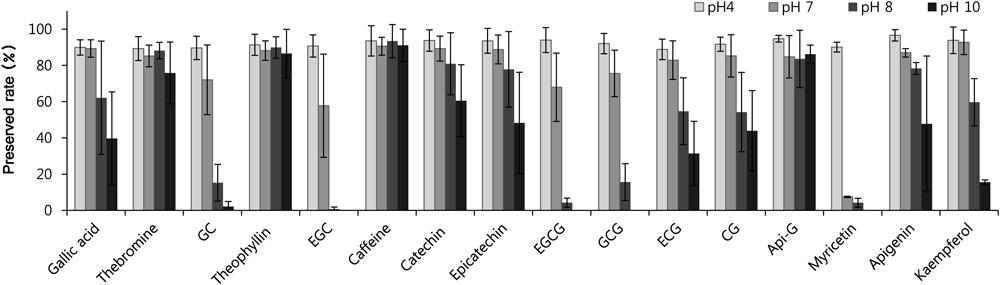
Fig. 2. The Preserved Rate (%) of Green Tea Compounds in the pH 4, 7, 8, and 10 Solutions (n=4)
The decomposition factors of natural compounds are light, high temperature, microorganism, and water. Among them, light, high temperature, and microorganism can be ignored as dentifrices are generally stored in light-resistant tubes at room temperature. In addition, microorganism decomposition could be inhibited by the cytostatic or sterilizing action of preservative and sufactant in dentifrices. However, dentifrices necessarily contain limited amounts of water. The catechins have been reported to be hydrolyzed in some reports.25,26) Actually, the compounds preserved over 95% for one month in anhydrous methanol solution, though they were unstable in aqueous solution. For this reason, single organic solvent (methanol, acetonitrile, etc.) have been used for extraction of green tea in previous studies.24) Therefore, toothpaste composition should be designed to minimize the decomposition of green tea compounds. pH level is one of the important chemical factors in decomposition of compounds, and it is an adjustable factor in toothpaste manufacturing. Therefore, the decomposition rate was investigated according to the pH to the target compounds as one phenolic acid (gallic acid), three purine alkaloids (theophyllin, theobromine, and caffeine), and twelve flavonoids (CG, EGC, caffeine, catechin, epicatechin, EGCG, GCG, ECG, CG, Api-G, myricetin, apigenin, and kaempferol). The pH for checking the stabilities were selected to 4, 7, 8, and 10 considering the capacity buffer and pH of dentifrices. The stability tests were not performed in strong acidic or alkaline pH to avoid the column deterioration. The compounds were gradually decreased as time passed. The preservation rates after 96 h are shown in this study to compare the stability of each compounds at once.
Figure 2 shows the preservation rates of each compound at pH 4, 7, 8, 10 buffer solutions for 96 h. Purine alkaloid showed higher stability than other compounds, while the preservation rates of the other compounds were dramatically decreased with increasing pH. At pH 4, all compounds were preserved over 89%. At pH 7, significant decomposition of flavonoids began. In particular, only 58% of EGC, 67% of EGCG, and 7% of myricetin were preserved. At pH 8, almost all EGC, EGCG, and myricetin was decomposed. GC and GCG were preserved by only about 15%, and ECG and CG were preserved by only about 55%. At pH 10, EGC, EGCG, GCG, and myricetin were not detected at all, and other compounds remained under 50%, except theobromine, theophyllin, caffeine, catechin, and Api-G. Thus, bioactive compounds were very unstable at high pH. These results correspond to the previous studies that found that catechins are more stable at lower pH levels. Yoshida et al. reported that the extraction efficiency was increased as the solvent pH decreased,27) and Zuo et al. also increased the extraction efficiency by adding 0.15% HCl to methanol solvents.24) Tuominen and Sundman also reported the hydrolysable tannins were unstable in basic conditions because of polyphenol oxidation.28) Therefore, it was estimated that it is advantageous to ensure low pH when manufacturing products or medicines containing green tea.
The Contents of Compounds in Green Tea and DentifricesWhen analyzing green tea extracts, EGCG (147.4±3.2 mg/g) and EGC (114.2±2.2 mg/g) were the most abundant compounds, and theophyllin, catechin gallate, Api-G, and myricetin were not found. Therefore, the contents of EGCG and EGC were expected to be 1474 µg/g and 1142 µg/g, respectively, in dentifrices containing 1% of green tea extracts. However, these were considered not to be preserved perfectly as they could be decomposed during manufacturing and storing. Therefore, to investigate the stability of green tea compounds in real dentistry samples, green tea extract was added in two different dentifrices (pH 7, pH 10). Acid toothpaste was not prepared, although the compounds were more stable at pH 4 in the stability test.
Generally, the pH range of dentifrices was generally 7 to 10. The mineral of the enamel and dentine are dissolved in acidic conditions, ultimately causing dental caries. Especially, pH less than 5 is the critical pH of enamel. Moreover, dental prosthesis could be corroded at low pH levels. Therefore, dentifrices aren’t produced at low pH levels. In this study, decomposition of green tea compounds was investigated in in dentifrices of pH 7 and pH 10 for 6 months. This period was enough to find the decomposition tendency of green tea compounds. The chromatogram of two kinds of dentifrices is shown in Fig. 3. The peaks were decreased after 6 month storage in both pH of dentifrices, that means it was impossible to perfectly prevent the decomposition of compounds in both pH. But the compounds were much more represented in pH 7 dentifrices than pH 10 dentifrices.

The chromatograms of dentifrices, obtained at UV 210 nm, are shown in Fig. 3. Separately, expended peaks of apigenin and kaempferol were present, obtained at UV 335 nm. Theophyllin, GC, Api-G, and myricetin were not detected as they were not contained in the raw green tea extracts. The peaks of all compounds contained in the green tea extracts were presented. Peaks A and B shown in both dentifrices, and Peak C is shown in pH 10 dentifrices, are derived from blank dentifrices, not from green tea. The dentifrices’ peaks did not interfere with the identification of the target compounds. Peak C and theophylline overlapped; this problem is solved by detecting at 280 nm, as peak C was not detected in 280 nm. In this study, we reconfirmed the existence of theophylline at 280 nm and confirmed that it was not contained in dentifrices.
The measured contents are shown in Table 3. The expected concentrations were calculated from the concentration of green tea extracts obtained by analyzing 0.1 mg/mL of green tea extracts at four times. The initial concentration means the concentration analyzed within 3 h after manufacturing. Flavonoids were decreased during manufacturing process. The preserved rates of flavonoids were from 64 to 96% in pH 7 dentifrices, and those were from 2 to 86% in pH 10 dentifrices. Purine alkaloids were rarely decomposed in pH 7 dentifrices (theobromine 99%, caffeine 98%), but were marginally decomposed in pH 10 dentifrices (theobromine 77%, caffeine 92%). On the other hand, gallic acid rather increased in concentration, against expectations. These data show that a considerable amount of green tea compounds had already decomposed during the manufacturing process, especially in weak alkaline conditions. After 6 months, the preserved rates of flavonoids were from 0.4 to 46% in pH 7 dentifrices. EGC and EGCG, the main compounds of green tea, showed the least preserved rates (EGC 0.4%, EGCG 3.1%). In pH 10 dentifrices, EGC and GCG disappeared, and the other flavonoids remained between only 0.8 to 42%. The preserved rates of theobromine and caffeine were 63% and 73%, respectively, in pH 7 dentifrices, and were 51% and 71%, respectively, in pH 10 dentifrices. Gallic acid was increased up to 936% in pH 7 dentifrice, and up to 281% in pH 10 dentifrice. That means gallic acid is produced during storage. Typically, gallic acid is produced from shikimic acid by the shiminate pathway.29) We assumed that gallic acid is mainly produced by hydrolysis of galloyl ester of tannic acid, ECG, EGCG, GCG, chlorogenic acid, theaflavin-3-gallate, and so on in this study.30) It is possible that these galloylated esters have been converted to gallic acid. The possibility that gallic acid is produced from glucose by microbial catalysis cannot be ruled out completely,31) however, this pathway could be inhibited under anti-microbial conditions. Through these pathways, gallic acid increased by a multiple of almost 10 in pH 7 dentifrices, and nearly three in pH 10 dentifrices, over 6 month.
Table 3. The Contents (µg/g) of Compounds in 1% Green Tea-Containing Dentifrices of pH 7 and pH 10 Determined Immediately after Manufacture and after 6-Month Storage (
n=4)
| Compounds | Expected | pH 7 | pH 10 |
|---|
| Initial | After 6 month | Initial | After 6 month |
|---|
| Gallic acid | 9.7± 1.0 | 12.5±1.1 (128.9%) | 90.8±15.7 (935.7%) | 24.2±1.6 (249.5%) | 27.3±4.7 (281.4%) |
| Theobromine | 9.9 ±0.4 | 9.8±0.5 (99.3%) | 6.3±0.9 (63.2%) | 7.6±0.4 (77.0%) | 5.1±1.4 (51.2%) |
| CG | 75.6 ±3.7 | 55.7±3.3 (73.6%) | 14.5±0.6 (19.1%) | 21.4±1.9 (28.3%) | 0.6±0.1 (0.8%) |
| Theophyllin | ND | ND | ND | ND | ND |
| EGC | 1141.8±22.5 | 7 31.4±40.5 (64.1%) | 4.6±1.6 (0.4%) | 22.1±2.4 (1.9%) | ND |
| Caffeine | 426.6 ±31.3 | 416.7±45.5 (97.7%) | 310.8±52.6 (72.9%) | 392.6±26.0 (92.0%) | 303.1±36.8 (71.0%) |
| Catechin | 40.1 ±2.1 | 30.2±1.8 (75.4%) | 18.3±2.6 (45.6%) | 22.1±1.2 (55.1%) | 16.9±2.2 (42.1%) |
| Epicatechin | 277.5 ±2.2 | 268.8±15.1 (96.9%) | 82.1±11.4 (29.6%) | 239.7±20.0 (86.4%) | 26.9±9.1 (9.7%) |
| EGCG | 1474.1 ±31.9 | 1022.7±160.9 (69.4%) | 45.8±6.8 (3.1%) | 156.3±4.6 (10.6%) | 2.4±0.6 (0.2%) |
| GCG | 24.5 ±1.3 | 17.3±1.0 (70.8%) | 7.5±1.3 (30.8%) | 12.1±0.5 (49.3%) | ND |
| ECG | 388.0 ±40.6 | 345.4±19.0 (89.0%) | 93.7±11.5 (24.1%) | 327.6±7.0 (84.4%) | 35.7±3.0 (9.2%) |
| CG | ND | ND | ND | ND | ND |
| Api-G | ND | ND | ND | ND | ND |
| Myricetin | ND | ND | ND | ND | ND |
| Apigenin | 9.1±0.7 | 7.5±0.6 (82.1%) | 3.4±0.6 (37.9%) | 3.8±0.4 (42.1%) | 2.9±0.7 (32.4%) |
| Kaempferol | 5.7± 0.3 | 4.8±0.2 (83.5%) | 0.8±0.1 (14.1%) | 2.3±0.2 (40.8%) | 1.7±0.3 (29.1%) |
The content changes of EGC and EGCG, the most abundant compounds in green tea, were observed by analyzing dentifrices at 10-d intervals for 300 d (Fig. 4). The EGC and EGCG are gradually decreased in both pH dentifrices. Generally, the compounds were decreased to half for around 50 d. EGC completely disappeared after 150 d in pH 10 conditions. Therefore, it is better to use dentifrices containing green tea as bioactive compounds as soon as possible before compounds are decomposed significantly.

Fig. 4. The Changes of EGC and EGCG Contents in pH 7 (A) and pH 10 (B) Dentifrices for 300 d (n=4)
The results show that target compounds were more stable in low pH; purine alkaloids were more stable than flavonoids; and catechin, apigenin, and kaempferol were relatively more stable than other flavonoids, agreeing with the preceding stability test in different pH solutions (Fig. 2). However, the speed of decomposition was considerably different. For example, about 32% of EGCG was decomposed in pH 7 solution in 96 h, while it takes 30 d to decompose 25% of EGCG in pH 7 dentifrice. Likewise, EGC and EGCG completely disappeared within 96 h at pH 10 solution, but they were remained until 150 d in pH 10 dentifrices. We predict that the main reason for the difference in decomposition rate is the dentifrice ingredients and properties. The molecules in gel-type dentifrices have less freedom to move than in liquid, and the chemical reaction could thus be less active in dentifrices. In addition, microorganism decomposition could be inhibited by the cytostatic or sterilizing action of preservative and surfactant in dentifrices. Therefore, the decomposition rates according to the dentifrice ingredients or properties should be investigated.
Conclusion
An analytical method was investigated for simultaneous analysis of flavonoids, purine alkaloids, and phenolic acids in green tea and green tea-containing dentifrices, and for chemical stability according to pH level. To determine compounds, column temperature was optimized, and various UV wavelengths were applied. The retention of compounds was decreased with increasing temperature, and the resolutions of some compounds were altered according to temperature. In this study, green tea compounds were separated by 0.01% phosphoric acid—aceonitrile gradient elution at 20°C, and were detected at 210, 280, 300, and 335 nm. Green tea compounds were increasingly unstable as the solvent pH increased, and this instability was more severe in flavonoids than purine alkaloids. When green tea compounds were used as active components, they were decomposed during the manufacturing process and the 6-month storage process of. The compounds remained at higher levels in pH 7 dentifrices than in pH 10 dentifrices. EGC and EGCG, the main compounds, were decreased to half by around 50 d, while gallic acid was increased as it was produced from the hydrolysis of other compounds. The decomposition of green tea compounds can be minimized by using low pH dentifrices, but not perfectly preserved. To improve the stability and prolong their efficiency, it is required to develop special formulation methods, such as capsules or coating, which can prevent contact with water. This study implies that it is beneficial to adjust to as low a pH as possible when producing not only green tea-containing dentifrices but also other products (cosmetics, processed food, soap, etc.) that contain polyphenols.
Experimental
ReagentCrude drugs of the leaf of the Camellia sinensis was purchased from Boseong Green Tea Plantation (Boseong, South Korea). Standard compounds of gallic acid, theobromine, theophyllin, epicatechin, EGC, ECG, EGCG, GC, GCG, catechin and CG, apigenin, Api-G, myricetin, kaempferol, vitechin, and isovitechin were purchased from ChromaDex (Santa Ana, CA, U.S.A.), and chlorogenic acid, caffeic acid, and caffeine from Sigma-Aldrich (St. Louis, MO, U.S.A.). HPLC-grade acetonitrile were purchased from Fisher Scientific (Fairlawn, NJ, U.S.A.), and phosphoric acid, sodium hydroxide tablet was purchased from Duksan Pure Chemicals (Ansan, South Korea). All other reagents and solvents were of guaranteed or analytical grade.
A Millipore membrane filter (type HA, pore size: 0.45 mm, mixed cellulose esters) was used for solvent filtration. All samples were filtered through disposable syringe filters (hydrophobic polytetrafluoroethylene (PTFE) membrane; pore size: 0.20 mm; Advantec MFS, Inc., Tokyo, Japan) before injection. Standard solutions, sample solutions, and the mobile phase were prepared with 18 MΩ deionized water produced by a MilliPore Direct-Q 3 Water Purification (Billerica, MA, U.S.A.).
Chromatographic ConditionThe Ultimate-3000 series (Dionex, Sunnyvale, CA, U.S.A.) was used equipped with pump, column compartment, and photodiode array detector. Data acquisition was performed with Chromeleon software (Sunnyvale, CA, U.S.A.). Chromatographic separation was performed using a Hypersil GOLD C18 column (150 mm×2.1 mm internal diameter, 3 µm particle size; Thermo, Waltham) protected by a KrudKatcher ultra in-line filter (Phenomenex, Torrance, CA, U.S.A.).
The mobile phase consisted of 0.01% phosphoric acid (solvent A) and acetonitrile (solvent B). The gradient program of the mobile phase was as follows: isocratic elution with A : B (98 : 2) from 0 to 7 min, gradient elution from A : B (98 : 2) to (84 : 16) from 7 to 30 min, and gradient elution from A : B (84 : 16) to (40 : 60) from 30 to 50; final equilibration was set at A : B (98 : 2) for 10 min. The flow rate was 0.2 mL/min, injected amount was 10 µL, and the separation temperature was 20°C.
Standard PreparationStock solutions were prepared by dissolving 1 mg of each standard in 1 mL of methanol in an Eppendorf tube. Each stock solution was diluted with deionized water to create nine calibration points (0.02, 0.05, 0.1, 0.5, 1, 5, 10, 25, 50 µg/mL).
In order to investigate the stability of compounds according to the pH, the stock solutions of each compound were diluted with 10 mM sodium phosphate solution (pH 4, 7, 8, 10) to create final concentration to 10 µg/mL. The solution was stored for 96 h, and then preserved rates were calculated. This stability test was repeated four times to check standard deviation.
Toothpaste PreparationThe dried green tea powder (1 kg) was extracted in 2 L of 70% ethanol by magnetic stirrer for 1 d at room temperature. The extraction was repeated three times. The extract was then filtered through Whatman No. 3 filter paper and concentrated using rotary evaporator. Ethanol extracts of green tea were obtained after lyophilization.
The constituents of toothpaste are as follow: Sodium fluoride (1 g), saccharin (1 g), sorbitol (15 g), butyl p-hydroxybenzoate (0.2 g), and glycerin (15 g) dissolved in distilled water (25 mL). The mixture of cellulose gum (2 g), sodium lauryl sulfate (2 g), and abrasive agent (40 g) was added to the solution, which was then mixed using a toothpaste mixer (Woo Won Machinery, Siheung, South Korea). The abrasive agent was hydrated silica in neutral toothpaste (pH 7) and calcium carbonate in alkali toothpaste (pH 10). One gram of green tea extract was added to each dentifrice (99 g), and then mixed with a vacuum for 30 min. Finally, two types of dentifrices (pH 7 and pH 10) containing 1% green tea extract was manufactured. Each dentifrice was manufactured four times to check standard deviation. Green tea-blank dentifrices were also prepared in order to check interference peaks and spiked test.
The toothpastes were stored in room temperature and were analyzed at 10-d intervals for 6 months. The toothpaste (200 mg) was extracted in methanol (1 mL) by vortexing for 5 min and then filtered by PTFE syringe filter. The filtrate was diluted with water ten times, and then injected into HPLC. Additionally, green tea extracts used in dentifrices were also analyzed four times. The green tea extracts were dissolved in ethanol at 10 mg/mL and filtered by PTFE syringe filter. The filtrate was diluted with water to 0.1 mg/mL and then injected into HPLC.
Method ValidationThe linearity of the detection response for each compound was examined using eight standard solutions (0.01 0.05, 0.1, 0.5, 1, 10, 25, 50 µg/mL). The regression equation was y=ax+b, where y and x are the peak area and sample concentration, respectively. The LOD and LOQ were determined according to ICH guideline Q2B. LOD was defined as 3.3 σ/S and LOQ was 10 σ/S. The standard deviation of the y intercepts of the regression lines was used as σ (standard deviation of the response), and the slope of calibration curve was used as S. The precision and accuracy of the analysis was evaluated by performing intra- and inter-day assays of fortified samples by adding known amounts of standards to the blank toothpaste and then checking the relative standard deviation (%R.S.D.) of the recoveries (%). Four injections were performed each day and repeated for four consecutive days.
Acknowledgment
This research was supported by the Basic Science Research Program through the National Research Foundation of Korea (NRF), funded by the Ministry of Education, Science and Technology (2012R1A5A2051381) and by the Ministry of Science, ICT & Future Planning (2013R1A1A1A05007175).
References
- 1) Pandey V., Int. J. Clin. Dent. Sci., 2, 103–106 (2011).
- 2) Wu C. D., Wei G. X., Nutrition, 18, 443–444 (2002).
- 3) Graham H. N., Prev. Med., 21, 334–350 (1992).
- 4) Valcic S., Burr J. A., Timmermann B. N., Liebler D. C., Chem. Res. Toxicol., 13, 801–810 (2000).
- 5) Katiyar S. K., Mukhtar H., J. Cell. Biochem., 67, (Suppl. 27), 59–67 (1997).
- 6) Kim K. H., Moon E., Choi S. U., Kim S. Y., Lee K. R., Phytochemistry, 92, 113–121 (2013).
- 7) Riegsecker S., Wiczynski D., Kaplan M. J., Ahmed S., Life Sci., 93, 307–312 (2013).
- 8) Tenore G. C., Stiuso P., Campiglia P., Novellino E., Food Chem., 141, 2379–2384 (2013).
- 9) Potenza M. A., Marasciulo F. L., Tarquinio M., Tiravanti E., Colantuono G., Federici A., Kim J. A., Quon M. J., Montagnani M., Am. J. Physiol. Endocrinol. Metab., 292, E1378–E1387 (2007).
- 10) Samanidou V., Tsagiannidis A., Sarakatsianos I., J. Sep. Sci., 35, 608–615 (2012).
- 11) Engelhardt U. H., Finger A., Kuhr S., Z. Lebensm. Unters. Forsch., 197, 239–244 (1993).
- 12) Ferrazzano G. F., Amato I., Ingenito A., De Natale A., Pollio A., Fitoterapia, 80, 255–262 (2009).
- 13) Featherstone J. D., J. Am. Dent. Assoc., 131, 887–899 (2000).
- 14) Odajima T., Onishi M., Connect. Tissue Res., 38, 119–127, discussion, 139–145 (1998).
- 15) Hamada S., Ooshima T., Fijiwara T., Minami T., Kimura S., Microb. Ecol. Health Dis., 9, 349–357 (1996).
- 16) Hattori M., Kusumoto I. T., Namba T., Ishigami T., Hara Y., Chem. Pharm. Bull., 38, 717–720 (1990).
- 17) Kashket S., Paolino V. J., Lewis D. A., van Houte J., Arch. Oral Biol., 30, 821–826 (1985).
- 18) Cai L., Wu C. D., J. Nat. Prod., 59, 987–990 (1996).
- 19) Chatterjee A., Saluja M., Agarwal G., Alam M., J. Indian Soc. Periodontol., 16, 161–167 (2012).
- 20) Gang I. G., Lee S. C., Chung C. P., Son S. H., J. Periodontal. Implant Sci., 21, 1–16 (1991).
- 21) Shon J. B., Kim D. K., Hong S. J., J. Korean Acad. Oral Health, 28, 304–314 (2004).
- 22) Maruyama T., Tomofuji T., Endo Y., Irie K., Azuma T., Ekuni D., Tamaki N., Yamamoto T., Morita M., Arch. Oral Biol., 56, 48–53 (2011).
- 23) Mathew M. T., Abbey S., Hallab N. J., Hall D. J., Sukotjo C., Wimmer M. A., J. Biomed. Mater. Res. B Appl. Biomater., 100B, 1662–1671 (2012).
- 24) Zuo Y., Chen H., Deng Y., Talanta, 57, 307–316 (2002).
- 25) Battestin V., Macedo G. A., De Freitas V. A. P., Food Chem., 108, 228–233 (2008).
- 26) Arunachalam M., Raj M. M., Mohan N., Mahadevan A., Proc. Indian Natl. Sci. Acad., B69, 353–370 (2003).
- 27) Yoshida Y., Kiso M., Goto T., Food Chem., 67, 429–433 (1999).
- 28) Tuominen A., Sundman T., Phytochem. Anal., 24, 424–435 (2013).
- 29) Ossipov V., Salminen J. P., Ossipova S., Haukioja E., Pihlaja K., Biochem. Syst. Ecol., 31, 3–16 (2003).
- 30) Kambourakis S., Draths K. M., Frost J. W., J. Am. Chem. Soc., 122, 9042–9043 (2000).
- 31) García-Conesa M. T., Østergaard P., Kauppinen S., Williamson G., Carbohydr. Polym., 44, 319–324 (2001).