Experimental
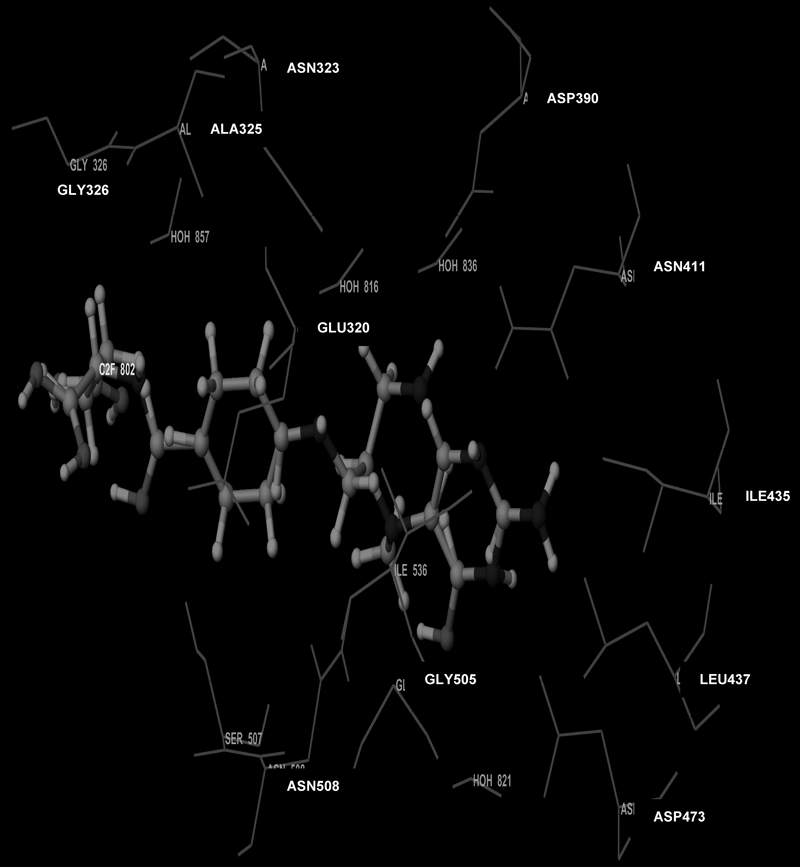
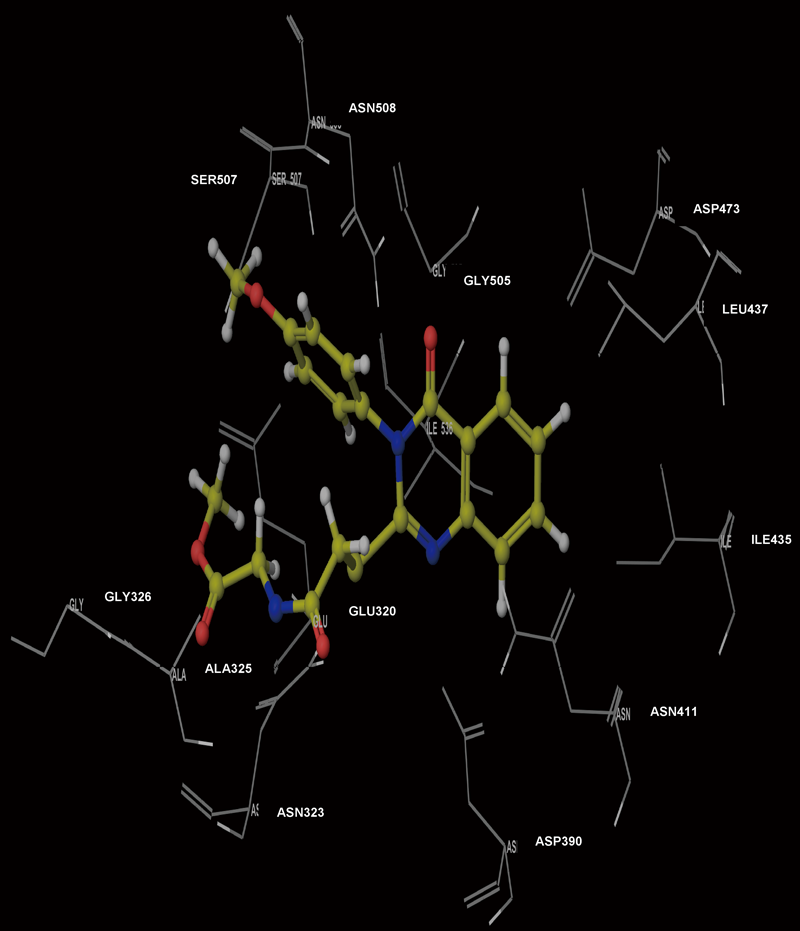
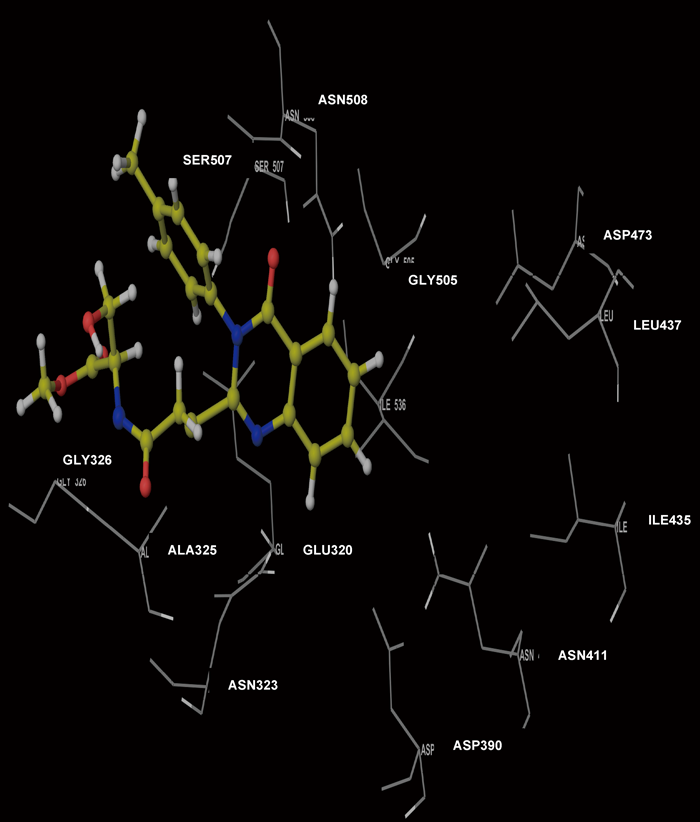
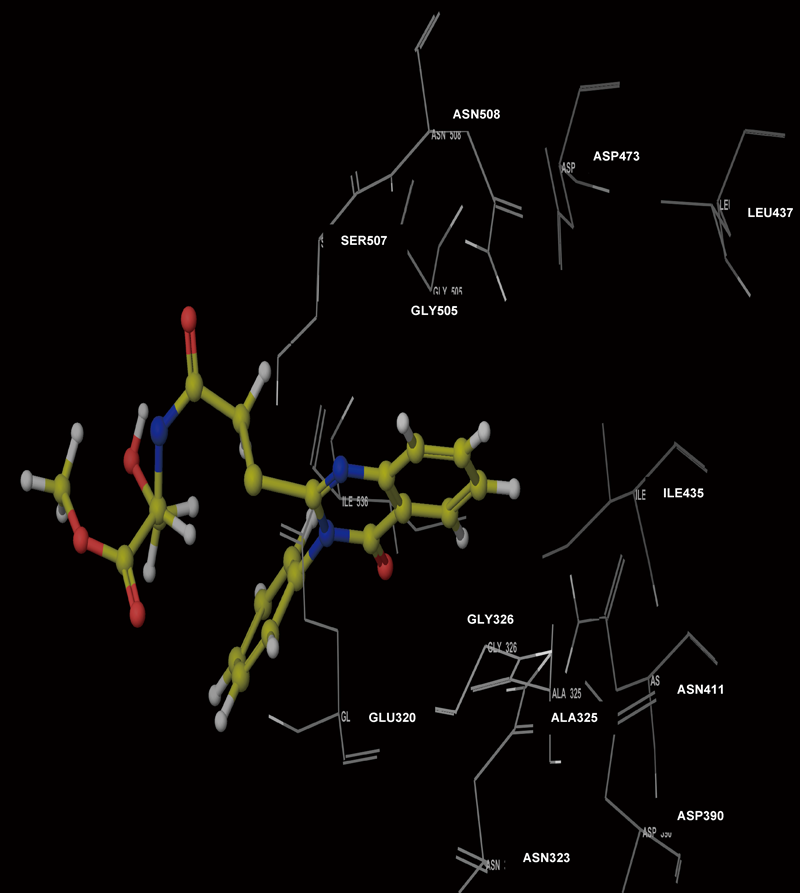
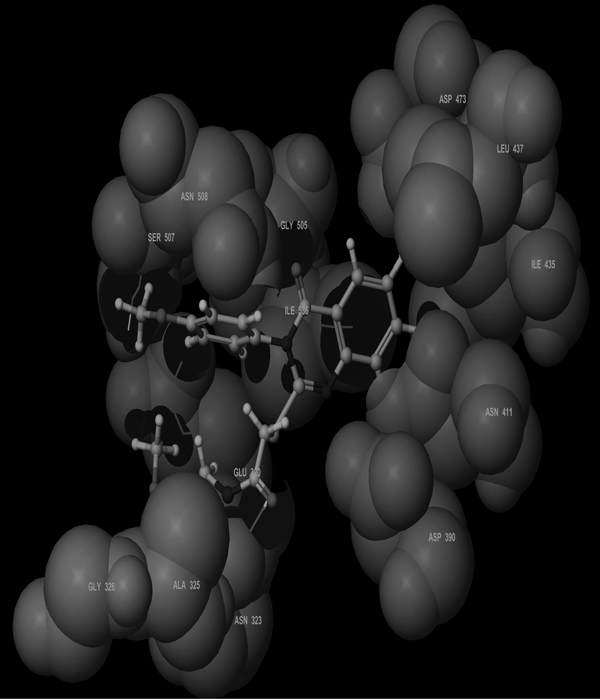
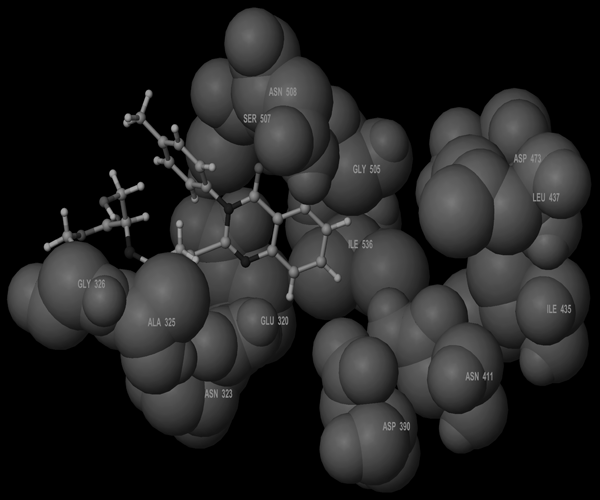
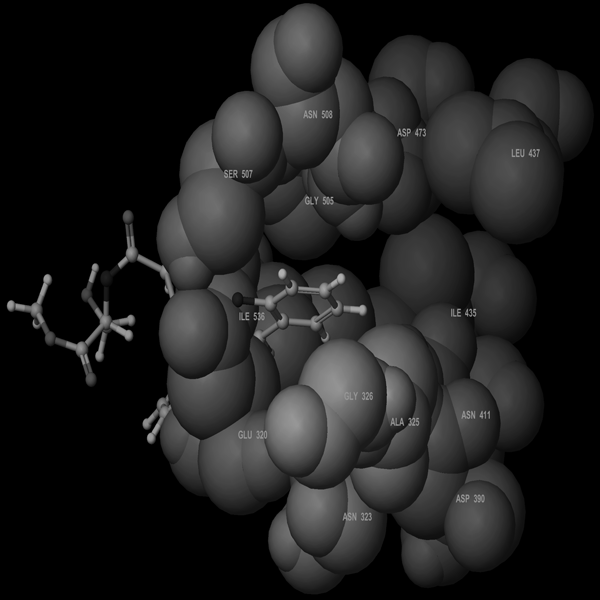
Molecular Modeling ProcedureMolecular modeling was carried out on Schrodinger computational software workstation using Maestro 9.3 graphic user interface (GUI) and Red Hat Linux nash Enterprise version V 4.1.18 on Batchmin V 9.3 modeling engine. The atomic coordinates for the polypeptide segments of MTHF and Hcy binding domains of MetS enzyme extracted from human liver were obtained from the protein bank database PDB (Brookhaven protein database (PDB: 1Q8J)). Explicit calcium ion counter ions were included instead of cadmium and positioned at a 4 Å distance from the homocysteine binding site. The basic and acidic amino acids were neutralized at pH 7±2 by protonation of the terminal amino groups and basic amino acids such as histidine, lysine and arginine. Moreover, the terminal carboxylic acid groups of amino acids and acidic amino acids such as glutamic acid, aspartic acid, asparagine and glutamine were deprotonated. Prime 3.1 was used to check the energy content of the protein segments and loops. The docking process involved the standard precision docking (SP) in which ligand poses that were expected to have unfavourable energies would be rejected from the conditioned set up of the hierarchal filter. The presumption is that only active compounds will have available poses that avoid these penalties. SP docking is appropriate for screening ligands of unknown quality in large numbers. SP is a soft docking programme that was adept at identifying ligands that have a reasonable propensity to bind and 20% of the final poses produced from the SP docking were subjected to the Extra Precision mode of Glide docking (XP) to perform the more expensive docking simulation on worthwhile poses. XP docking mode is harder than SP docking mode in that it penalizes the poses that violate established charges. Flexible docking was selected to generate conformations of all possible ligand poses, which is more realistic as this occurs in reality because the protein undergoes side chain and back bone movement or both, upon ligand binding. Five and six-membered rings were allowed to flip and amide bonds which were not cis or trans configuration were penalised. Five thousand poses per ligand for the initial phase of docking with a scoring window for keeping poses of 100 kJ/mol were set up. The best poses which fulfil those conditions were subjected to energy minimization on the OPLS-AA nonbonded-interaction grid with a distance dielectric constant of 2 and maximum number of conjugate gradient steps of 10000 iterations. The ligands of the poses selected by the initial screening were subsequently minimized in the field of the receptor using a standard molecular mechanics energy function (OPLS-AA force field) in conjunction with a distance-dependant dielectric model. Finally, the lowest energy poses obtained in this fashion were subjected to a Monte Carlo procedure that examines nearby torsion minima. The complex was minimized using the conjugate gradients algorithm until an energy convergence criterion of 0.1 kJ/mol was reached with iteration cycle of 10000. Molecular dynamics (MD) at 300 K were then performed on the solvated system for a 50 ps equilibration and 300 ps of production employing a 1 fs time step using OPLS 2005 force field, from which 100 structures were sampled at 1 ps intervals and averaged. The final averaged structure was then finally minimized.21)
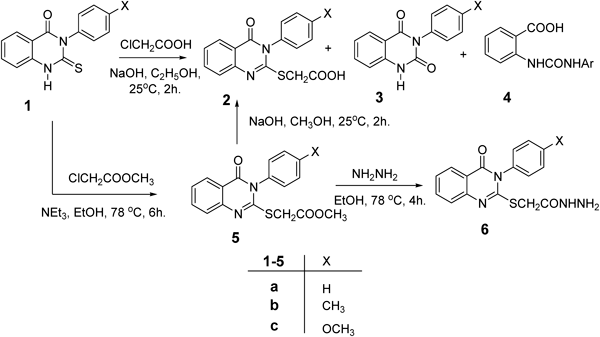
Experimental Procedure. General ProceduresSolvents were purified and dried in the usual way. The boiling range of the petroleum ether used was 40–60°C. Thin layer chromatography (TLC): silica gel 60 F254 plastic plates (E. Merck, layer thickness 0.2 mm) detected by UV absorption. Melting points were determined on a Buchi 510 melting-point apparatus and the values are uncorrected. NMR spectra measured with Bruker AC 250 (250 MHz). Tetramethylsilane (TMS) (0.00 ppm) as internal standard. Mass spectra were measured on a GC-MSQP 1000EX Shimadzu. Elemental analyses were performed on a Flash EA-1112 instrument at the Microanalytical laboratory, Faculty of Science, Suez Canal University, Ismailia, Egypt. Quinazoline derivatives 1, 5, 6 were prepared according to the method described in literature.17,22,23)
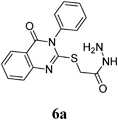
General Preparation of 2-(3-Aryl-4-oxo-3,4-dihydroquinazolin-2-ylthio)acetohydrazide (6)To a solution of ester 5a (0.33 g, 1.0 mmol) in methyl alcohol (30 mL), hydrazine hydrate (2.4 mL, 5 mmol) was added. The reaction mixture was refluxed for 4 h, cooled and the resultant precipitate was filtered off, washed with ethanol and ether then crystallized from aqueous ethanol to yield the hydrazide 6. White crystals (0.29 g, 89%); mp 195–196°C. 1H-NMR (300 MHz, dimethylsulfoxide (DMSO)) δ: 9.14 (1H, s, NH), 8.72 (2H, d, J=8.0 Hz, ArH), 8.55 (1H, d, J=8.0 Hz, ArH), 8.15–8.11 (1H, m, ArH), 7.79–7.66 (2H, m, ArH), 7.68–7.61 (3H, m, ArH), 4.21 (2H, s, SCH2CO), 1.92 (2H, m, NH2). Anal. Calcd for C16H14N4O2S (326.4): C, 58.88; H, 4.32; N, 17.17 Found: C, 58.73; H, 4.28; N, 17.03.
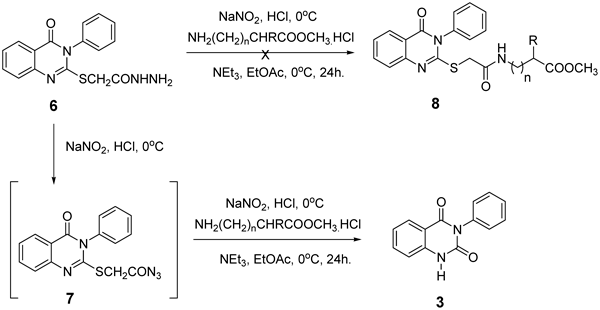
General Preparation of 3-Phenylaryl Quinazoline-2,4(1H,3H)-dione (3)To a cold solution (−5°C) of hydrazide 6 (0.33g, 1.0 mmol) in AcOH (6 mL), 1 N HCl (3 mL), and water (25 mL) was added a solution of NaNO2 (0.34 g, 5.0 mmol) in cold water (3 mL). After stirring at −5°C for 1 h. a thick precipitate was formed. The reaction mixture was extracted in cold ethyl acetate (30 mL), washed with cold 3% NaHCO3, H2O and finally dried (Na2SO4). A solution of amino acid esters hydrochloride (1.0 mmol) in ethyl acetate (20 mL) containing 0.2 mL of triethyl amine was added to the azide solution. The mixture was kept at −5°C for 24 h, then at 25°C for another 24 h, followed by washing with 0.5 N HCl, water, 3% solution of NaHCO3 and finally dried (Na2SO4). The solution was evaporated to dryness, and the residue was recrystallized from petroleum ether–ethyl acetate to give the corresponding quinazoline dione 3a. White crystals (0.31 g, 88%); mp 235–236°C. 1H-NMR (300 MHz, DMSO) δ: 11.31 (1H, s, NH), 7.93 (1 H, d, J=7.8 Hz, ArH), 7.65–7.51 (1H, d, J=8.0 Hz, ArH), 7.45–7.41 (3H, m, ArH), 7.27–7.15 (4H, m, ArH). Anal. Calcd for C14H10N2O2 (238.2): C, 70.58; H, 4.23; N, 11.76. Found: C, 70.45; H, 4.11; N, 11.53.
General Preparation of 2-(3-Aryl-4-oxo-3,4-dihydroquinazolin-2-ylthio)acetic Acid (2)To a solution ester 5a–c (1.0 mmol) in methyl alcohol (30 mL), was added sodium hydroxide (0.112 g, 2.0 mmol) solution in 10 mL H2O. The reaction mixture was stirred for 3 h till complete consumption of the ester (monitored by TLC). The reaction mixture was evaporated under reduced pressure, diluted with water and acidified by 1 N HCl to pH 3. The separated whitish ppt was filtered off and washed several times with water, dried and crystallized by DMF–H2O.
2-(4-Oxo-3-phenyl-3,4-dihydroquinazolin-2-ylthio)acetic Acid (2a): White crystals (0.31 g, 88%); mp 245–246°C. 1H-NMR (300 MHz, DMSO) δ: 8.01 (1H, d, J=8.1 Hz, ArH), 7.78 (1H, t, J=8.3 Hz, ArH), 7.61–7.55 (4H, m, ArH), 7.48–7.42 (3H, m, ArH), 4.18 (2H, s, SCH2CO). Anal. Calcd for C16H12N2O3S (312.3): C, 61.53; H, 3.87; N, 8.97; S, 10.27. Found: C, 61.48; H, 3.65; N, 8.81.
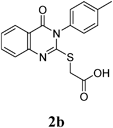
2-(4-Oxo-3-p-tolyl-3,4-dihydroquinazolin-2-ylthio)acetic Acid (2b): White crystals (0.31 g, 88%); mp 235–236°C. 1H-NMR (300 MHz, DMSO) δ: 8.03 (1H, d, J=8.1 Hz, ArH), 7.91 (1H, t, J=8.1 Hz, ArH), 7.49 (2H, d, J=8.0 Hz, ArH), 7.47–7.30 (4H, m, ArH), 4.16 (2H, s, SCH2CO), 2.41 (3H, s, CH3). Anal. Calcd for C17H14N2O3S (326.4): C, 62.56; H, 4.32; N, 8.58; S, 9.82. Found: C, 62.43; H, 4.15; N, 8.38.
2-(3-(4-Methoxyphenyl)-4-oxo-3,4-dihydroquinazolin-2-ylthio)acetic Acid (2c): White crystals (0.31 g, 88%); mp 235–236°C. 1H-NMR (300 MHz, DMSO) δ: 8.03 (1H, d, J=8.0 Hz, ArH), 7.78 (1H, t, J=7.8 Hz, ArH), 7.59 (1H, d, J=7.8 Hz, ArH), 7.45 (1H, t, J=7.9 Hz, ArH), 7.33 (2H, d, J=8.7 Hz, ArH), 7.19 (2H, d, J=8.7 Hz, ArH), 4.21 (2H, s, SCH2CO), 3.85 (2H, s, OCH3). Anal. Calcd for C17H14N2O4S (342.4): C, 59.64; H, 4.12; N, 8.18; S, 9.37. Found: C, 59.58; H, 4.01; N, 8.13.
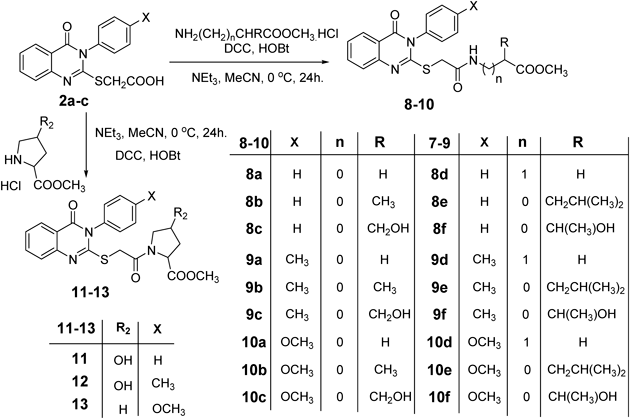
General Preparation of Methyl 2-(2-(4-Oxo-3-aryl-3,4-dihydroquinazolin-2-ylthio)acetamido)alkanoates (8–13)To a cold solution (−5°C) of the amino acid methyl ester hydrochloride (1.0 mmol) in acetonitrile (6 mL) containing triethyl amine (0.14 mL, 1.0 mmol), 2-(3-aryl-4-oxo-3,4-dihydroquinazolin-2-ylthio)acetic acid 2a–c (1.0 mmol), dicyclohexyl-carbodiimide (DCC) (0.207 g, 1.0 mmol) and hydroxybenzotriazole (HOBT) (0.135 g, 1.0 mmol) were added successively. The reaction mixture was stirred at 0°C for one hour, at 5°C for one hour, then at room temperature for 8 h. The reaction mixture was set aside overnight. The precipitated dicyclohexylurea was filtered off and the filtrate was evaporated under reduced pressure. The residue was dissolved in ethyl acetate, filtered and the filtrate was washed with 5% NaHCO3, 1 N HCl and saturated solution of sodium chloride then dried over anhydrous sodium sulphate. After evaporation of the solvent, the remaining oily residue was triturated with petroleum ether (bp 40–60°C) at 0°C with scratching, afterwards the formed solid was filtered off and crystallized from petroleum ether–ethyl acetate.
Methyl 2-(2-(4-Oxo-3-phenyl-3,4-dihydroquinazolin-2-ylthio)acetamido)acetate (8a): From GlyOCH3·HCl (0.126 g). White crystals (0.29 g, 77%); mp 234–235°C. 1H-NMR (300 MHz, DMSO) δ: 8.61 (1H, t, J=5.7 Hz, NH), 8.04 (1H, d, J=7.8 Hz, ArH), 7.82 (1H, t, J=8.1 Hz, ArH), 7.62–7.55 (4H, m, ArH), 7.48–7.43 (3H, m, ArH), 3.92 (2H, s, SCH2), 3.84 (2H, d, J=5.7 Hz, NCH2), 3.57 (3H, s, OCH3). 13C-NMR (CDCl3) δ: 170.52 (C=O), 167.79 (C=O), 161.16 (Cq), 157.17 (Cq), 135.77 (Cq), 135.36 (CHAr), 130.46 (CHAr), 130.01 (CHAr), 129.91 (CHAr), 127.00 (CHAr), 126.62 (CHAr), 120.00 (Cq), 52.21 (OCH3), 41.44 (CH2), 36.23 (SCH2). Anal. Calcd for C19H17N3O4S (383.4): C, 59.52%; H, 4.47%; N, 10.96%; S, 8.36%. Found: C, 59.44%; H, 4.39%; N, 10.86%. Mass spectrum, m/z (Ir/%): 383.1.
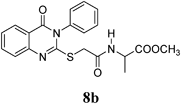
Methyl 2-(2-(4-Oxo-3-phenyl-3,4-dihydroquinazolin-2-ylthio)acetamido)propanoate (8b): From L-AlaOCH3·HCl (0.14 g). White crystals (0.21 g, 54%); mp 120–121°C. 1H-NMR (300 MHz, CDCl3) δ: 8.68 (1H, d, J=7.2 Hz, NH), 8.09 (1H, d, J=8.1 Hz, ArH), 7.85 (1H, t, J=8.1 Hz, ArH), 7.62–7.48 (4H, m, ArH), 7.46–7.44 (3H, m, ArH), 4.31–4.27 (1H, m, CH), 3.92 (2H, s, SCH2), 3.59 (3H, s, OCH3), 1.33 (3H, d, J=7.2 Hz, CH3). Anal. Calcd for C20H19N3O4S (397.4): C, 60.44%; H, 4.82%; N, 10.57%; S, 8.07%. Found: C, 60.38%; H, 4.73%; N, 10.45%.
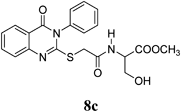
Methyl 3-Hydroxy-2-(2-(4-oxo-3-phenyl-3,4-dihydroquinazolin-2-ylthio)acetamido)propanoate (8c): From L-SerOCH3·HCl (0.156 g). White crystals (0.28 g, 68%); mp 200–201°C. 1H-NMR (300 MHz, DMSO) δ: 8.59 (1H, d, J=7.8 Hz, NH), 8.05 (1H, d, J=8.1 Hz, ArH), 7.82 (1H, t, J=8.3 Hz, ArH), 7.61–7.55 (4H, m, ArH), 7.48–7.42 (3H, m, ArH), 5.07 (1H, t, J=5.7 Hz, OH, D2O exchangeable), 4.37–4.31 (1H, m, CH), 3.93 (2H, s, SCH2), 3.69–3.55 (5H, m, OCH2, OCH3). 13C-NMR (CDCl3) δ: 170.81 (C=O), 166.95 (C=O), 160.63 (Cq), 156.85 (Cq), 147.14 (Cq), 135.77 (Cq), 134.85 (CHAr), 129.95 (CHAr), 129.38 (CHAr), 129.55 (CHAr), 126.50 (CHAr), 125.99 (CHAr), 119.49 (Cq), 61.25 (OCH2), 53.83 (OCH3), 51.47 (CH), 36.48 (SCH2), Anal. Calcd for C20H19N3O5S (413.4): C, 58.10%; H, 4.63%; N, 10.16%; S, 7.76%. Found: C, C, 57.94% ; H, 4.56%; N, 9.96%;. Mass spectrum, m/z (Ir/%): 413.2.
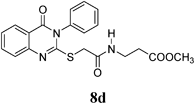
Methyl 3-(2-(4-Oxo-3-phenyl-3,4-dihydroquinazolin-2-ylthio)acetamido)propanoate (8d): From β-AlaOCH3·HCl (0.14 g). White crystals (0.29 g, 73%); mp 110–111°C. 1H-NMR (300 MHz, CDCl3) δ: 8.25 (1H, t, J=7.2 Hz, NH), 8.05 (1H, d, J=8.1 Hz, ArH), 7.79 (1H, t, J=8.1 Hz, ArH), 7.67–7.47 (4H, m, ArH), 7.46–7.34 (3H, m, ArH), 3.93 (2H, s, SCH2), 3.52 (3H, m, OCH2, OCH3), 3.30 (2H, q, J=6.4 Hz, NCH2), 2.46 (2H, t, J=6.6 Hz, CH2), Anal. Calcd for C20H19N3O4S (397.4): C, 60.44%; H %, 4.82%; N, 10.57%; S, 8.07%. Found: C, 60.36%; H %, 4.70%; N, 10.49%.
Methyl 4-Methyl-2-(2-(4-oxo-3-phenyl-3,4-dihydroquinazolin-2-ylthio)acetamido)pentanoate (8e): From L-LeuOCH3·HCl 0.182 g) and 8. White crystals (0.23 g, 54%); mp 215–216°C. 1H-NMR (300 MHz, CDCl3) δ: 8.57 (1H, d, J=7.8 Hz, NH), 8.04 (1H, d, J=7.8 Hz, ArH), 7.91 (1H, t, J=8.0 Hz, ArH), 7.83–7.66 (4H, m, ArH), 7.53–7.30 (3H, m, ArH), 4.30–4.25 (1H, m, CH), 3.93 (1H, d, J=15.0 Hz, SCH2), 3.87 (1H, d, J=15.0 Hz, SCH2), 3.55 (3H, s, OCH3), 1.68–1.45 (2H, m, CH2), 1.22–1.13 (1H, m, CH), 0.97 (6H, d, J=6.0 Hz, 2CH3), 13C-NMR (CDCl3) δ: 173.17 (C=O), 167.29 (C=O), 161.08 (Cq), 157.29 (Cq), 147.61 (Cq), 136.23 (Cq), 135.26 (CHAr), 130.41 (CHAr), 129.89 (CHAr), 129.52 (CHAr), 127.01 (CHAr), 126.46 (CHAr), 122.93 (CHAr), 119.96 (Cq), 52.31 (CH), 51.02 (OCH3), 41.78 (CH2), 36.37 (SCH2), 24.63 (CH), 23.15 (CH3), 21.69 (CH3). Anal. Calcd for C23H25N3O4S (439.5): C, 62.85%; H, 5.73%; N, 9.56%; S, 6.92. Found: C, 62.81%; H, 5.67%; N, 9.54%.
Methyl 3-Hydroxy-2-(2-(4-oxo-3-phenyl-3,4-dihydroquinazolin-2-ylthio)acetamido)butanoate (8f): From L-ThrOCH3·HCl (0.156 g). White crystals (0.31 g, 74%); mp 155–156°C. 1H-NMR (300 MHz, CDCl3) δ: 8.37 (1H, d, J=8.4 Hz, NH), 8.09 (1H, d, J=7.8 Hz, ArH), 7.83 (1H, t, J=8.0 Hz, ArH), 7.65–7.58 (4H, m, ArH), 7.51–7.44 (3H, m, ArH), 5.07 (1H, d, J=5.1 Hz, OH, D2O exchangeable), 4.31–4.27 (1H, m, CH), 4.07–4.02 (3H, m, SCH2, CH), 3.59 (3H, s, OCH3), 1.04 (3H, d, J=6.3 Hz, CH3), Anal. Calcd for C21H21N3O5S, (427.5): C, 59.00%; H, 4.95%; N, 9.83%; S, 7.50%. Found: C, 58.87%; H, 4.91%; N, 9.69%. Mass spectrum, m/z (Ir/%): 428.1.
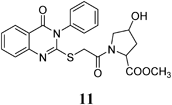
Methyl 4-Hydroxy-1-(2-(4-oxo-3-phenyl-3,4-dihydroquinazolin-2-ylthio)acetyl)pyrrolidine-2-carboxylate (11): From L-HOPrlOCH3·HCl (0.156 g). White crystals (0.16 g, 38%); mp 103–104°C. 1H-NMR (300 MHz, DMSO) δ: 8.05 (1H, d, J=7.8 Hz, NH), 7.81 (1H, t, J=7.8 Hz, ArH), 7.65 (1H, d, J=8.0 Hz, ArH), 7.62–7.56 (4H, m, ArH), 7.47–7.42 (3H, m, ArH), 5.30 (1H, d, J=6.0 Hz, CH), 4.42 (1H, br s, OH, D2O exchangeable), 4.31 (1H, t, J=7.8 Hz, CH), 4.11 (1H, d, J=15.6 Hz, SCH2), 3.98 (1H, d, J=15.6 Hz, SCH2), 3.75–3.66 (2H, m, CH2), 3.52 (3H, s, OCH3), 2.19–1.96 (2H, m, CH2). 13C-NMR (CDCl3) δ: 172.58 (C=O), 166.25 (C=O), 161.13 (Cq), 157.21 (Cq), 147.67 (Cq), 136.27 (Cq), 135.32 (CHAr), 130.48 (CHAr), 130.04 (CHAr), 129.87 (CHAr), 126.97 (CHAr), 126.65 (CHAr), 126.49 (CHAr), 119.93 (Cq), 69.42 (CH), 58.33 (OCH3), 55.66 (SCH2), 52.25 (CH), 37.84 (CH2), 36.54 (CH2). Anal. Calcd for C22H21N3O5S (439.5): C, 60.12%; H, 4.82%; N, 9.56%; S, 7.30%. Found: C, 60.03%; H, 4.78%; N, 9.45%.
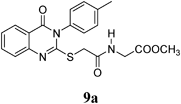
Methyl 2-(2-(4-oxo-3-p-tolyl-3,4-dihydroquinazolin-2-ylthio)acetamido)acetate (9a): From GlyOCH3·HCl (0.126 g). White crystals (0.23 g, 58%); mp 165–166°C. 1H-NMR (300 MHz, DMSO) δ: 8.60 (1H, t, J=7.2 Hz, NH), 8.04 (1H, d, J=8.1 Hz, ArH), 7.84 (1H, t, J=8.1 Hz, ArH), 7.63 (2H, d, J=8.0 Hz, ArH), 7.50 (1H, t, J=8.1 Hz, ArH), 7.47–7.30 (3H, m, ArH), 3.93 (2H, s, SCH2), 3.86 (2H, d, J=5.7 Hz, NCH2), 3.60 (3H, s, OCH3), 2.42 (3H, s, CH3). Anal. Calcd for C20H19N3O4S (397.4): C, 60.44%; H, 4.82%; N, 10.57%; S, 8.07%. Found: C, 60.15%; H, 4.63%; N, 10.43%. Mass spectrum, m/z (Ir/%): 397.2.
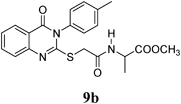
Methyl 2-(2-(4-Oxo-3-p-tolyl-3,4-dihydroquinazolin-2-ylthio)acetamido)propanoate (9b): From L-AlaOCH3·HCl (0.14 g). White crystals (0.19 g, 48%); mp 165–166°C. 1H-NMR (300 MHz, CDCl3) δ: 8.68 (1H, d, J=7.2 Hz, NH), 8.06 (1H, d, J=8.1 Hz, ArH), 7.84 (1H, t, J=8.1 Hz, ArH), 7.60 (1H, d, J=8.1 Hz, ArH), 7.47 (1H, t, J=8.1 Hz, ArH), 7.37 (2H, d, J=8.7 Hz, ArH), 7.31 (2H, d, J=8.7 Hz, ArH), 4.37–4.25 (1H, m, CH), 3.90 (1H, s, SCH2), 3.59 (3H, s, OCH3), 2.41 (3H, s, CH3), 1.28 (3H, d, J=7.2 Hz, CH3). Anal. Calcd for C21H21N3O4S (411.5): C, 61.30%; H, 5.14%; N, 10.26%; S, 7.79%. Found: C, 61.21%; H, 5.08%; N, 10.18%.
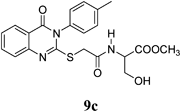
Methyl 3-Hydroxy-2-(2-(4-oxo-3-p-tolyl-3,4-dihydroquinazolin-2-ylthio)acetamido)propanoate (9c): From L-SerOCH3·HCl (0.156 g). White crystals (0.27 g, 65%); mp 152–153°C. 1H-NMR (300 MHz, CDCl3) δ: 8.59 (1H, d, J=7.2 Hz, NH), 8.09 (1H, d, J=7.8 Hz, ArH), 7.86 (1H, t, J=8.1 Hz, ArH), 7.61 (1H, d, J=7.8 Hz, ArH), 7.47 (1H, t, J=8.1 Hz, ArH), 7.38 (2H, d, J=8.1 Hz, ArH), 7.31 (2H, d, J=8.1 Hz, ArH), 5.08 (1H, br s, OH, D2O exchangeable), 4.37–4.33 (1H, m, CH), 3.94 (1H, s, SCH2), 3.70–3.57 (5H, m, CH2, OCH3), 2.41 (3H, s, CH3). Anal. Calcd for C21H21N3O5S (427.5): C, 59.00% ; H, 4.95%; N, 9.83%; S, 7.50%. Found: C, 58.73%; H, 4.85%; N, 9.69%. Mass spectrum, m/z (Ir/%): 428.1.
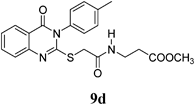
Methyl 3-(2-(4-Oxo-3-p-tolyl-3,4-dihydroquinazolin-2-ylthio)acetamido)propanoate (9d): From β-AlaOCH3·HCl (0.14 g). White crystals (0.29 g, 71%); mp 160–161°C. 1H-NMR (300 MHz, DMSO) δ: 8.23 (1H, t, J=7.2 Hz, NH), 8.07 (1H, d, J=7.8 Hz, ArH), 7.83 (1H, t, J=7.8 Hz, ArH), 7.55 (2H, d, J=8.0 Hz, ArH), 7.49 (1H, t, J=7.8 Hz, ArH), 7.46 (1H, d, J=8.0 Hz, ArH), 7.30 (2H, d, J=8.0 Hz, ArH), 3.81 (2H, s, SCH2), 3.55 (3H, s, OCH3), 3.42–3.32 (2H, m, NCH2), 2.52 (2H, t, J=7.1 Hz, CH2), 2.42 (3H, s, CH3). Anal. Calcd for C21H21N3O4S (411.5): C, 61.30%; H %, 5.14%; N, 10.21%; S, 7.79%. Found: C, 61.28%; H %, 5.06%; N, 10.17%.
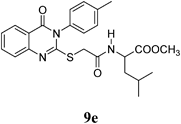
Methyl 4-Methyl-2-(2-(4-oxo-3-p-tolyl-3,4-dihydroquinazolin-2-ylthio)acetamido)pentanoate (9e): From L-LeuOCH3·HCl 0.182 g). White crystals (0.25 g, 56%); mp 159–160°C. 1H-NMR (300 MHz, CDCl3) δ: 8.65 (1H, d, J=7.2 Hz, NH), 8.03 (1H, d, J=8.1 Hz, ArH), 7.86 (1H, t, J=7.8 Hz, ArH), 7.60 (1H, d, J=7.8 Hz, ArH), 7.49 (1H, t, J=8.1 Hz, ArH), 7.44 (2H, d, J=8.1 Hz, ArH), 7.32 (2H, d, J=8.1 Hz, ArH), 4.36–4.21 (1H, m, CH), 3.92 (1H, d, J=14.4 Hz, SCH2), 3.59 (3H, s, OCH3), 3.83 (1H, d, J=14.4 Hz, SCH2), 2.41 (3H, s, CH3), 1.63–1.45 (2H, m, CH2), 0.97–0.95 (1H, m, CH), 0.84 (6H, d, J=7.2 Hz, 2CH3). Anal. Calcd for C24H27N3O4S (453.6): C, 63.56%; H, 6.00%; N, 9.26%; S, 7.07. Found: C, 63.49%; H, 5.93%; N, 9.14%.
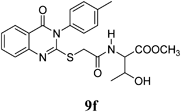
Methyl 3-Hydroxy-2-(2-(4-oxo-3-p-tolyl-3,4-dihydroquinazolin-2-ylthio)acetamido)butanoate (9f): From L-ThrOCH3·HCl (0.156 g). White crystals (0.17 g, 41%); mp 174–175°C. 1H-NMR (300 MHz, CDCl3) δ: 8.74 (2H, d, J=8.0 Hz, ArH), 8.58 (1H, d, J=8.0 Hz, ArH), 8.18 (1H, d, J=8.0 Hz, ArH), 7.94 (1H, d, J=8.0 Hz, NH), 7.69–7.59 (2H, m, ArH), 7.58–7.55 (3H, m, ArH), 5.12 (1H, br s, OH, D2O exchangeable), 4.65 (1H, d, J=6.0 Hz, CH), 4.34–4.13 (3H, m, SCH2, CH), 3.71 (3H, s, OCH3), 1.42 (3H, d, J=7.2 Hz, CH3), Anal. Calcd for C22H23N3O5S, (441.5): C, 59.85%; H, 5.25%; N, 9.52%; S, 7.26%. Found: C, 59.77%; H, 5.18%; N, 9.46%. Mass spectrum, m/z (Ir/%): 442.1.
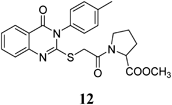
Methyl 4-Hydroxy-1-(2-(4-oxo-3-p-tolyl-3,4-dihydroquinazolin-2-ylthio)acetyl)pyrrolidine-2-carboxylate (12): From L-HOPrlOCH3·HCl (0.156 g). White crystals (0.30 g, 67%); mp 201–202°C. 1H-NMR (300 MHz, CDCl3) δ: 8.08 (1H, d, J=7.8 Hz, ArH), 7.83 (1H, t, J=7.8 Hz, ArH), 7.67 (1H, d, J=7.8 Hz, ArH), 7.49 (1H, t, J=7.8 Hz, ArH), 7.47 (2H, d, J=8.1 Hz, ArH), 7.31 (2H, d, J=8.1 Hz, ArH), 5.31 (1H, d, J=5.3 Hz, CH), 4.43 (1H, br s, OH, D2O exchangeable), 4.30 (1H, d, J=6.0 Hz, CH), 3.81–3.72 (2H, m, SCH2, CH2), 3.58 (3H, s, OCH3), 2.41 (3H, s, CH3), 2.06–1.69 (2H, m, CH2). Anal. Calcd for C23H23N3O5S (453.5): C, 60.91%; H, 5.11%; N, 9.27%; S, 7.07%. Found: C, 60.76%; H, 5.04%; N, 9.16%.
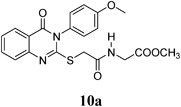
Methyl 2-(2-(3-(4-Methoxyphenyl)-4-oxo-3,4-dihydroquinazolin-2-ylthio)acetamido)acetate (10a): From GlyOCH3·HCl (0.126 g). White crystals (0.23 g, 57%); mp 188–189°C. 1H-NMR (300 MHz, DMSO) δ: 8.60 (1H, t, J=7.2 Hz, NH), 8.08 (1H, d, J=8.1 Hz, ArH), 7.82 (1H, t, J=8.1 Hz, ArH), 7.61 (1H, d, J=8.1 Hz, ArH), 7.50 (1H, t, J=8.1 Hz, ArH), 7.36 (2H, d, J=9.0 Hz, ArH), 7.11 (2H, d, J=9.0 Hz, ArH), 3.93 (2H, s, SCH2), 3.87–3.84 (5H, m, NCH2, OCH3), 3.60 (3H, s, OCH3). Anal. Calcd for C20H19N3O5S (413.4): C, 58.10%; H, 4.63%; N, 10.16%; S, 7.76%. Found: C, 57.85%; H, 4.51%; N, 10.01%. Mass spectrum, m/z (Ir/%): 413.2.
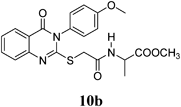
Methyl 2-(2-(3-(4-Methoxyphenyl)-4-oxo-3,4-dihydroquinazolin-2-ylthio)acetamido)propanoate (10b): From L-AlaOCH3·HCl (0.14 g). White crystals (0.14 g, 34%); mp 130–131°C. 1H-NMR (300 MHz, CDCl3) δ: 8.65 (1H, d, J=6.9 Hz, NH), 8.07 (1H, d, J=8.1 Hz, ArH), 7.84 (1H, t, J=8.1 Hz, ArH), 7.59 (1H, d, J=8.1 Hz, ArH), 7.48 (1H, t, J=8.1 Hz, ArH), 7.36 (2H, d, J=8.7 Hz, ArH), 7.11 (2H, d, J=8.7 Hz, ArH), 4.31–4.26 (1H, m, CH), 3.91 (2H, s, SCH2), 3.85 (2H, s, OCH3), 3.59 (3H, s, OCH3), 1.28 (3H, d, J=7.2 Hz, CH3). Anal. Calcd for C21H21N3O5S (427.5): C, 59.00%; H, 4.95%; N, 9.83%; S, 7.50%. Found: C, 58.91%; H, 4.73%; N, 9.65%.
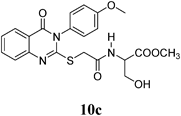
Methyl 3-Hydroxy-2-(2-(3-(4-methoxyphenyl)-4-oxo-3,4-dihydroquinazolin-2-ylthio)acetamido)propanoate (10c): From L-SerOCH3·HCl (0.156 g). White crystals (0.29 g, 66%); mp 192–193°C. 1H-NMR (300 MHz, DMSO) δ: 8.59 (1H, d, J=6.9 Hz, NH), 8.07 (1H, d, J=8.0 Hz, ArH), 7.83 (1H, t, J=8.1 Hz, ArH), 7.62 (1H, d, J=8.0 Hz, ArH), 7.46 (1H, t, J=8.0 Hz, ArH), 7.37 (2H, d, J=8.9 Hz, ArH), 7.12 (2H, d, J=8.9 Hz, ArH), 5.06 (1H, t, J=5.7 Hz, OH, D2O exchangeable), 4.34–4.26 (1H, m, CH), 3.94 (2H, s, SCH2), 3.85 (2H, s, OCH3), 3.68–3.60 (5H, m, OCH2, OCH3). Anal. Calcd for C21H21N3O6S (443.5): C, 56.87% ; H, 4.77%; N, 9.48%; S, 7.23%. Found: C, 56.85%; H, 4.76%; N, 9.45%. Mass spectrum, m/z (Ir/%): 443.2.
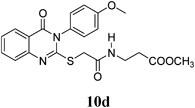
Methyl 3-(2-(3-(4-Methoxyphenyl)-4-oxo-3,4-dihydroquinazolin-2-ylthio)acetamido)propanoate (10d): From β-AlaOCH3·HCl (0.14 g). White crystals (0.32 g, 76%); mp 212–213°C. 1H-NMR (300 MHz, CDCl3) δ: 8.78 (1H, dt, J=7.2 Hz, NH), 8.02 (1H, d, J=8.0 Hz, ArH), 7.84 (1H, t, J=8.1 Hz, ArH), 7.58 (1H, d, J=8.0 Hz, ArH), 7.51 (1H, t, J=8.0 Hz, ArH), 7.38 (2H, d, J=8.9 Hz, ArH), 7.14 (2H, d, J=8.9 Hz, ArH), 4.22 (2H, s, SCH2), 3.59 (3H, s, OCH3), 3.54 (2H, q, J=6.6 Hz, NCH2), 2.54 (2H, t, J=6.4 Hz, CH2), 13C-NMR (CDCl3) δ: 172.19 (C=O), 167.29 (C=O), 161.14 (Cq), 157.35 (Cq), 147.56 (Cq), 136.26 (Cq), 135.37 (CHAr), 130.44 (CHAr), 129.89 (CHAr), 129.55 (CHAr), 127.04 (CHAr), 126.48 (CHAr), 119.99 (Cq), 51.82 (OCH3), 36.54 (SCH2), 35.34 (CH2), 33.91 (CH2), Anal. Calcd for C21H21N3O5S (427.5): C, 59.00%; H, 4.95%; N, 9.83%; S, 7.50%. Found: C, 58.81%; H %, 4.83%; N, 9.76%.
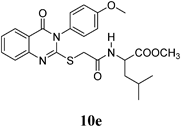
Methyl 2-(2-(3-(4-Methoxyphenyl)-4-oxo-3,4-dihydroquinazolin-2-ylthio)acetamido)-4-methylpentanoate (10e): From L-LeuOCH3·HCl 0.182 g. White crystals (0.23 g, 51%); mp 184–185°C. 1H-NMR (300 MHz, CDCl3) δ: 8.65 (1H, d, J=6.9 Hz, NH), 8.05 (1H, d, J=8.1 Hz, ArH), 7.82 (1H, t, J=8.1 Hz, ArH), 7.51 (1H, d, J=8.1 Hz, ArH), 7.45 (1H, t, J=8.1 Hz, ArH), 7.34 (2H, d, J=9.0 Hz, ArH), 7.12 (2H, d, J=9.0 Hz, ArH), 4.51–4.32 (1H, m, CH), 3.85 (2H, d, J=6.7 Hz, SCH2), 3.81 (3H, s, OCH3), 3.59 (3H, s, OCH3), 1.63–1.45 (2H, m, CH2), 1.21–1.13 (1H, m, CH), 0.83 (6H, d, J=6.0 Hz, 2CH3). Anal. Calcd for C24H27N3O5S (469.6): C, 61.39%; H, 5.80%; N, 8.95%; S, 6.83. Found: C, 61.43%; H, 5.64%; N, 8.81%.
Methyl 3-Hydroxy-2-(2-(3-(4-methoxyphenyl)-4-oxo-3,4-dihydroquinazolin-2-ylthio)acetamido)butanoate (10f): From L-ThrOCH3·HCl (0.156 g). White crystals (0.28 g, 62%); mp 180–181°C. 1H-NMR (300 MHz, CDCl3) δ: 8.36 (1H, d, J=8.7 Hz, NH), 8.08 (1H, d, J=8.1 Hz, ArH), 7.83 (1H, t, J=8.1 Hz, ArH), 7.60 (1H, d, J=8.1 Hz, ArH), 7.47 (1H, t, J=8.1 Hz, ArH), 7.34 (2H, d, J=9.0 Hz, ArH), 7.11 (2H, d, J=9.0 Hz, ArH), 5.01 (1H, d, J=5.4 Hz, OH, D2O exchangeable), 4.36 (1H, d, J=6.5 Hz, CH), 4.07–4.02 (3H, m, SCH2, CH), 3.85 (2H, s, OCH3), 3.60 (3H, s, OCH3), 1.03 (3H, d, J=6.3 Hz, CH3). Anal. Calcd for C22H23N3O6S (457.5): C, 57.76%; H, 5.07%; N, 9.18%; S, 7.01%. Found: C, 57.64%; H, 4.83%; N, 9.03%. Mass spectrum, m/z (Ir/%): 457.2.
Methyl 1-(2-(3-(4-Methoxyphenyl)-4-oxo-3,4-dihydroquinazolin-2-ylthio)acetyl)pyrrolidine-2-carboxylate (13): From L-PrlOCH3·HCl (0.156 g). White crystals (0.27 g, 61%); mp 220–221°C. 1H-NMR (300 MHz, DMSO) δ: 8.08 (1H, d, J=7.8 Hz, NH), 7.81 (1H, t, J=7.8 Hz, ArH), 7.68 (1H, d, J=8.0 Hz, ArH), 7.48 (1H, d, J=8.0 Hz, ArH), 7.33 (2H, d, J=9.0 Hz, ArH), 7.11 (2H, d, J=9.0 Hz, ArH), 5.17 (1H, d, J=6.0 Hz, CH), 4.46 (1H, br s, OH, D2O exchangeable), 4.30 (1H, t, J=7.8 Hz, CH), 4.11 (1H, d, J=15.6 Hz, SCH2), 3.99 (1H, d, J=15.6 Hz, SCH2), 3.85–3.73 (2H, s, CH2, OCH3), 3.54 (1H, t, J=7.8 Hz, CH), 3.54 (3H, s, OCH3), 2.18–2.08 (2H, m, CH2), 2.01–1.91 (2H, m, CH2). Anal. Calcd for C23H23N3O5S (453.5): C, 60.91%; H, 5.11%; N, 9.27%; S, 7.07%. Found: C, 60.77%; H, 5.07%; N, 9.13%.
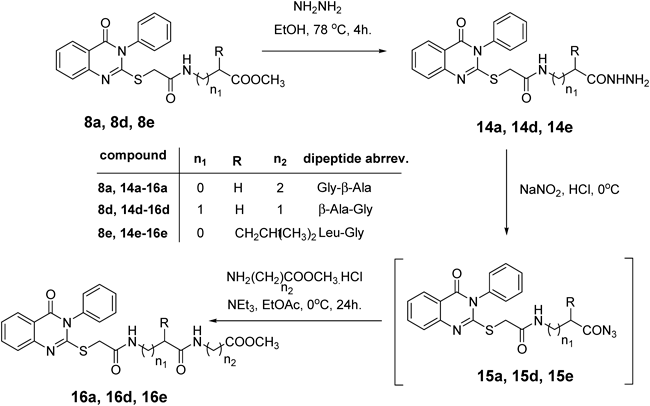
General Procedure for the Preparation of Thioacetyl Amino Acid Hydrazide (14a, 14d, 14e)To a solution of amino acide ester derivative 8a, 8d, 8e (1.0 mmol) in methyl alcohol (30 mL), hydrazine hydrate (2.4 mL, 5 mmol) was added. The reaction mixture was refluxed for 4 h, cooled and the resultant precipitate was filtered off, washed with ethanol and ether then crystallized from aqueous ethanol to yield the hydrazide 14a, 14d and 14e.
2-(2-(4-Oxo-3-phenyl-3,4-dihydroquinazolin-2-ylthio)acetamido)acetohydrazide (14a): White crystals (0.32 g, 83%); mp 185–186°C. 1H-NMR (300 MHz, DMSO) δ: 8.11 (1H, d, J=7.9 Hz, ArH), 8.03 (1H, d, J=8.0 Hz, ArH), 7.82 (1H, t, J=8.0 Hz, ArH), 7.61–7.52 (4H, m, ArH), 7.50–7.43 (2H, m, ArH), 5.13 (1H, t, J=6.1 Hz, NH), 4.25–4.18 (3H, m, NH, NH2), 3.93 (2H, s, SCH2), 3.87 (2H, s, NCH2). Anal. Calcd for C18H17N5O3S (383.4): C, 56.38%; H, 4.47%; N, 18.27%; S, 8.36%. Found: C, 56.17%; H, 4.38%; N, 18.12%.
3-(2-(4-Oxo-3-phenyl-3,4-dihydroquinazolin-2-ylthio)acetamido)propanehydrazide (14d): White crystals (0.28 g, 73%); mp 196–197°C. 1H-NMR (300 MHz, DMSO) δ: 8.05 (1H, d, J=8.0 Hz, ArH), 7.86 (1H, d, J=8.0 Hz, ArH), 7.83 (1H, t, J=8.0 Hz, ArH), 7.60–7.58 (4H, m, ArH), 7.47–7.45 (2H, m, ArH), 4.09 (2H, s, SCH2), 3.91 (1H, t, J=7.2 Hz, NH), 3.45–3.33 (5H, m, NHCH2, NH, NH2), 1.89 (2H, t, J=6.6 Hz, CH2). Anal. Calcd for C19H19N5O3S (397.5): C, 57.42%; H, 4.82%; N, 17.62%; S, 8.07%. Found: C, 57.32%; H, 4.76%; N, 17.55%.
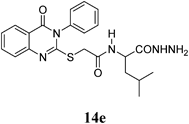
4-Methyl-2-(2-(4-oxo-3-phenyl-3,4-dihydroquinazolin-2-ylthio)acetamido)pentanehydrazide (14e): White crystals (0.40 g, 92%); mp 165–166°C. 1H-NMR (300 MHz, DMSO) δ: 9.15 (1H, br s, NH), 8.31 (1H, d, J=7.9 Hz, ArH), 8.05 (1H, d, J=8.1 Hz, ArH), 7.81 (1H, t, J=8.1 Hz, ArH), 7.58–7.55 (4H, m, ArH), 7.47–7.43 (2H, m, ArH), 4.25–4.18 (3H, m, CH, NH2), 3.96 (1H, d, J=15.0 Hz, SCH2), 3.87 (1H, d, J=15.0 Hz, SCH2), 1.54–1.39 (3H, m, CH, CH2), 0.80 (6H, d, J=6.0 Hz, 2CH3). 13C-NMR (CDCl3) δ: 171.29 (C=O), 166.87 (C=O), 161.12 (Cq), 157.47 (Cq), 147.62 (Cq), 136.28 (Cq), 135.34 (CHAr), 130.44 (CHAr), 130.02 (CHAr), 129.87 (CHAr), 127.02 (CHAr), 126.50 (CHAr), 119.96 (Cq), 50.47 (CH), 41.78 (SCH2), 36.63 (CH2), 24.59 (CH), 23.33 (CH3), 22.14 (CH3). Anal. Calcd for C22H25N5O3S (439.5): C, 60.12%; H, 5.73%; N, 15.93%; S, 7.30%. Found: C, 60.01%; H, 5.68%; N, 15.81%.
General Procedure of Quinazoline Thioacetyl Dipeptide (16a, 16d, 16e)To a cold solution (−5°C) of hydrazide 14a–c (1.0 mmol) in AcOH (6 mL), 1 N HCl (3 mL), and water (25 mL) was added a solution of NaNO2 (0.34 g, 5.0 mmol) in cold water (3 mL). After stirring at −5°C for 1 h. A thick precipitate was formed. The reaction mixture was extracted in cold ethyl acetate (30 mL), washed with cold 3% NaHCO3, H2O and finally dried (Na2SO4). A solution of amino acid esters hydrochloride (1.0 mmol) in ethyl acetate (20 mL) containing 0.2 mL of triethyl amine was added to the ethyl acetate azide solution 15a–c. The mixture was kept at −5°C for 24 h, then at 25°C for another 24 h, followed by washing with 0.5 N HCl, water, 3% solution of NaHCO3 and finally dried (Na2SO4). The solution was evaporated to dryness, and the residue was recrystallized from petroleum ether–ethyl acetate to give the corresponding quinazoline dipeptide 16a–c.
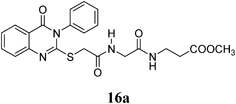
Methyl 3-(2-(2-(4-Oxo-3-phenyl-3,4-dihydroquinazolin-2-ylthio)acetamido)acetamido)propanoate (16a): White crystals (0.20 g, 46%); mp 130–131°C. 1H-NMR (300 MHz, CDCl3) δ: 8.43 (1H, t, J=6.9 Hz, NH), 8.09 (1H, d, J=8.0 Hz, ArH), 8.07–7.81 (2H, m, ArH), 7.64–7.57 (4H, m, ArH), 7.50–7.44 (2H, m, ArH), 3.92 (2H, s, SCH2), 3.66 (2H, d, J=5.9 Hz, NHCH2), 3.58 (3H, s, OCH3), 3.24 (2H, q, J=6.5 Hz, NCH2), 2.43 (2H, t, J=6.5 Hz, CH2). Anal. Calcd for C22H22N4O5S (454.5): C, 58.14%; H, 4.88%; N, 12.33%; S, 7.06%. Found: C, 57.89%; H, 4.72%; N, 12.22%.
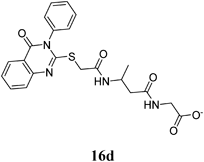
Methyl 2-(3-(2-(4-Oxo-3-phenyl-3,4-dihydroquinazolin-2-ylthio)acetamido)propanamido)acetate (16d): White crystals (0.19 g, 42%); mp 145–146°C. 1H-NMR (300 MHz, DMSO) δ: 8.05 (1H, d, J=8.0 Hz, ArH), 7.86 (1H, d, J=8.0 Hz, ArH), 7.83 (1H, t, J=8.0 Hz, ArH), 7.60–7.58 (4H, m, ArH), 7.47–7.45 (2H, m, ArH), 4.22 (2H, s, SCH2), 3.75–3.64 (5H, m, CH2, OCH3), 3.54 (2H, q, J=6.6 Hz, NHCH2), 2.54 (2H, t, J=6.4 Hz, CH2). Anal. Calcd for C22H22N4O5S (454.5): C, 58.14%; H, 4.88%; N, 12.33%; S, 7.06%. Found: C, 57.83%; H, 4.62%; N, 12.14%.
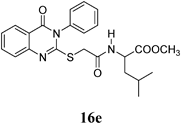
Methyl 2-(4-Methyl-2-(2-(4-oxo-3-phenyl-3,4-dihydroquinazolin-2-ylthio)acetamido)pentanamido)acetate (16e): White crystals (0.27 g, 56%); mp 180–181°C. 1H-NMR (300 MHz, DMSO) δ: 8.36 (1H, t, J=8.1 Hz, ArH), 8.24 (1H, d, J=7.8 Hz, NH), 8.08 (1H, d, J=8.1 Hz, ArH), 7.84 (1H, t, J=8.1 Hz, ArH), 7.61–7.57 (4H, m, ArH), 7.51–7.43 (2H, m, ArH), 4.28–4.18 (1H, m, CH), 4.01–3.67 (4H, m, SCH2, NHCH2), 3.60 (3H, s, OCH3), 1.69–1.43 (3H, m, CH, CH2), 0.82 (6H, d, J=6.0 Hz, 2CH3). Anal. Calcd for C25H28N4O5S (496.6): C, 60.47%; H, 5.68%; N, 11.28%; S, 6.46%. Found: C, 60.35%; H, 5.54%; N, 11.16%.