Abstract
For the determination of seven caffeoylquinic acids [neochlorogenic acid (NcA), cryptochlorogenic acid (CcA), chlorogenic acid (CA), caffeic acid (CfA), isochlorogenic acid A (Ic A), isochlorogenic acid B (Ic B), isochlorogenic acid C (Ic C)] and two flavonoids [luteolin 7-O-glucoside (LtG) and luteolin (Lt)], a three-channel liquid chromatography with electrochemical detection (LC-3ECD) method was established. Chromatographic peak heights were proportional to each concentration, ranging from 2.5 to 100 ng/mL for NcA, CA, CcA, and CfA, and ranging from 2.5 to 250 ng/mL for LtG, Ic B, Ic A, Ic C, and Lt, respectively. The present LC-3ECD method was applied to the quantitative analysis of caffeoylquinic acids and flavonoids in four cultivars of Chrysanthemum morifolium flowers and their sulfur-fumigated products. It was found that 60% of LtG and more than 47% of caffeoylquinic acids were lost during the sulfur fumigation processing. Sulfur fumigation showed a destructive effect on the C. morifolium flowers. In addition, principle component analyses (PCA) were performed using the results of the quantitative analysis of caffeoylquinic acids and flavonoids to compare the “sameness” and “differences” of these analytes in C. morifolium flowers and the sulfur-fumigated products. PCA score plots showed that the four cultivars of C. morifolium flowers were clearly classified into four groups, and that significant differences were also found between the non-fumigated C. morifolium flowers and the sulfur-fumigated products. Therefore, it was demonstrated that the present LC-3ECD method coupled with PCA is applicable to the variation analysis of different C. morifolium flower samples.
The dried capitulum of Chrysanthemum morifolium RAMAT. (Compositae), Flos Chrysanthemi called ‘Ju Hua’ in China, is a well-known herbal medicine, tea material, and food resource in many Asian countries such as China, Japan, South Korea, and Thailand.1) In China, there are many cultivars of C. morifolium flowers available. Among these cultivars, four major varieties of C. morifolium cv. ‘Hangju’ (HJ), ‘Boju’ (BJ), ‘Chuju’ (CJ), and ‘Gongju’ (GJ) have been recorded in the Chinese Pharmacopeia as standard varieties of C. morifolium flowers for their therapeutic effects of scattering cold, cleaning heat and toxin properties, and brightening eyes.2) C. morifolium flower was abundant in caffeoylquinic acids and flavonoids, which were considered to be the main bioactive components. Modern pharmacological studies revealed that these components from C. morifolium flowers possess extensive biological activities, such as anti-oxidation,3,4) anti-mutagenesis,5) cardiovascular protection,6,7) anti-cancer,8) anti-human immune deficiency viruses,9) etc. Therefore, it is significant to evaluate the quality of the C. morifolium flower by quantitatively analyzing these bioactive components.
Most medicinal herbs need to undergo a post-harvesting processing to convert the raw material into a form readily useable for prescriptions. There are many kinds of post-harvesting processing methods on traditional Chinese medicine, such as sun-drying, stir-frying, steaming, etc.10) The main traditional post-harvesting processing methods for C. morifolium flowers are shade-drying, sun-drying, and hot-air drying. In addition, a sulfur fumigation method is often used by herbal farmers and producers for its benefits of decreasing the drying time, preserving color, preventing insects and molds, easy operation, and low-cost. However, sulfur fumigation can cause the quality of the herbs to vary in terms of chemical profiles, pharmacokinetics, bioactivities, and even toxicities.11) A literature survey showed that the chemical variation of C. morifolium flower caused by sulfur fumigation has been qualitatively evaluated by GC-time-of-flight (TOF)/MS and HPLC-electrospray ionization (ESI)/MSn methods.12,13) For further study, it is urgent to establish an analytical method for the quantitative comparison of bioactive components between the non-fumigated C. morifolium flowers and their sulfur-fumigated products. Several methods have been reported to analyze the chemical profiles in C. morifolium flower, such as capillary electrophoresis (CE) with electrochemical detection (ECD),14) LC with diode array detection (DAD),15–17) LC-MS,13,18) GC-MS,12,19) LC-DAD-MS,20,21) etc. An LC-ECD method is usually used to analyze redox compounds. The caffeoylquinic acids and flavonoids which have the structure of a phenolic hydroxyl group can be oxidized in an electrochemical redox reaction. Therefore, these compounds in C. morifolium flower can be analyzed by an LC-ECD method. Compared with DAD which is possible to detect various organic compounds with less selectivity, ECD has higher selectivity for the redox compounds including caffeoylquinic acids and flavonoids in C. morifolium flower. So the satisfactory separation of these compounds on the chromatographic column can be more easily obtained by ECD. Moreover, in the case of UV and/or DAD, because chromatographic peak height has a linear relationship to a molar absorbance coefficient (ε) of analyte, standard substance of analyte is required to perform semi- and quantitative determination. In the case of ECD, chromatographic peak current height has a linear relationship to a number of electron (ex. n=1, 2, or 4) in an electrochemical reaction of an analyte. Thus, using chromatographic peak current height, semiquantitative determination can be performed without standard substances. Furthermore, our previous study shows that the sensitivity of ECD is remarkably higher than that of DAD.22) Thus, the low content redox compounds in C. morifolium flower which are hard to be detected by DAD can be quantified by an LC-ECD method. However, a single channel isocratic elution LC-ECD is unsatisfactory to simultaneously analyze the compounds with remarkable differences of hydrophobic properties. On the other hand, a gradient LC-ECD method would have high baseline noise and low sensitivity owing to the change of the mobile phase composition.23) Thus, in our previous study, a three-channel isocratic elution LC-ECD (LC-3ECD) system has been developed for the simultaneous determination of various redox compounds in Shuang–Huang–Lian preparations.22) In the present study, an LC-3ECD method was established to quantitatively analyze the caffeoylquinic acids and flavonoids, as shown in Fig. 1, in C. morifolium flowers and their sulfur-fumigated products.
Principle component analysis (PCA)24) is a statistical method for reducing the dimensions of multivariate problems without losing much information, which could be used to interpret complex data by classifying samples that show similar characteristics.15,21,25) PCA can be applied to explore the natural interrelationship including classifying, clustering, and outliers among numerous complicated samples. Thus, PCA would be useful for quality analysis of plant materials by processing complex original data. In the present study, PCA was carried out using the results of caffeoylquinic acids and flavonoids determination by the present LC-3ECD method to examine whether the classification of C. morifolium flowers and their sulfur-fumigated products is possible.
Experimental
ChemicalsCaffeic acid (CfA, >98%), neochlorogenic acid (NcA, >98%), cryptochlorogenic acid (CcA, >98%), and protocatechuic aldehyde (PrA, >97%) were purchased from Sigma-Aldrich (St. Louis, MO, U.S.A.). Luteolin (Lt, >98%), chlorogenic acid (CA, >98%), and ethyl gallate (EG, >98%) were purchased from Tokyo Kasei Kogyo Co., Ltd. (Tokyo, Japan). Butyl gallate (BG, >98%) was purchased from Wako Pure Chemical Industries, Ltd. (Osaka, Japan). Isochlorogenic acid A (Ic A, >98%), isochlorogenic acid B (Ic B, >98%), and isochlorogenic acid C (Ic C, >98%) were obtained from Shanghai Yuanye Bio-Technology Co., Ltd. (Shanghai, China). Luteolin 7-O-glucoside (LtG, >96%) was obtained from the National Institute for the Control of Pharmaceutical and Biological Products (NICPP, Beijing, China). The water used was distilled and purified with a NANO Pure II filtering system (Barnstead Co., Ltd., Boston, MA, U.S.A.). Other chemical reagents were of analytical or HPLC grade.
Herbal MaterialsSamples of C. morifolium cv. ‘Hangju’ (HJ) (No. 111, 112, 113, 114, 115, 116), ‘Boju’ (BJ) (No. 121, 122, 123, 124, 125, 126), ‘Chuju’ (CJ) (No. 131, 132, 133, 134, 135, 136), and ‘Gongju’ (GJ) (No. 141, 142, 143. 144, 145, 146) were directly collected from cultivation farms in Tongxiang county (Zhejiang province, China), Bozhou city (Anhui province, China), Chuzhou city (Anhui province, China), and Huangshan city (Anhui province, China), respectively, which were harvested in bloom between October and November, 2012. Samples of ‘S-HJ’ (No. 211, 212, 213, 214, 215, 216) and ‘S-BJ’ (No. 221, 222, 223, 224, 225, 226) were the sulfur-fumigated products of ‘HJ’ and ‘BJ’ mentioned above. The sulfur fumigation treatments were operated by the local experienced herbal farmers following the following procedures. Fresh flowers were placed in the upper levels of a closed chamber and sulfur powder was burned at the bottom of the chamber overnight. Sulfur dioxide was released into the chamber during this process and penetrated into the flowers. After fumigation, the C. morifolium flowers were dried in the sun. All samples for the current study were authenticated by one of the authors, Prof. Zhimin Wang. The voucher specimens were deposited in the Herbarium of the Institute of Chinese Materia Medica, China Academy of Chinese Medical Sciences, Beijing, P. R. China.
Preparation of Test SolutionsIn Chinese Pharmacopeia, the C. morifolium flower sample solution was prepared by an ultrasonication extraction method to determine the contents of chlorogenic acid, 3,5-dicaffeoylquinic acid, and luteolin 7-O-glucoside, respectively.2) The same extraction method was used for the preparation of sample solution and several extraction conditions including extraction solvent and extraction time were optimized in the present study. The final sample preparation procedures were as follows. The dried C. morifolium flower was milled and sieved by using an 80 mesh sieve. An accurately weighted amount of the C. morifolium flower powder (0.10 g) was diluted by 70% methanol to 40 mL with the addition of suitable quantities of three internal standards (ISs). The mixture was extracted by ultrasonication (180 W, 47 kHz) at room temperature for 20 min. The extracted solution was prepared by the method of weight relief, by which the weight lost in the extraction procedure was compensated. Then after filtering the mixture, the supernatant was diluted with an acetonitrile (ACN)–water–phosphoric acid (PA) (8.4 : 91.6 : 0.5, v/v/v) mixture to an appropriate concentration. The diluted solution was filtered through a 0.22 µm membrane, and 5 µL was injected.
The standard stock solutions were separately prepared by dissolving the accurately weighed reference compounds of appropriate amount in methanol. All of the solutions were stored at 4°C and were brought to room temperature before use. The stock solutions were then serially diluted with an ACN–water–PA (8.4 : 91.6 : 0.5, v/v/v) mixture to different concentrations from 2.5 to 250 ng/mL for the standard calibration curves.
LC-3ECD System and ConditionsAlthough the present LC-3ECD system was essentially the same as that reported previously,22) LC-3ECD conditions such as columns, flow rates, mobile phases, and times for changing the switching valve, etc. were optimized and changed to provide clear separation of caffeoylquinic acids and flavonoids in C. morifolium flower. Several equipment accessories were used to assemble the LC-3ECD system, including three pumps (AI-12, Flom, Tokyo, Japan), three electrochemical cells (Radial flow cell, BAS), three electrochemical detectors (LC-4C, BAS, Tokyo, Japan), two switching valves (Model 405, Flom, Tokyo, Japan), a vacuum degasser (DG-2080-53, Jasco, Tokyo, Japan), a sample injector fitted with a 5 µL injection loop (7725i, Rheodyne, Cotati, CA, U.S.A.), a recorder (TR-V1000, Keyence, Osaka, Japan), a column oven (CTO-10ASvp, Shimadzu, Kyoto, Japan), and four columns. Each electrochemical cell was constructed from a glassy carbon working electrode, an Ag/AgCl reference electrode, and a stainless steel auxiliary electrode. The self-assembly diagram of the equipment system is shown in Fig. 2.
In the initial state of the system (Fig. 2), the solid line flow ways on switching valve 1 (SV1) and switching valve 2 (SV2) were connected to the system. The mobile phase 1 (MP1, ACN–water–PA (8.4 : 91.6 : 0.5, v/v/v)) flowed through the pre-column (Pre-C, Capcell pak C18 UG-120, 35×1.0 mm i.d., 3 µm), Column 1 (C1, Intertsustain C18, 250×1.0 mm i.d., 3 µm), and electrochemical detection channel 1 (D1) at a 30 µL/min flow rate. Within nine minutes after injecting the sample, NcA, CA, CcA, and CfA were eluted from Pre-C to the C1, whereas Ic A, Ic B, LtG, Ic C, and Lt were retained in the Pre-C. At nine minutes after injecting the sample, the dotted line flow way on SV1 (Fig. 2) was connected to the system by rotating the SV1. Mobile phase 2 (MP2, ACN–water–PA (17.2 : 82.8 : 0.5, v/v/v)) flowed through Pre-C, Column 2 (C2, Develosil C30 XG-M-3, 250×1.0 mm i.d., 3 µm), and the electrochemical detection channel 2 (D2) at a 40 µL/min flow rate. Between 9 and 17 min after injecting the sample, Ic A, Ic B, and LtG were eluted from Pre-C to the C2, whereas Ic C and Lt were still retained in the Pre-C. At 17 min after injecting the sample, the dotted line flow way on SV2 (Fig. 2) was connected to the system by rotating the SV2. Mobile phase 3 (MP3, ACN–water–PA (22 : 78 : 0.5, v/v/v)) flowed through Pre-C, column 3 (C3, Capcell pak C18 UG-120, 150×1.0 mm i.d., 3 µm), and electrochemical detection channel 3 (D3) at a 45 µL/min flow rate. And then, Ic C and Lt were eluted from Pre-C to the C3. In summary, MP1, MP2, and MP3 alternately flowed through the Pre-C to elute the caffeoylquinic acids and flavonoids into the respective column (C1, C2, or C3) for separation. Meanwhile, MP1, MP2, and MP3 always flowed through D1, D2, and D3, respectively, in the whole analytical process. Column temperature was set at 32°C. In the D1, the applied potential was set at +0.6 V vs. Ag/AgCl to detect NcA, CA, CcA, and CfA. In the D2 and D3, applied potential were set at +0.7 V vs. Ag/AgCl to detect LtG, Ic B, Ic A, Ic C, and Lt.
Procedure of Principle Component AnalysisThe software of SIMCA-P +11 was applied to the PCA in the present study. The primary data were prepared in an Excel file containing the contents of the nine analytes (NcA, CA, CcA, CfA, Ic A, Ic B, Ic C, LtG, and Lt) in each sample analyzed. Then the data set (primary data mentioned above) was imported to the software in a new project, in which the contents of the nine analytes were set as variables and the sample numbers was set as observations. Various principle components were obtained when ‘Autofit,’ ‘Next Component,’ or ‘First Two Components’ under the menu bar of ‘Analysis’ was performed. According to the parameter values, such as ‘R2X,’ ‘R2X (cum),’ and ‘Eigenvalues,’ a fitting principle component (PC) model was selected and a PCA score plot was acquired for the present data set.
Results and Discussion
Optimization of Separation ConditionsColumns types, mobile phase composition, flow rates, and column temperature were taken into account while optimizing the LC conditions to achieve good separation of the analytes within a short period of the analysis time. The column of Capcell pak C18 UG-120 (150×1.0 mm, 3 µm) was selected as the pre-column, on which all analytes could been easily eluted to the respective detection channel by related mobile phase to save analysis time. Meanwhile, three groups of analytes for the three detection channels were completely separated on the pre-column. Columns types for C1, C2, and C3 were also investigated to obtain good separation effects for each group of analytes. Three columns of Intertsustain C18 (250×1.0 mm, 3 µm), Develosil C30 XG-M-3 (250×1.0 mm, 3 µm) and Capcell pak C18 UG-120 (150×1.0 mm, 3 µm) as C1, C2, and C3, respectively, were found to be the best selections. For the mobile phase composition, using methanol as an organic phase led to the poor separation of the analytes and high system pressure. By replacing methanol with ACN, lower system pressure and better separation were achieved. The PA content in each mobile phase was also investigated. The peak shapes of caffeoylquinic acids became satisfactory while the PA content was up to 0.5% (v/v). The flow rates of MP1, MP2, and MP3 were set to 30, 40, and 45 µL/min, respectively, thereby avoiding high column pressure in each detection channel. Based on the good separation of each analyte, increasing column temperature reduced the column pressure and shortened the analysis time. The investigation showed that the appropriate choice for the column temperature was 32°C.
Selection of Detection ConditionsAn optimal applied potential in each detection channel was investigated for the detection of nine analytes, ranging from +0.4 to +1.0 V vs. Ag/AgCl. As shown in Fig. 1, nine analytes of caffeoylquinic acids and flavonoids have the same structure of pyrocatechol, which could be converted to ortho-quinone easily by losing two electrons in an electrochemical oxidation reaction.26,27) The results showed that nine analytes were oxidized at potentials of more positive than +0.5 V vs. Ag/AgCl. The peak current heights of NcA, CA, CcA, and CfA stayed at a plateau as the potentials applied in D1 were in the range of +0.6 V to +1.0 V vs. Ag/AgCl. In D2 and D3, the peak current heights of LtG, Ic B, Ic A, Ic C, and Lt reached a plateau at potentials of more than +0.7 V vs. Ag/AgCl. Considering the highly sensitive determination without loss of selectivity and reproducibility, +0.6 V vs. Ag/AgCl applied in D1, and +0.7 V vs. Ag/AgCl applied in D2 and D3 were adopted, respectively, in the present study.
Chromatograms of Caffeoylquinic Acids and FlavonoidsAn IS method was applied to obtaining accurate measurements for the present study. Three compounds of protocatechuic aldehyde (PrA), ethyl gallate (EG), and butyl gallate (BG) were selected as ISs in D1, D2, and D3, respectively, due to their good stabilities, resolutions (Rs), and peak current values. Under the optimized LC-3ECD conditions, the satisfactory chromatogram of mixed standard solution was obtained as shown in Fig. 3A. The peaks of NcA, PrA (IS1), CA, CcA, and CfA appeared at 24.7, 32.4, 54.2, 56.9, and 60.4 min in D1, respectively. The peaks of EG (IS2), LtG, Ic B, and Ic A appeared at 26.4, 53.5, 60.2, and 70.2 min in D2, respectively. The peaks of Ic C, BG (IS3), and Lt appeared at 27.8, 44.4, and 47.2 min in D3, respectively. The Rs between CA and CcA was greater than 1.60. The Rs between CcA and CfA was greater than 2.0. The tailing factors of all analytes were in the range of 0.95 to 1.05, so the peak height quantification made sense.
Method ValidationThe linearity was validated by using mixed standard solutions of nine concentration levels (2.5, 5.0, 7.5, 10, 25, 50, 75, 100, and 250 ng/mL for each analyte) with constant concentrations of 3 ISs (10, 10, and 25 ng/mL for PrA, EG, and BG, respectively). The calibration curves were linear over the range of 2.5 to 100 ng/mL for NcA, CA, CcA, and CfA, and 2.5 to 250 ng/mL for LtG, Ic B, Ic A, Ic C, and Lt. All correlation coefficients (r) were greater than 0.999. The detection limits, defined as the signal-to-noise ratio (S/N) of 3 : 1, were 0.29, 0.42, 0.40, 0.23, 0.36, 0.27, 0.56, 0.17, and 0.52 ng/mL for NcA, CA, CcA, CfA, LtG, Ic B, Ic A, Ic C, and Lt, respectively. It showed the high sensitivity of each analyte by the present method.
The specificity was confirmed by comparing the chromatograms of a blank solution, a mixed standard solution, and individual C. morifolium flower samples. No interference or peak overlap was observed around the retention times of the nine analytes and three ISs. The relative standard deviation (R.S.D.) values (n=6) of each analyte for the six successive injections of the mixed standard solutions with a low concentration (6 ng/mL) and a high concentration (80 ng/mL) ranged from 0.83% to 2.4% and from 0.66 to 1.7%, respectively. Our results indicate that the present method had the advantage of precision. A test solution was analyzed at 0, 3, 9, 24, 36, and 48 h after sample preparation. The R.S.D. values (n=6) of each analyte within 48 h ranged from 0.88 to 3.3%. This finding suggests that the sample solutions were stable within two days. A mixture C. morifolium flower sample [‘HJ’ (No. 113) : ‘S-BJ’ (No. 223)=1 : 1, weight/weight (w/w)] was used to validate the repeatability and accuracy. The repeatability was assessed by analyzing six samples independently using the same sample preparation method. The accuracy (recovery experiment) was tested sextuplicately by spiking the samples with nearly equal amounts of reference compounds. A chromatogram of the mixture C. morifolium flower sample is shown in Fig. 3B. The major peak was observed after the peak of Ic A (Fig. 3B, peak g) at D2. To identify the compound of this peak, we injected reference substances (ex. apigenin-7-O-β-D-glucoside, diosmetin-7-O-β-D-rutinose, and diosmetin-7-O-β-D-glucoside) which might be eluted after Ic A and contained in C. morifolium flowers into the LC-3ECD system. However, the chromatographic peaks of these reference substances were not overlapped on this peak, thus it was not identified. The data obtained in the repeatability and accuracy studies are summarized in Table 1. The R.S.D. values (n=6) of each analyte for the repeatability were below 3.1%. The recovery for the spiked sample solutions was in the range of 95.8 to 104.9% with the R.S.D. values (n=6) of each analyte less than 3.7%. These results demonstrate that the present method provide accurate measurements of caffeoylquinic acids and flavonoids in the C. morifolium flower.
Table 1. Repeatability and Recovery of Caffeoylquinic Acids and Flavonoids
| Analyte | Repeatability (n=6) | Recovery (n=6) |
|---|
| Content (mg/g) | R.S.D. (%) | Spiked (mg/g) | Recovery (%) | R.S.D (%) |
|---|
| NcA | 0.170 | 1.4 | 0.170 | 95.8 | 2.0 |
| CA | 3.12 | 1.9 | 3.00 | 100.2 | 1.4 |
| CcA | 0.474 | 2.1 | 0.500 | 99.1 | 2.5 |
| CfA | 0.204 | 1.7 | 0.200 | 97.7 | 1.9 |
| Ic A | 13.2 | 3.1 | 13.0 | 101.0 | 1.9 |
| Ic B | 0.665 | 2.3 | 0.700 | 102.4 | 3.7 |
| Ic C | 5.93 | 1.6 | 6.20 | 104.9 | 2.2 |
| LtG | 1.95 | 0.21 | 1.80 | 96.4 | 3.0 |
| Lt | 2.64 | 0.39 | 2.60 | 96.9 | 3.3 |
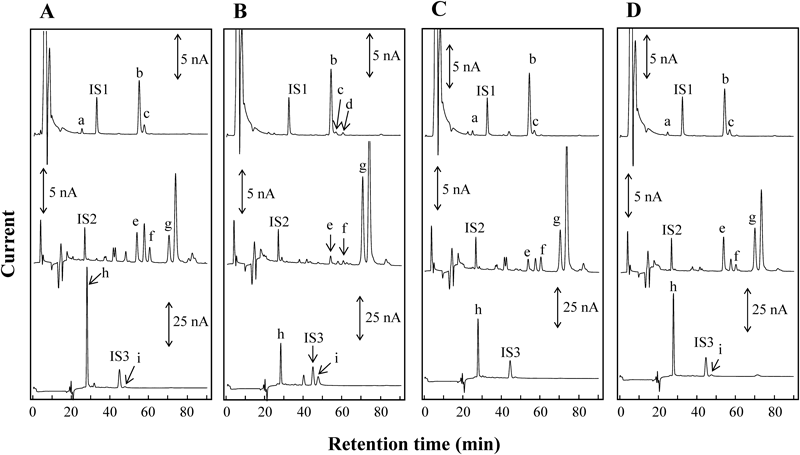
After the present method was validated, the contents of seven caffeoylquinic acids and two flavonoids in C. morifolium flowers and their sulfur-fumigated products were quantitatively determined. Typical chromatograms of four varieties of C. morifolium flowers are shown in Fig. 4. The contents of NcA, CA, CcA, CfA, LtG, Ic B, Ic A, Ic C, and Lt in six lots of four varieties of C. morifolium flowers are summarized in Table 2. For the ‘sameness’ analysis of caffeoylquinic acids, the compounds of CA, Ic A, and Ic C were the main forms of caffeoylquinic acids in four varieties of C. morifolium flowers analyzed. On the other hand, the content of CfA was so low that it was hard to be determined in ‘HJ,’ ‘CJ,’ and ‘GJ.’ The compound NcA was not detected in the ‘BJ’ samples analyzed. The average contents of CcA and Ic B were less than 0.85 and 1.25 mg/g, respectively. For the ‘sameness’ analysis of flavonoids, LtG was quantified in four varieties of C. morifolium flowers. Nevertheless, there was no detection of Lt in some of the C. morifolium flower samples.
Table 2. Summarized Results of the Caffeoylquinic Acid and Flavonoid Content in
C. morifolium Flowers and Their Sulfur-Fumigated Products
| Sample | Content [mean (mg/g)±S.D. (n=6)] |
|---|
| Caffeoylquinic acid | Flavonoid | Total |
|---|
| NcA | CA | CcA | CfA | Ic A | Ic B | Ic C | Subtotal | LtG | Lt | Subtotal |
|---|
| HJ | 0.28±0.04 | 4.58±0.20 | 0.85±0.06 | ND | 8.61±1.47 | 1.20±0.21 | 9.09±0.58 | 24.6±2.04 | 3.16±0.18 | 0.15±0.16 | 3.31±0.31 | 27.9±2.31 |
| BJ | ND | 5.65±0.26 | 0.29±0.02 | 0.12±0.01 | 21.1±2.13 | 0.73±0.31 | 3.32±0.17 | 31.2±2.09 | 0.82±0.07 | 2.23±0.22 | 3.05±0.27 | 34.2±2.26 |
| CJ | 0.27±0.02 | 5.31±0.54 | 0.48±0.07 | ND | 10.2±0.67 | 1.25±0.23 | 4.46±0.64 | 22.0±2.00 | 0.97±0.19 | ND | 0.97±0.19 | 22.9±2.13 |
| GJ | 0.19±0.02 | 3.89±0.21 | 0.61±0.03 | ND | 9.40±0.12 | 0.56±0.05 | 6.34±0.42 | 21.0±0.74 | 3.54±0.18 | 0.12±0.14 | 3.66±0.22 | 24.7±0.92 |
| S-HJ | ND | 1.65±0.58 | 0.29±0.11 | 0.14±0.04 | 5.47±1.38 | 0.13±0.10 | 3.69±0.56 | 11.4±2.43 | 1.26±0.25 | 6.29±0.83 | 7.54±0.61 | 18.9±2.86 |
| S-BJ | ND | 1.44±0.37 | ND | 0.39±0.07 | 13.0±2.48 | 0.11±0.09 | 1.45±0.30 | 16.4±3.24 | 0.33±0.16 | 4.67±0.48 | 4.99±0.44 | 21.4±3.34 |
Concerning the quantitative profiles of caffeoylquinic acids and flavonoids, the ‘differences’ were observed obviously among the four varieties of C. morifolium flowers. As the main form of caffeoylquinic acids in these four varieties, the average content of CA was in the range of 3.89 to 5.65 mg/g. The content of Ic A existing in the ‘BJ’ samples was more than twice as much as that of other varieties, while the highest content of Ic C was found in ‘HJ’ samples. The average content of the total caffeoylquinic acids were in the order of ‘BJ’>‘HJ’>‘CJ’>‘GJ.’ Regarding the flavonoids analyzed, the content of LtG was obviously higher than that of Lt in ‘HJ,’ ‘CJ,’ and ‘GJ.’ In spite of this, the samples of ‘BJ’ exhibited a significant variation, in which the content of Lt [2.23±0.22 mg/g (mean±S.D.)] was remarkably higher than that of LtG [0.82±0.07 mg/g (mean±S.D.)]. The average contents of the sum of the flavonoids analyzed (LtG and Lt) were in the order of ‘GJ’>‘HJ’>‘BJ’>‘CJ.’ These results demonstrated that there were significant differences in the quantities of caffeoylquinic acids and flavonoids among the present four varieties of C. morifolium flowers.
Significant differences were also found between the C. morifolium flower samples and their sulfur-fumigated products. Typical chromatograms of sulfur-fumigated C. morifolium flowers of ‘S-HJ’ and ‘S-BJ’ are shown in Fig. 5. The quantitative results are also summarized in Table 2. Compared with the non-fumigated samples of ‘HJ,’ the average contents of NcA, CA, CcA, Ic A, Ic B, and Ic C were reduced from 0.28 mg/g to ND, 4.58 to 1.65 mg/g, 0.85 to 0.29 mg/g, 8.61 to 5.47 mg/g, 1.20 to 0.13 mg/g, and 9.09 to 3.69 mg/g, respectively, in the sulfur-fumigated samples of ‘HJ,’ whereas the average content of CfA was increased from ND to 0.14 mg/g. For the contents of the flavonoids, a lower amount of LtG (reduced from 3.16 to 1.26 mg/g) and a much higher amount of Lt (increased from 0.15 to 6.29 mg/g) were observed in the sulfur-fumigated ‘HJ’ samples. The similar chemical variability existed between the non-fumigated and sulfur-fumigated ‘BJ’ samples. It was found that nearly 60% of the flavonoids of LtG and more than 47% of caffeoylquinic acids were lost due to sulfur fumigation. Therefore, it showed a destructive effect on the C. morifolium flower. These results may provide some evidence for the advantages and disadvantages of sulfur fumigation on plant materials.
For the chemical changes that occurred in the C. morifolium flower during the sulfur-fumigation processing, it could be deduced that the caffeoylquinic acids were partly destroyed by oxidization or/and hydrolyzation and the flavonoid glycosides were partly converted to flavonoid aglycones. From the quantitative results, the higher content of CfA and the lower content of other caffeoylquinic acids were observed in the sulfur-fumigated samples compared with non-fumigated samples. As the CfA was the hydrolysate of other caffeoylquinic acids, it revealed the presence of the hydrolysis of caffeoylquinic acids during the sulfur-fumigation processing. Literature showed that there were several kinds of flavonoid glycosides related to Lt in C. morifolium flower, such as Luteolin-7-O-rutinoside, Luteolin-7-O-glucuronide, Luteolin-7-O-pentosylhexoside, Luteolin-7-O-6″-malonylglucoside, etc.13,20) These compounds might also be hydrolyzed to Lt during the sulfur-fumigation processing. It partly explained why the content of Lt in the sulfur-fumigated C. morifolium flower samples was much more than that of the non-fumigated samples.
Principle Component Analysis for the Classification of C. Morifolium Flowers and Their Sulfur-Fumigated ProductsAfter the content determination of caffeoylquinic acids and flavonoids in C. morifolium flowers and their sulfur-fumigated samples, the content data were further analyzed by PCA to classify the samples. First, the results of the NcA, CA, CcA, CfA, LtG, Ic B, Ic A, Ic C, and Lt in ‘HJ,’ ‘BJ,’ ‘CJ,’ and ‘GJ’ samples were imported into the software of SIMCA-P +11 and analyzed. In the present PCA, eigenvalue, variance, and cumulative variance are shown in Table 3. Hereon, the principle components were new variables computed as linear combinations of all the original variables for a good summary of original information. Theoretically, nine principle components were obtained from nine original variables. As the eigenvalues of the first and second principle components were greater than 1.0 for the present data set as shown in Table 3, the first and second principal components (PC1) and (PC2) were used for identifying the inhomogeneity of the samples analyzed in the present study. Concerning the data set of the ‘HJ,’ ‘BJ,’ ‘CJ,’ and ‘GJ’ samples, PC1 contained a 68.8% variance and PC2 contained a 19.1% variance. The two principal components explained 87.9% of the total variation. The PCA score plot of the content data set of the ‘HJ,’ ‘BJ,’ ‘CJ,’ and ‘GJ’ samples are shown in Fig. 6A. It showed four groups of samples, the first group with ‘HJ’ samples, the second with ‘CJ’ samples, the third with ‘BJ’ samples, and the fourth with ‘GJ’ samples.
Table 3. Eigenvalue, Variance, and Cumulative Variance from Each Data Set
| Content data set | Principle component (PC) | Eigenvalue | R2X (% of variance) | R2X (cum) (% of cumulative variance) |
|---|
| ‘HJ,’ ‘BJ,’ ‘CJ,’ and ‘GJ’ | 1 | 6.19 | 68.8 | 68.8 |
| 2 | 1.72 | 19.1 | 87.9 |
| 3 | 0.824 | 9.15 | 97.0 |
| 4 | 0.176 | 1.95 | 99.0 |
| 5 | 0.0397 | 0.44 | 99.4 |
| 6 | 0.0242 | 0.27 | 99.7 |
| 7 | 0.0108 | 0.12 | 99.8 |
| 8 | 0.00921 | 0.10 | 99.9 |
| 9 | 0.00661 | 0.07 | 100.0 |
| ‘HJ,’ ‘BJ,’ ‘S-HJ,’ and ‘S-BJ’ | 1 | 6.29 | 69.9 | 69.9 |
| 2 | 1.93 | 21.4 | 91.3 |
| 3 | 0.48 | 5.33 | 96.6 |
| 4 | 0.135 | 1.50 | 98.1 |
| 5 | 0.116 | 1.29 | 99.4 |
| 6 | 0.0286 | 0.32 | 99.7 |
| 7 | 0.0142 | 0.16 | 99.9 |
| 8 | 0.00404 | 0.04 | 100.0 |
| 9 | 0.00181 | 0.02 | 100.0 |
Next, the results of the NcA, CA, CcA, CfA, LtG, Ic B, Ic A, Ic C, and Lt in the ‘HJ,’ ‘BJ,’ ‘S-HJ,’ and ‘S-BJ’ samples were also imported into the software of SIMCA-P +11 and analyzed. As shown in Table 3, the eigenvalues of the first and second components were also greater than 1.0 concerning the content data set of the ‘HJ,’ ‘BJ,’ ‘S-HJ,’ and ‘S-BJ’ samples, so the first and second principle principal components PC1 and PC2 were selected for the PCA score plot. PC1 contained a 69.9% variance and PC2 contained a 21.4% variance. The two principal components explained 91.3% of the total variation. As shown in Fig. 6B, the content data set of ‘HJ,’ ‘BJ,’ ‘S-HJ,’ and ‘S-BJ’ were clearly classified into four groups in the PCA score plot. These results demonstrated that there were significant differences of the caffeoylquinic acids and flavonoids among the four cultivars of C. morifolium flowers and their sulfur-fumigated products.
Conclusion
The present study has developed an LC-3ECD method to quantitatively analyze caffeoylquinic acids and flavonoids in C. morifolium flowers and their sulfur-fumigated products with high selectivity and sensitivity. A PCA was carried out using the results of the determination of caffeoylquinic acids and flavonoids by the present LC-3ECD method. The ‘sameness’ and ‘differences’ related to these bioactive components such as caffeoylquinic acids and flavonoids in the C. morifolium flower were revealed using content determination and the PCA method. On the PCA score plot, the groups of ‘HJ,’ ‘BJ,’ ‘CJ,’ and ‘GJ’ were clearly classified into four, where the group of each variety were clustered together. In addition, significant differences were also found between non-fumigated C. morifolium flowers and the sulfur-fumigated ones by content determination and PCA. In summary, the present LC-3ECD method coupled with PCA study was clearly applicable to elucidate the significant chemical differences among four cultivars of C. morifolium flowers and their sulfur-fumigated products.
Acknowledgment
This research is supported in part by the Grants-in-Aid for Scientific Research C (No. 26410161 to AK) from the Ministry of Education, Culture, Sports, Science and Technology of Japan, the Special Project for Traditional Chinese Medicine Industry (No. 201307008-04), and the National Natural Science Foundation of China (No. 81373960). Liangmian Chen, one of the authors, would also like to express his gratitude to the international exchange program between the China Academy of Chinese Medical Science and the School of Pharmacy, Tokyo University of Pharmacy and Life Sciences.
Conflict of Interest
The authors declare no conflict of interest.
References
- 1) Lai J.-P., Lim Y. H., Su J., Shen H.-M., Ong C. N., J. Chromatogr. B, 848, 215–225 (2007).
- 2) Chinese Pharmacopoeia Commission, “Pharmacopoeia of the People’s Republic of China,” Vol. 1, People Medical Science Publisher, Beijing, China, 2010, p. 292.
- 3) Kim H. J., Lee Y. S., Planta Med., 71, 871–876 (2005).
- 4) He D., Ru X., Wen L., Wen Y., Jiang H., Bruce I. C., Jin J., Ma X., Xia Q., J. Ethnopharmacol., 139, 68–73 (2012).
- 5) Miyazawa M., Hisama M., Biosci. Biotechnol. Biochem., 67, 2091–2099 (2003).
- 6) Peng Y. R., Shi L., Luo Y. H., Ding Y. F., Lishizhen Med. Mater. Med. Res., 17, 1131–1132 (2006).
- 7) Hua B., Lv G. Y., Qingdao Med. J., 38, 282–283 (2006).
- 8) Xie Y. Y., Yuan D., Yang J. Y., Wang L. H., Wu C. F., J. Asian Nat. Prod. Res., 11, 771–778 (2009).
- 9) Lee J. S., Kim H. J., Lee Y. S., Planta Med., 69, 859–861 (2003).
- 10) Kan W. L. T., Ma B., Lin G., Front. Pharmacol., 2, 1–7 (2011).
- 11) Jiang X., Huang L. F., Zheng S. H., Chen S. L., Phytomedicine, 20, 97–105 (2013).
- 12) Cao G., Cai H., Cong X., Liu X., Ma X., Lou Y., Qin K., Cai B., Analyst, 137, 3828–3838 (2012).
- 13) Wang S., Hao L. J., Zhu J. J., Zhang Q. W., Wang Z. M., Zhang X., Song X. M., Phytomedicine, 21, 773–779 (2014).
- 14) Chu Q., Fu L., Guan Y., Ye J., J. Agric. Food Chem., 52, 7828–7833 (2004).
- 15) Liang X., Wu H., Su W., Food Anal. Methods, 7, 197–204 (2014).
- 16) Wang T., Zhu Z., Guo Q., Mao P., Biochem. Syst. Ecol., 47, 74–79 (2013).
- 17) Wang Y.-J., Yang X.-W., Guo Q.-S., Liu H.-T., Chromatographia, 70, 109–116 (2009).
- 18) Clifford M. N., Wu W., Kirkpatrick J., Kuhnert N., J. Agric. Food Chem., 55, 929–936 (2007).
- 19) Sun Q.-L., Hua S., Ye J.-H., Zheng X.-Q., Liang Y.-R., Afr. J. Biotechnol., 9, 3817–3821 (2010).
- 20) Lin L.-Z., Harnly J. M., Food Chem., 120, 319–326 (2010).
- 21) Avula B., Wang Y. H., Wang M., Avonto C., Zhao J., Smillie T. J., Rua D., Khan I. A., J. Pharm. Biomed. Anal., 88, 278–288 (2014).
- 22) Chen L., Hakamata H., Kusu F., Wang Z., Gao H., Kotani A., J. Pharm. Biomed. Anal., 95, 93–101 (2014).
- 23) Matsumoto D., Kotani A., Hakamata H., Takahashi K., Kusu F., J. Chromatogr. A, 1217, 2986–2989 (2010).
- 24) Jolliffe I. T., “Principal Component Analysis,” Springer, Berlin, 1986.
- 25) Sun J., Chen P., J. Pharm. Biomed. Anal., 61, 142–149 (2012).
- 26) Janeiro P., Oliveira Brett A. M., Anal. Chim. Acta, 518, 109–115 (2004).
- 27) Hotta H., Sakamoto H., Nagano S., Osakai T., Tsujino Y., Biochim. Biophys. Acta, 1526, 159–167 (2001).