Abstract
The physical stability of pharmaceutical emulsions is an important quality attribute to be considered. To obtain a better understanding of this issue, this study investigated the contribution of the state of water to the physical stability of pharmaceutical emulsions. The key technology to evaluate the state of water was magnetic resonance imaging (MRI). For sample preparation, model emulsions with different formulation variables (surfactant content, water content, and hydrophilic–lipophilic balance) were prepared. The T1 relaxation time, diffusion coefficient, and viscosity were measured as physical properties. The physical stability of the samples was evaluated using apparent diffusion coefficient maps acquired by MRI. Data analysis of the observed data was performed using the nonlinear response surface method and Kohonen’s self-organizing map (SOM). It was determined that, depending on the formulation variables, the state of water was substantially changed and it played a significant role in the physical stability. SOM analysis successfully classified the conditions of formulation variables into four distinct clusters in terms of the similarity of the physical properties of the resultant emulsions, and then clarified the characteristics of the stable emulsions. This study provided us with a comprehensive understanding of the formulation variables, physical properties, and stability concerning the preparation of the model emulsion.
Oil-in-water type emulsions are widely used for various semisolid topical dosage forms. Pharmaceutical emulsions are less greasy than ointments, they are easier to apply and can be easily washed off from the skin surface; thus, they are highly acceptable to patients.1) For the development of pharmaceutical emulsions, physical stability is a very important quality attribute to be considered. This is because emulsions are thermodynamically unstable by nature. In general, the destabilization processes of emulsions are classified into four distinct processes: creaming, flocculation, coalescence, and Ostwald ripening.1) Coalescence and Ostwald ripening are the most serious types of destabilization, whereas creaming and flocculation are subtle destabilization processes.
We have been investigating the physical stability of pharmaceutical emulsions using magnetic resonance imaging (MRI).2–4) MRI is one of the most popular molecular imaging methods; it permits the nondestructive monitoring of a sample using the principle of nuclear magnetic resonance (NMR). In addition, MRI can visualize the state of water in a sample by using magnetic resonance (MR) parameters. In a previous study, we established a new method to monitor destabilization processes of pharmaceutical emulsions.4) The key technology is the visualization of the state of water. Water in pharmaceutical emulsions can exist in various states depending on its particular location and microenvironment.2) Once creaming has occurred in emulsions, the layer of close-packed droplets (creaming layer) shows a different state of water from the aqueous phase. This is because the molecular mobility of water in the creaming layer is tightly restricted by surfactants on the oil droplets. By utilizing the difference in the state of water, our method enables the nondestructive detection of slight creaming in emulsions.
The states of water in pharmaceutical emulsions are expected to differ as a function of the formulations of the emulsion, even if they are freshly prepared and homogeneous. It is our opinion that the difference in the state of water plays a crucial role in the physical stability of emulsions. One of the effective procedures for the stabilization of an emulsion is to use a nonionic polymeric surfactant.5) Polymeric surfactants have both hydrophilic and hydrophobic regions in the molecule: the hydrophobic region serves as an anchor by absorption onto the oil droplet surface, while the hydrophilic region expands to a continuous aqueous phase and then forms an hydrated layer covering the surface of the oil droplet. The hydrated layer prevents an oil droplet from destabilization. The mechanism is usually referred to as steric stabilization.6) We thought the mode of formation of the hydrated layer could substantially affect the states of water in the emulsions.
Against this background, this study focused on the relationships between the state of water and the physical stability of pharmaceutical emulsions. For sample preparation, model emulsions with different formulations were prepared. Formulation variables studied included the surfactant content, hydrophilic–lipophilic balance (HLB), and water content. To assess the state of water in pharmaceutical emulsions, MR parameters including the relaxation time (T1) and diffusion coefficient (D) were measured. We also measured the viscosity as a popular physical property of emulsions. The physical stability of the emulsions was evaluated using the apparent diffusion coefficient (ADC) maps acquired by MRI. Afterwards, to link the relationships between the state of water and the physical stability, the observed data were analyzed using Kohonen’s self-organizing map (SOM).
The outcome of this study offers a comprehensive insight into the physical stability of pharmaceutical emulsions.
Experimental
MaterialsPolyoxyethylene behenyl ether (NIKKOL BB-20; HLB 16.5), sorbitan stearate (NIKKOL SS-10MV; HLB 4.7) and glyceryl triisooctanoate (NIKKOL Trifat S-308) were supplied by Nikko Chemicals (Tokyo, Japan). Stearic acid and l-hexadecanol were purchased from Wako Pure Chemical Industries, Ltd. (Osaka, Japan). All other chemicals were of analytical grade and commercially available.
Sample PreparationFormulations of the model emulsions are shown in Table 1. The water content, surfactant content, and HLB were selected as the formulation variables to be tested. The model emulsions were prepared by the phase-inversion emulsification method7) under vacuum (−70 cmHg) using a TK Agi-Homo mixer (Primix, Tokyo, Japan). In brief, the oily phase and surfactant were mixed at 80°C. A designated amount of water kept at 80°C was added to the mixture drop by drop under gentle stirring with agitator at 150 rpm. After that, stirring was continued for 3 min with homogenizer at 2000 rpm and agitator at 150 rpm. The emulsion was then stirred with agitator at 60 rpm in the water bath for cooling. The prepared emulsions were kept at room temperature in an air atmosphere until used in experiments.
Table 1. Formulations of the Model Emulsions
| Component | Content (wt%) |
|---|
| Oily phasea) |
| Stearic acid | 10–22 |
| l-Hexadecanol |
| Glyceryl triisooctanoate |
| Surfactantb) | 2, 3, 4 |
| Polyoxyethylene behenyl ether (Nikkol BB-20) |
| Sorbitan stearate (Nikkol SS-10MV) |
| Aqueous phase |
| Water | 76, 81, 86 |
a) Weight ratio of stearic acid/l-hexadecanol/glyceryl triisooctanoate, 5/3/10. b) HLB=11, 13, 15.
The T1 and D of water in the hydrogels were determined using a Varian NMR system at 9.4 T at room temperature. The T1 of water in the samples was measured using the inversion recovery (IR) sequence (180°–t–90° acquisition) and a spin–echo (SE) sequence. Such IR–SE mixed sequences are frequently used for T1 measurements.7–9) The D of water was determined by the pulse sequence superimposition of a pair of square-shaped gradient field pulses (the so-called motion-probing gradients) using a stimulated echo acquisition mode. The gradient pulse factor, b-value, ranged from 0 to 3339 s/mm2.
Measurement of Viscosity of EmulsionsMeasurement of the viscosity of emulsions was performed using a viscometer (TV-30; Toki Sangyo Co., Ltd., Tokyo, Japan). The temperature of the base plate was 20±0.1°C. The shear rate was set at 383 s−1.
Acquisition of ADC Maps to Evaluate the Physical Stability of EmulsionsThe emulsions were placed in 0.5 mL polyethylene tubes, and then stored in an oven at 60°C to accelerate the destabilization processes in the samples. At designated intervals, the samples were removed from the oven, and then they were monitored with ADC maps. To construct ADC maps, diffusion-weighted MR images with different b values were acquired using a pulsed-field gradient SE sequence. The b values were set at 0, 1000, 2000, and 3000 s/mm2. The other acquisition parameters were as follows: repetition time (TR) of 2000 ms, echo time (TE) of 45 ms, field of view (FOV) of 30×30 mm2, matrix size of 128×128, and slice thickness of 1 mm.
Data AnalysisdataNESIA (Version 3.0; Yamatake Corp., Tokyo, Japan) software was used for the response surface method with multi-spline interpolation (RSM-S). Viscovery SOMine (Version 4.0; Eudaptics Software; Vienna, Austria) software was used for SOM clustering.
Data analysis was performed as described in our previous studies.10,11) In brief, a correlation model between formulation variables and each characteristic was constructed from the experimental data using RSM-S. Next, the properties of a large number of untested emulsions were predicted by reading points on the response surfaces. For the preparation of formulations of untested emulsions, a sequential and a Monte Carlo approach were employed; namely, each variable was divided into nine levels at regular intervals, resulting in a total of 729 prepared formulations in this study. Then, SOM analysis was performed to distinguish the generated data sets into several distinct clusters. The experimental data pertaining to the physical properties (i.e., T1, D, viscosity and stability) were employed as tutorial data for SOM analysis. The software offers several clustering techniques including a SOM-Ward, a Ward and a SOM-Single-Linkage. In this study, SOM clustering was performed by using SOM-Ward. That is because it is considered the most efficient in general. Further explanations of the experiments are described fully in our previous articles.10,11)
Results and Discussion
This study measured T1, D, and viscosity as the physical properties of the samples. T1 relaxation time (also known as the spin–lattice relaxation time) reflects the spin–rotation interaction, and D represents diffusivity of the molecules containing the observed proton. Both MR parameters are known to be sensitive to the state of water.2,12–14) Here, the basic states of water are known as free and bound water. They differ in terms of molecular mobility. The T1 and D of bound water are supposed to be smaller than that of free water due to the restriction of the molecular mobility. Viscosity is a popular property used to characterize emulsions. Although viscosity can be considered as a complex property, representing various aspects of emulsions, it reflects the state of water to a considerable extent. These physical properties of the samples are summarized in Table 2.
Table 2. Physical Properties of the Model Emulsions
| Formulation number | Conditions for formulation variables (A/B/C)a) | T1 (s) | D (×10−10 m2/s) | Viscosity (Pa·s) | Stabilityb) (×10−10 m2/s) |
|---|
| 1 | 2.0/76.0/11 | 2.34±0.06 | 1.68±0.19 | 0.636±0.028 | 8.27±0.14 |
| 2 | 2.0/76.0/13 | 2.30±0.10 | 2.40±0.46 | 0.660±0.019 | 8.49±0.26 |
| 3 | 2.0/76.0/15 | 2.29±0.04 | 2.85±0.10 | 0.618±0.017 | 18.58±0.53 |
| 4 | 2.0/81.0/11 | 2.41±0.01 | 1.85±0.19 | 0.421±0.014 | 7.22±0.11 |
| 5 | 2.0/81.0/13 | 2.35±0.07 | 1.69±0.30 | 0.415±0.001 | 18.74±0.19 |
| 6 | 2.0/81.0/15 | 2.32±0.05 | 2.14±0.51 | 0.413±0.018 | 20.50±0.39 |
| 7 | 2.0/86.0/11 | 2.51±0.03 | 2.33±0.06 | 0.286±0.004 | 8.28±0.61 |
| 8 | 2.0/86.0/13 | 2.49±0.02 | 2.61±0.34 | 0.281±0.016 | 10.35±0.21 |
| 9 | 2.0/86.0/15 | 2.49±0.05 | 2.56±0.28 | 0.221±0.012 | 17.36±1.10 |
| 10 | 3.0/76.0/11 | 2.20±0.05 | 2.10±0.13 | 0.759±0.017 | 6.49±0.56 |
| 11 | 3.0/76.0/13 | 2.16±0.00 | 2.58±0.35 | 0.811±0.016 | 9.37±0.07 |
| 12 | 3.0/76.0/15 | 2.14±0.03 | 2.38±0.46 | 0.799±0.031 | 18.04±0.19 |
| 13 | 3.0/81.0/11 | 2.31±0.04 | 2.00±0.21 | 0.529±0.016 | 17.86±2.58 |
| 14 | 3.0/81.0/13 | 2.13±0.02 | 2.28±0.21 | 0.868±0.015 | 18.62±0.37 |
| 15 | 3.0/81.0/15 | 2.16±0.10 | 2.57±0.05 | 0.488±0.002 | 16.45±0.11 |
| 16 | 3.0/86.0/11 | 2.39±0.04 | 2.12±0.21 | 0.362±0.001 | 18.48±0.26 |
| 17 | 3.0/86.0/13 | 2.38±0.01 | 3.20±0.20 | 0.331±0.004 | 17.92±0.28 |
| 18 | 3.0/86.0/15 | 2.32±0.01 | 3.24±0.53 | 0.380±0.001 | 19.40±0.26 |
| 19 | 4.0/76.0/11 | 2.10±0.02 | 2.14±0.33 | 1.233±0.024 | 6.15±0.13 |
| 20 | 4.0/76.0/13 | 2.10±0.03 | 2.78±0.39 | 1.200±0.028 | 8.82±0.84 |
| 21 | 4.0/76.0/15 | 2.02±0.04 | 2.70±0.45 | 0.937±0.040 | 18.64±0.27 |
| 22 | 4.0/81.0/11 | 2.23±0.03 | 3.04±0.56 | 0.907±0.027 | 5.07±0.12 |
| 23 | 4.0/81.0/13 | 2.16±0.03 | 3.18±0.43 | 0.853±0.014 | 10.88±3.32 |
| 24 | 4.0/81.0/15 | 2.23±0.05 | 3.19±0.23 | 0.559±0.010 | 19.36±0.23 |
| 25 | 4.0/86.0/11 | 2.34±0.00 | 3.51±0.36 | 0.498±0.028 | 5.71±0.18 |
| 26 | 4.0/86.0/13 | 2.22±0.04 | 3.59±0.30 | 0.468±0.015 | 19.12±0.18 |
| 27 | 4.0/86.0/15 | 2.22±0.02 | 4.06±0.48 | 0.353±0.006 | 20.32±0.39 |
a) Formulation variables are as follows: A, surfactant content (wt%); B, water content (wt%); C, HLB. b) ADC values obtained from ROIs of the ADC maps after storage at 60°C for 12 d. Each value represents the mean±S.D. of three determinations.
The properties of the different samples differed considerably, suggesting that the formulation variables have a great impact on the state of water in the samples. To determine the effects of the formulation variables in more detail, an ANOVA was conducted (Table 3). A higher Fo value means a more substantial contribution of the factors. The results of the analysis indicated that all the formulation variables that we studied had a significant effect on the physical properties. In particular, the effects of surfactant content and water content were stronger than the effect of HLB. The change in behavior of the physical properties as a function of the formulation variables were as follows: (1) T1 of emulsions decreased with higher surfactant content, lower water content, and higher HLB value; (2) D decreased with lower contents of surfactant and water, and lower HLB value; and (3) viscosity increased with higher surfactant content and lower water content.
Table 3. ANOVA Tables for Physical Properties of the Model Emulsions
| Formulation variables | DF | T1 | D | Viscosity |
|---|
| MS | Fo | MS | Fo | MS | Fo |
|---|
| Surfactant content (wt%) | 2 | 0.638 | 114.9** | 11.54 | 35.3** | 1.56 | 78.2** |
| Water content (wt%) | 2 | 0.500 | 90.1** | 6.64 | 20.3** | 3.34 | 166.9** |
| HLB | 2 | 0.081 | 14.5** | 4.30 | 13.1** | 0.23 | 11.4** |
DF, degrees of freedom; MS, mean square; Fo, observed F value. ** p<0.01.
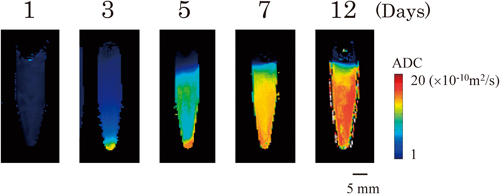
Subsequently, the physical stability of the samples was investigated. Prior to the MRI measurements, the samples were stored at 60°C for designated periods to accelerate their destabilization processes. As an example result, the time course of ADC maps of emulsion #9 (see Table 2) is shown in Fig. 1. ADC at the lower region gradually increased as the storage period increased, indicating the development of creaming in the samples. As stated in the Introduction, the states of water in emulsions are sensitive to their microenvironment.2) The molecular mobility of water adjacent to oil droplets is more restricted than that of bulk water because surfactants are concentrated on the surface of oil droplets and they can strongly interact with water molecules. Due to the difference in the state of water, an ADC map enables us to visualize creaming in an emulsion noninvasively. We note that the detection sensitivity of the method is very high; slight creaming, which is not visible to the naked eye, is clearly seen.4) We conducted the same MRI experiments with all samples, and then extracted ADC values at the region of interest (ROI) from each ADC map (after storage at 60°C over a period of up to 12 d) (Table 2). The position of the ROI was set at 5 mm above the bottom of the tube. The ADC values were used as an index to compare physical stability of each of the samples.
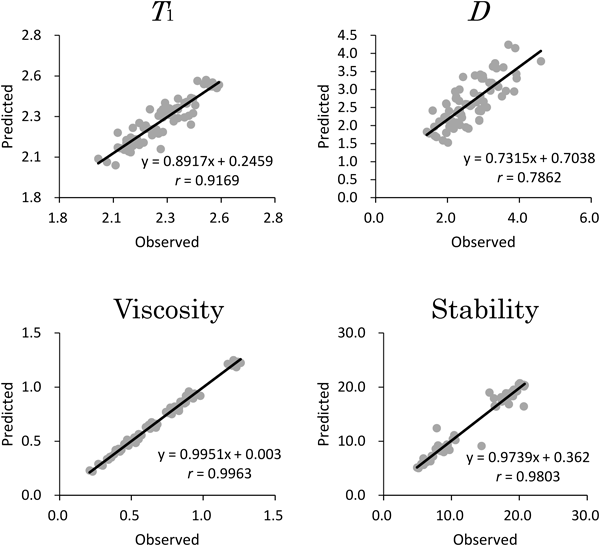
Based on the observed data, we tried to gain a comprehensive understanding of the physical stability of the model emulsion. First, we constructed the correlation models between formulation variables and characteristics based on the experimental data using RSM-S. RSM-S is a nonlinear response surface method, and it can predict the nonlinear relationship between multivariate data with high accuracy.15) Figure 2 shows the results of leave-one-out cross-validation. The correlation coefficients (r) for the response variables were high enough, and the slopes and the intercepts converged along the y=x line (Fig. 2), indicating construction of a reliable correlation model between formulation variables and responses. Response surfaces generated by RSM-S are shown in supplementary material (see Fig. S1). As anticipated, the relationships between formulation variables and responses were complicated and nonlinear. RSM is powerful tool to construct a correlation model, and it enables one to visualize the input–output relationships. However, it is difficult for the resultant response surfaces to express numerous relationships between factors at the same time, because the response surface is limited to express relationships in a maximum of three dimensions; it includes two formulation variables and one response. As an intention of this study was also to understand the overall relationships among factors, besides understanding the exact effect of each formulation variable on the responses, we conducted further SOM analysis.
SOM is a feedforward-type neural network model. It enables the expression of relationships of multidimensional data as a two-dimensional surface.16) Applications of the SOM have been reported across the range of pharmaceutical and medical fields.17–19) We also have been applying this promising technique for the formulation design of pharmaceuticals.10,11,20,21) The typical structure of the SOM comprises one input layer and one output layer.16) The output layer has an array of nodes, and each node has the same number of parametric reference vectors as the input vector. The nodes in the output layer associate with the adjacent ones; thus, the distance between the nodes expresses the degree of similarity and neighboring nodes have similar properties. By comparing the patterns of the maps and the spatial position of each node, we can perceive the relationships among factors. Although SOM analysis can be performed using only observed data, as far as this study is concerned, this approach is likely to bias the SOM analysis because the distribution of the observed data in the data space is too sparse to express a full picture of the complicated relationships between formulation variables and responses. We took account of this issue and generated a large number of data sets of untested samples using the RSM-S. By compensating the large volume of data generated by RSM-S in the sparse data space, reliable SOM analysis could be expected.
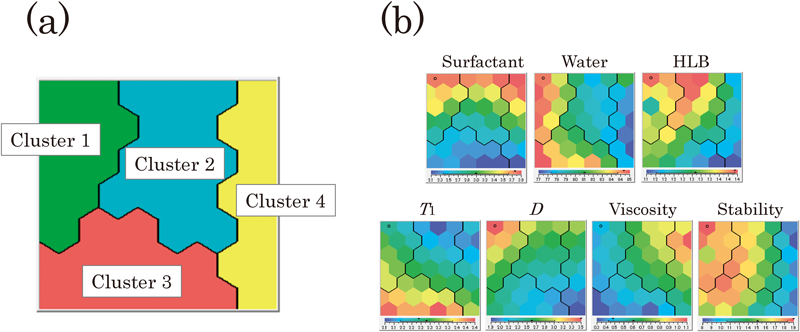
Resulting from the SOM analysis, formulations of the untested emulsions were divided into four distinct clusters in terms of the similarity of their physical properties (Fig. 3a). As mentioned, this study employed the ADC value of the ROI (after storage at 60°C over a period of up to 12 d) as an index to evaluate the physical stability. The region having lower value (blue) can be regarded as being stable. We also summarized the formulation variables and responses of each cluster (see Table 4). Clusters 4 comprised stable emulsions, while the most unstable emulsions were clustered as cluster 1. Cluster 2 was characterized as having the highest HLB value, while cluster 3 was characterized as having highest T1 and lowest viscosity; they were much more unstable than cluster 4. Obvious differences were observed when the maps of cluster 4 were compared to those of cluster 1. Regarding formulation variables, cluster 4 had a lower water content and HLB value, while cluster 1 had a higher water content. Regarding the physical properties, cluster 4 had lower T1 and D and higher viscosity, while cluster 1 had higher D and lower viscosity. These changed behaviors strongly support the fact that the state of water is crucial to the physical stability of the emulsion; namely, restricted water molecules contribute significantly to the stabilization of the emulsion.
Table 4. Formulation Variables and Responses of Each Cluster Estimated by RSM-S and SOM Analysis
| Factors | Cluster 1 | Cluster 2 | Cluster 3 | Cluster 4 |
|---|
| Formulation variables |
| Surfactant contents (%) | 3.55±0.23 | 3.00±0.24 | 2.39±0.28 | 3.19±0.25 |
| Water contents (%) | 84.1±1.1 | 79.0±1.9 | 83.9±0.6 | 76.6±0.8 |
| HLB | 13.5±0.9 | 13.6±0.9 | 12.5±1.1 | 11.8±0.7 |
| Characteristics |
| T1 (s) | 2.25±0.02 | 2.20±0.03 | 2.39±0.01 | 2.18±0.02 |
| D (×10−10 m2/s) | 3.17±0.15 | 2.51±0.09 | 2.34±0.08 | 2.26±0.08 |
| Viscosity (Pa·s) | 0.52±0.03 | 0.77±0.05 | 0.40±0.03 | 0.86±0.07 |
| Stability | 17.62±0.94 | 16.24±0.92 | 16.16±0.46 | 8.45±1.07 |
Each value represents the mean±S.D.
Latent relationships among the factors were deduced from the feature maps. Regarding the formulation variables, different patterns were observed from the maps, which indicated that their modes of action on the characteristics differed. As for the relationships between physical properties, similar patterns were observed from the feature maps of T1 and viscosity. For example, the lower left region of the map shows higher T1 and lower viscosity, while the upper right region shows lower T1 and higher viscosity. Therefore, as far as the model emulsion is concerned, T1 is very closely associated with the viscosity; it was obvious that the T1 values increased with decreasing the viscosity. Among the variables, the pattern of HLB was the most similar to that of the physical stability, suggesting that HLB is a predominant factor for the stabilization of the model emulsion. This is a reasonable result because the HLB value is known to affect significantly the dispersion stability of emulsions.4,22,23) From these findings, we clarified detailed relationships concerning the physical stability of the model emulsion.
Conclusion
This study clarified that the state of water plays a crucial role in the physical stability of emulsions. Moreover, according to results of RSM-S and SOM analyses, this study provided us with a comprehensive understanding of the formulation variables, physical properties, and stability concerning the preparation of pharmaceutical emulsions. We believe that our findings offer valuable insight into the development of pharmaceutical emulsions.
Acknowledgments
This study was supported by a Grant-in-Aid for Scientific Research from the Japan Society for the Promotion of Science (#25460045) and The Research Foundation for Pharmaceutical Sciences. We thank Mr. Koji Ito at Nikko Chemicals for a generous gift of POE behenyl ether (NIKKOL BB-20), sorbitan stearate (NIKKOL SS-10MV) and glyceryl triisooctanoate (NIKKOL Trifat S-308).
Conflict of Interest
The authors declare no conflict of interest.
Supplementary Materials
The online version of this article contains supplementary materials.
References
- 1) Aulton M. E., Taylor K. M. G., “Aulton’s pharmaceutics: The design and manufacture of medicines,” Elsevier, Edinburgh, 2013.
- 2) Nishikawa M., Onuki Y., Okuno Y., Takayama K., Chem. Pharm. Bull., 59, 332–337 (2011).
- 3) Onuki Y., Funatani C., Yokawa T., Yamamoto Y., Fukami T., Koide T., Obata Y., Takayama K., Chem. Pharm. Bull., 63, 377–383 (2015).
- 4) Onuki Y., Horita A., Kuribayashi H., Okuno Y., Obata Y., Takayama K., Drug Dev. Ind. Pharm., 40, 937–943 (2014).
- 5) Tadros T. F., Vandamme A., Levecke B., Booten K., Stevens C. V., Adv. Colloid. Interfac, 108–109, 207–226 (2004).
- 6) Napper D. H., “Polymeric stabilization of dispersions,” Academic Press, London, 1983.
- 7) Kingsley P. B., Concepts Magn. Reson., 11, 243–276 (1999).
- 8) Yilmaz A., Budak H., Ulak F. S., Magn. Reson. Imaging, 26, 254–260 (2008).
- 9) Fleysher L., Fleysher R., Liu S., Zaaraoui W., Gonen O., Magn. Reson. Med., 57, 380–387 (2007).
- 10) Yasuda A., Onuki Y., Obata Y., Yamamoto R., Takayama K., Chem. Pharm. Bull., 61, 304–309 (2013).
- 11) Yasuda A., Onuki Y., Kikuchi S., Takayama K., J. Pharm. Sci., 99, 4535–4542 (2010).
- 12) Wayne R. C., Cotts R. M., Phys. Rev., 151, 264–273 (1966).
- 13) Robertson B., Phys. Rev., 151, 273–277 (1966).
- 14) Onuki Y., Hasegawa N., Kida C., Obata Y., Takayama K., J. Pharm. Sci., 103, 3532–3541 (2014).
- 15) Wahba G., “Spline models for observational data,” Society for Industrial and Applied Mathematics, Philadelphia, PA, 1990.
- 16) Kohonen T., “Self-organizing maps,” Springer Series in Information Sciences, Berlin, 1995.
- 17) Schneider G., Nettekoven M., J. Comb. Chem., 5, 233–237 (2003).
- 18) Wang Y. H., Li Y., Yang S. L., Yang L., J. Chem. Inf. Model., 45, 750–757 (2005).
- 19) Kaiser D., Terfloth L., Kopp S., Schulz J., de Laet R., Chiba P., Ecker G. F., Gasteiger J., J. Med. Chem., 50, 1698–1702 (2007).
- 20) Kikuchi S., Onuki Y., Yasuda A., Hayashi Y., Takayama K., J. Pharm. Sci., 100, 964–975 (2011).
- 21) Onuki Y., Kawai S., Arai H., Maeda J., Takagaki K., Takayama K., J. Pharm. Sci., 101, 2372–2381 (2012).
- 22) Hessien M., Singh N., Kim C., Prouzet E., Langmuir, 27, 2299–2307 (2011).
- 23) Macedo J. P. F., Fernandes L. L., Formiga F. R., Reis M. F., Nagashima Júnior T., Soares L. A., Egito E. S. T., AAPS PharmSciTech, 7, E146–E152 (2006).