Abstract
A rapid, sensitive, and specific analytical method for the determination of 1-hydroxyethylidene-1,1-diphosphonic acid (HEDP) on uncooked foods after treatment with a peracetic acid–based sanitizer (PAS) was developed. The method involves simple sample preparation steps and analysis using ion chromatography (IC) coupled with tandem mass spectrometry (MS/MS). The quantification limits of HEDP on uncooked foods are 0.007 mg/kg for vegetables and fruits and 0.2 mg/kg for meats. The recovery and relative standard deviation (RSD) of HEDP analyses of uncooked foods ranged from 73.9 to 103.8% and 1.9 to 12.6%, respectively. The method’s accuracy and precision were evaluated by inter-day recovery tests. The recovery for all samples ranged from 93.6 to 101.2%, and the within-laboratory repeatability and reproducibility were evaluated based on RSD values, which were less than 6.9 and 11.5%, respectively. Analyses of PAS-treated fruits and vegetables using the developed method indicated levels of HEDP ranging from 0.008 to 0.351 mg/kg. Therefore, the results of the present study suggest that the proposed method is an accurate, precise, and reliable way to determine residual HEDP levels on PAS-treated uncooked foods.
Peracetic acid–based sanitizers (PAS) are antimicrobial agents that are widely used to treat foods and pharmaceuticals because they are effective against a wide range of microorganisms. PAS can inactivate Gram-negative bacteria (e.g., Escherichia coli), Gram-positive bacteria (e.g., Staphylococcus aureus), yeast, and microbial spores (e.g., those of Clostridium sp.) without high temperature.1,2) Assessments of the safety of PAS for uncooked foods have been conducted by the Food and Agriculture Organization of the United Nations (FAO)/WHO Joint Expert Committee on Food Additives (JECFA),3) the European Food Safety Authority, and Food Standards Australia New Zealand.4,5) Therefore, the use of PAS for sanitizing uncooked foods has been authorized in the U.S.A., Canada, Australia, and New Zealand. As of 2015, the use of PAS for food sanitizing has not been approved in Japan. However, in 2013, it was found that the PAS-treated uncooked foods might be imported to Japan from other countries. Therefore, in 2013, an expert committee of the Ministry of Health, Labour and Welfare of Japan implemented a program to monitor the levels of residual PAS on uncooked foods imported from countries that do not regulate treatment of uncooked foods with PAS until PAS could be designated a food additive.
Residual materials on the surface of PAS-treated foods were evaluated by the JECFA.
PAS are composed of peracetic acid (PAA), acetic acid, octanoic acid, hydrogen peroxide (H2O2), and 1-hydroxyethylidene-1,1-diphosphonic acid (HEDP). PAA and H2O2 are very reactive and quickly degrade into acetic acid, oxygen, and water on the surface of PAS-treated uncooked foods. HEDP, in contrast, is a non-reactive and non-volatile substance under conditions of general use.3) Therefore, previous reports regarding safety evaluations of PAS by international organizations concluded that HEDP might remain on the surface of PAS-treated uncooked foods under general conditions of transportation and storage.3–5)
HEDP is a first-generation bisphosphonate used in the treatment of bone diseases, such as Paget’s disease and osteoporosis. However, HEDP was originally developed in the 19th century as a chelator for water softeners. HEDP is blended in PAS as a chelator to stabilize the effectiveness of PAS during storage, as PAA and H2O2 are degraded by Fenton-type reactions in the presence of free metal ions. However, to date, no methods for the determination of HEDP on uncooked foods have been reported.
Several methods for the determination of HEDP (excluding determination on uncooked foods) have been reported, including methods involving post-column indirect fluorescence detection,6) ion chromatography–inductively coupled plasma mass spectrometry,7) evaporative light-scattering detection,8) ion chromatography–indirect UV detection,9) LC-MS with ion-pairing agents, and determination of HEDP derivatives using GC-MS.10,11) As the estimated levels of residual HEDP on the surface of PAS-treated uncooked foods reportedly range from 0.004 to 0.2 mg/kg,3) the limits of detection of HEDP of these previously reported methods would be insufficient for experimental analyses. Moreover, these previous methods were not evaluated for the determination of HEDP on samples with a complex matrix, such as uncooked foods.
In this study, we developed and evaluated an analytical method for the determination of HEDP on the surface of uncooked foods. The analytical method employs simple sample preparation procedures with analysis by ion chromatography (IC) coupled with tandem mass spectrometry (MS/MS). The method provides for accurate determination of trace levels of HEDP.
Experimental
Chemicals and ReagentsHEDP solution (61% (w/w)), disodium pamidronate hydrate (PAM), alendronate sodium trihydrate (ALD), and monosodium risedronate hemipentahydrate (RIS) were purchased from Tokyo Chemical Industry (Tokyo, Japan). Zoledronic acid monohydrate (ZOL), nitrilotris (methylene) triphosphonic acid (NTMP), and methylphosphonic acid (MPA) were purchased from Sigma-Aldrich (St. Louis, MO, U.S.A.). All other reagents were analytical grade and were purchased from Kanto Chemical (Tokyo, Japan). A PAS product for sanitization of fruits and vegetables was provided from Ecolab Japan (Tokyo, Japan). The water used in the study was ultrapure, purified to 18 MΩ·cm using a Milli-Q Gradient A10 system (Merck Millipore Corp., Billerica, MA, U.S.A.).
HEDP stock solution was prepared by diluting HEDP solution with water. The HEDP stock solution was subsequently diluted with appropriate volumes of water in order to prepare working solutions over the concentration range 0.05 to 1 µg/mL. RIS working solution was prepared by dissolving RIS in water to 1 µg/mL. All solutions were stored in polyethylene (PE) bottles (Nalgene, NY, U.S.A.) at 4°C until further use.
IC ConditionsLC separations were performed on an IC system (Dionex ICS-2100; Thermo Fisher Scientific, CA, U.S.A.) equipped with the following components: a conductivity detector (DS-6), an auto sampler (AS-AP), a suppressor (AERS 500, 2 mm i.d.), and eluent generator (EGC III KOH). The eluent was 30 mM potassium hydrate in 10% methanol. The eluent was generated using an EGC III KOH generator (Dionex) at an isocratic flow rate of 0.25 mL/min. An IonPac AS-11 anion exchange analytical column (250×2.0 mm i.d.) was used along with an IonPac AG 11 guard column (50×2.0 mm i.d.). The column oven was set at 35°C. The suppressor current was set at 19 mA. The sample injection volume was 25 µL. The instrument was controlled using Dionex Chromeleon 7.1 Chromatography Data System software. All samples for quantification analysis were injected two times, and the results of two independent injections were averaged. The IC was connected with a Quattro Premier/XE tandem quadrupole mass spectrometer (Waters, Milford, MA, U.S.A.) as the detector for IC-MS/MS analysis.
Mass Spectrometry ConditionsThe Quattro Premier/XE tandem quadrupole mass spectrometer was operated in the electrospray ionization (ESI) negative mode as the MS/MS detector. The instrument was controlled using MassLynx V4.1 software (Waters). The capillary voltage, cone voltage, and collision energy were set at 2 kV, 20 V, and 20 eV, respectively. The source temperature and desolvation temperature were set at 120 and 400°C, respectively, and the desolvation and cone gas flow rates were 800 and 50 L/h, respectively. Multiple reaction monitoring mode was used to monitor both HEDP and RIS. HEDP was monitored using the m/z 205 [M−H]− to m/z 123 and 169 transitions, whereas RIS was monitored using the m/z 282 [M−H]− to m/z 200 transition. The scan span was 0.5 s. The total analytical time was 11 min. The inlet flow to the MS/MS detector was split to waste for the first 6 min after injection.
Sample PreparationFruit, vegetable, and meat samples were purchased from supermarkets in Tokyo, Japan (Table 1). For fruits and vegetables, each sample was placed in a PE bag (Ziploc, Asahi Kasei Home Products Corp., Tokyo, Japan) or a 50-mL PE tube (Labcon, Petaluma, CA, U.S.A.), and a volume of water equivalent to the weight of the sample was added for HEDP extraction. A volume of water triple the weight of the sample was used for the extraction of samples exhibiting a high surface area to weight ratio, such as cherries and broccoli. Next, the samples were sonicated for 30 min using an SV-18TH sonicating water bath (Shibata Scientific Technology, Tokyo, Japan). The extraction solution was then subjected to the sample clean-up procedure (described below). For meats, a 5-g sample was weighed and transferred into a 50-mL PE tube (Labcon), 20 mL of water was added, and the sample was sonicated for 15 min. The water layer was then collected into a 50-mL PE tube (DigiTUBE, SCP Science Co., Baie-D’Urfé, QC, Canada). The extraction process was repeated, and the 40 mL of collected water layer was adjusted to 50 mL with water and used as the extraction solution.
Table 1. Recovery of HEDP on Uncooked Foods at Levels Near the Limit of Quantification
| Sample | Spiked level (mg/kg) | Recovery (%) | RSDa) (%) |
|---|
| Fruits | | | |
| Cherry | 0.030 | 76.6 | 2.9 |
| Grapefruit | 0.010 | 87.3 | 1.9 |
| Kiwi | 0.010 | 73.9 | 11.0 |
| Lemon | 0.010 | 82.6 | 4.7 |
| Lime | 0.010 | 103.8 | 8.8 |
| Orange | 0.010 | 89.0 | 3.1 |
| Papaya | 0.010 | 102.0 | 12.6 |
| Vegetables | | | |
| Broccoli | 0.030 | 89.9 | 4.1 |
| Celery | 0.010 | 95.9 | 8.9 |
| Meats | | | |
| Beef | 0.40 | 80.3 | 10.8 |
| Chicken | 0.40 | 84.0 | 4.4 |
| Pork | 0.40 | 90.1 | 10.0 |
a) RSD, relative standard deviation of recoveries. n=3.
The sample clean-up procedure was as follows. The 5 mL of extraction solution was passed through a 0.45-µm polytetrafluoroethylene (PTFE) filter (Millex, Merck Millipore, Bedford, MA, U.S.A.) connected with a strong cation exchange solid-phase extraction cartridge (Bond Elut SCX, 500 mg, Agilent Technologies, Santa Clara, CA, U.S.A.) preconditioned with 5 mL of methanol and 5 mL of water. The first 2 mL of flow-through was discarded to waste, then another 3 mL of the flow-through was collected. A total of 1 mL of the collected flow-through was added with 5 µL of RIS working solution and used as the sample solution for IC-MS/MS analysis.
Calibration CurvesMatrix-matched standards were prepared by adding aliquots of HEDP working solution and RIS to the sample extracts after sample preparation of each uncooked food sample. Matrix-matched standards were prepared at five HEDP concentrations (0.005 to 0.06 mg/L for fruits and vegetables, 0.02 to 0.1 mg/L for meats). Calibration curves were constructed by plotting the concentration of HEDP versus the ratio of HEDP and RIS peak areas. Linear calibration curves were obtained, and it was deemed acceptable if the calculated coefficient of determination (R2) was greater than 0.99.
Method ValidationThe instrumental limit of quantification (ILOQ) and limit of detection (ILOD) for HEDP were defined as the level at which the ratio of signal to peak-to-peak noise was 10 : 1 and 3 : 1, respectively. The ILOQ was obtained from the average of six injections of approximately the minimum quantification level of HEDP-spiked, HEDP-free sample solution for each uncooked food sample. The method limit of quantification (MLOQ) was calculated using the following formula: MLQ (mg/kg)=ILOQ (mg/L)×[volume of extraction solution (L)/uncooked food weight (kg)].
Recovery tests were carried out at approximately 2-times the MLOQ (0.03 mg/kg for cherries and broccoli, 0.01 mg/kg for other fruits and vegetables, 0.4 mg/kg for meats) of HEDP spiked on the uncooked foods. Recovery tests were performed to investigate the within-laboratory accuracy and precision of the developed method. The spiked concentrations of HEDP were 2- and 20-times the MLOQ (0.2 mg/kg for beef, 0.02 mg/kg for broccoli). The accuracy of the developed method was evaluated based on the means of the inter-day recoveries. The within-laboratory repeatability and reproducibility of the developed method were assessed through repeatability relative standard deviation (RSDr) and reproducibility relative standard deviation (RSDR) data obtained from one-way ANOVA of the recovery rates. The recovery tests were performed with beef and broccoli as representative meat and vegetable samples, respectively.
Application of the Developed Method to PAS-Treated Uncooked FoodsPAS product (PAA ca. 12.3% (w/w)) was diluted with water to 80 mg/L of PAA. Samples of fruits and vegetables were dipped in the diluted PAS solution for 10 s and then removed from the solution and held for 5 s to drain excess PAS solution. The samples were completely dried using a WFO-400 forced air flow oven (Tokyo Rikakikai, Tokyo, Japan) at 40°C. The dried samples were processed using the sample preparation method (see “Sample Preparation” section above).
Results and Discussion
Method DevelopmentOptimization of Mass Spectrometry and ChromatographyHEDP has no functional group for UV absorption or fluorescence. Thus, the substance cannot be directly determined using common optical devices, such as a photodiode array or fluorescence detector. Although HEDP signals can be detected using a conductivity detector, the sensitivity is insufficient for determining ppb levels of HEDP. Therefore, we attempted to utilize MS/MS for HEDP determination.
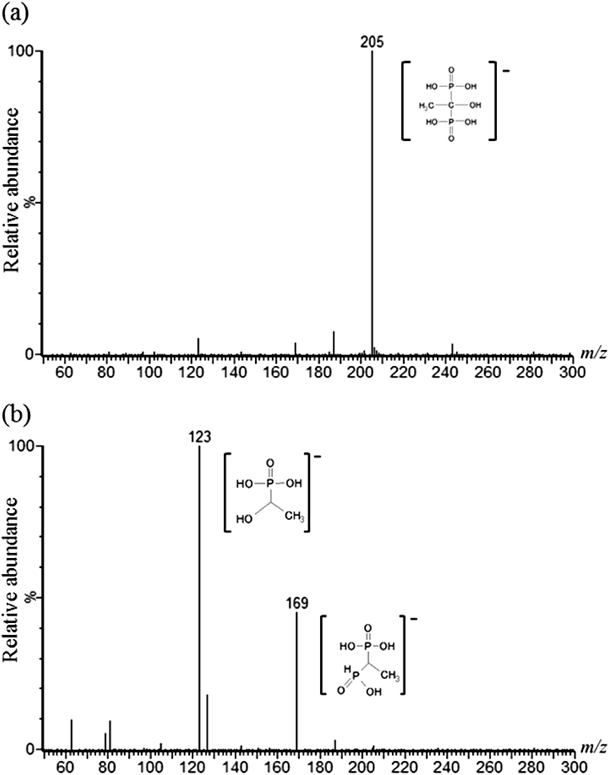
To optimize the MS/MS detection parameters for the determination of HEDP, a solution of 0.5 mg/L HEDP in 10% methanol was directly injected into the MS/MS detector. Figure 1a shows the MS of the HEDP solution (m/z 50–300). HEDP was detected at m/z 205 as a molecular ion [M−H]−. Figure 1b shows the result of a product ion scan of m/z 205, which yielded two major product ions, at m/z 123 and 169. Therefore, selected reaction monitoring (SRM) of m/z 205 to 123 and 169 was carried out for the quantification of HEDP. Moreover, the spectrum of the product ion scan of HEDP was similar to the HEDP spectrum of ESI Q-TOF MS analysis registered in an online data base.12) The MS/MS spectrum was obtained in ESI negative mode. ESI positive mode yielded m/z 207 as a molecular ion [M+H]+; however, the intensity was lower compared with negative mode. We optimized the MS/MS detection parameters to increase the intensity of the two product ions (as described in the “Mass Spectrometry Conditions” section above).
We then optimized the IC conditions for HEDP determination. We examined the use of an anion exchange column for HEDP determination. Anion exchange chromatography is commonly used for the separation of phosphonates,7,13) although hydrophilic interaction liquid chromatography (HILIC) is also used for this purpose.14) However, the shape of the HEDP peak was sub-optimal with the HILIC columns we tested, exhibiting characteristics such as peak splitting and tailing.
We then investigated the best eluent for HEDP separation using IC. Initially, we used 30 mM potassium hydroxide solution as the eluent; however, the HEDP peak exhibited severe tailing (peak asymmetry factor b/a >4). A previous study of HEDP determination reported similar peak tailing in separations using an anion exchange column, and the authors suggested that the peak shape could be improved by modification of the eluent.7) Therefore, we developed a modified eluent for HEDP separation. Previous studies reported that the addition of an organic solvent to aqueous eluents for IC leads to improved retention of ions on the resin.15) We therefore used 30 mM potassium hydroxide in 10% methanol as an eluent. Accordingly, the peak shape was improved by the addition of methanol to the eluent (peak asymmetry factor b/a <2). Moreover, the area of the HEDP peak was approximately 1.6-times that of the peak obtained using the eluent without methanol. The addition of organic solvent not only led to an increase in the peak area due to the improvement in peak shape but also enhanced the desolvation rate during ESI.
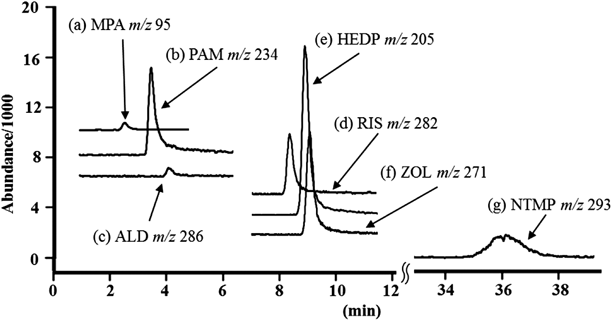
Selection of Internal StandardThe quantification of ILOQ-level analytes using MS/MS is significantly impacted by the stability of the detector’s sensitivity. Therefore, for the accurate quantification of trace levels of an analyte, it is helpful to identify an appropriate internal standard. We investigated six phosphate substances as candidate internal standards for IC-MS/MS in selected ion recording (SIR) mode. Figure 2 shows the SIR chromatograms of HEDP and the six candidate internal standards. NTMP was deemed inappropriate for use as an internal standard because the total analysis time (36.13 min) was too long. Moreover, MPA, PAM, and ALD were also deemed inappropriate as internal standards because the retention times of these substances (MPA: 2.64, PAM: 3.84, ALD: 4.47 min) were similar to those of the anions and organic acids generally contained in uncooked foods, such as nitrate and acetic acid. The retention time of ZOL (9.21 min) was close to that of HEDP (9.16 min). On the other hand, the RIS peak (8.26 min) was completely separated from the HEDP peak. Therefore, we adopted RIS as the internal standard for IC-MS/MS analyses of HEDP.
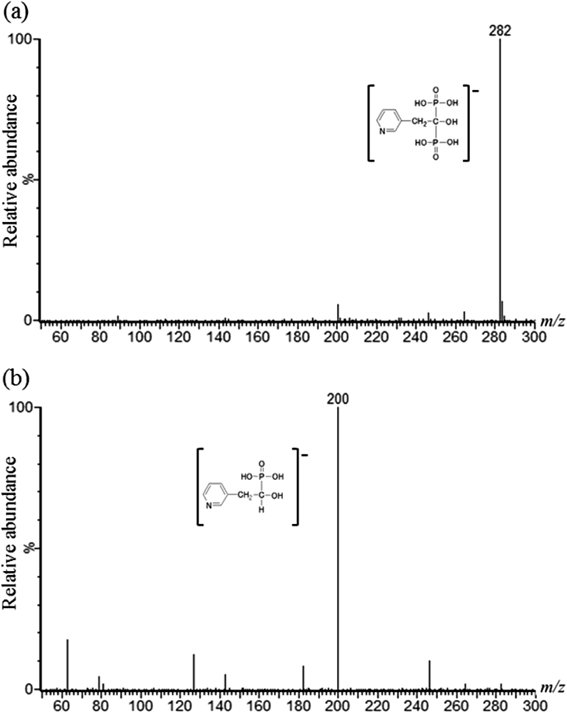
Figure 3a shows the MS of the RIS solution, in which RIS yielded m/z 283 as a molecular ion [M−H]−. Figure 3b shows the result of a product ion scan of m/z 283, which yielded a major product ion at m/z 200. Therefore, SRM of m/z 283 to 200 was carried out for RIS as an internal standard in IC-MS/MS analyses.
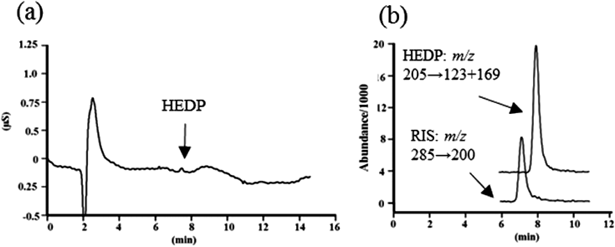
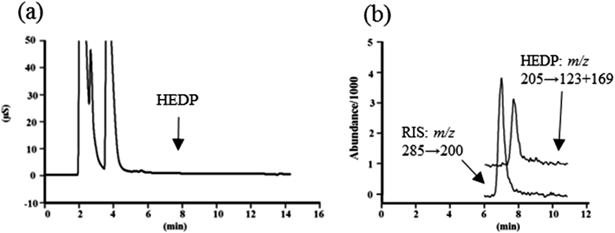
Figure 4 shows the IC and SRM chromatograms of 0.05 mg/L HEDP solution with RIS. HEDP could not be determined based on the IC chromatogram (Fig. 4a); however, the HEDP signal in the SRM chromatogram was quantifiable (Fig. 4b).
Development of a Method for Extracting HEDP from FoodsFor the extraction of HEDP from fruits and vegetables, a volume of water equal to the weight of the sample was used. However, for fruits and vegetables exhibiting a high surface area to weight ratio, the use of a volume of water equal to the weight of the sample was thought to be insufficient to completely cover the surface of the sample. Therefore, for uncooked foods exhibiting a high surface area to weight ratio, such as cherries and broccoli, residual HEDP was extracted using a volume of water equivalent to 3-times the weight of the sample. For meat samples, HEDP was extracted using a volume of water 10-times the weight of the sample in order to minimize matrix effects, such as ion suppression. HEDP was extracted from the uncooked foods into the water using sonication, and the resulting water layer was used as the extraction solution for analysis.
To determine the appropriate membrane filter to use for sample clean-up, HEDP solution (0.2 mg/L) was passed through three types of membrane filters made of different materials (polyvinylidene difluoride [PVDF], cellulose acetate [CLA], or polytetrafluoroethylene [PTFE]). The HEDP loss associated with filtration using the PVDF and CLA membrane filters was 27.5 and 15.5%, respectively (n=3). On the other hand, as minimal adsorption (1.1%) of HEDP was observed with the PTFE membrane filters, these were used for sample clean-up.
Several reports have suggested that metal ions can irreparably damage IC columns, resulting in poor peak shape in analyses of bisphosphonates.7,8,16) Therefore, to remove metal ions from the extraction solutions in the present study, the filtered extraction solutions were passed through an SCX column. Next, 5 µL of RIS working solution was added to the eluate from the SCX column, and this solution was used for IC-MS/MS analysis. Compared with other proposed methods, such as determination of HEDP by derivatization,13,17) the sample preparation methods developed in the present study are both simpler and more rapid.
Method ValidationLinearity of Calibration CurvesMS/MS detection using an ESI interface generally provides excellent selectivity and sensitivity for many target analytes; however, method recovery calculations and ILOQ values may be affected by ionization suppression/enhancement through co-eluting matrix constituents. Therefore, we adopted the combination of internal standard and matrix-matched methods for generating calibration curves in order to accurately quantify HEDP on uncooked foods. The calibration curves were generated from the analysis of blank sample solutions to which aliquots of HEDP standard solution and RIS solution were added. The calibration curve concentrations ranged from 0.005 to 0.06 mg/L for fruits and vegetables and 0.02 to 0.1 mg/L for meats.
The R2 values for calibration curves of papaya, celery, and beef were 0.994, 0.994, and 0.993, respectively. These results indicate that the method provides good linearity.
ILOQ and MLOQIn this study, the ILOQ of HEDP standard solution using IC-MS/MS was 0.005 mg/L. Other very sensitive methods for the determination of bisphosphonates (ILOQ=0.003 mg/L) have been reported.14,18) The ILOQ for IC-MS/MS determination of HEDP in the present study is similar to that of previously reported methods for the determination of other bisphosphonates.
The MLOQ for HEDP determination was 0.007 mg/kg for fruits and vegetables (0.02 mg/kg for broccoli and cherry), 0.1 mg/kg for beef, and 0.2 mg/kg for chicken and pork. These data suggest that the MLOQ is sufficient for the determination of residual HEDP on PAS-treated uncooked foods.
Recovery TestFigure 5 shows the IC and SRM chromatograms for the recovery test using beef as a representative uncooked food sample with a complex matrix. The IC chromatogram of the beef sample exhibited significant interfering signals (Fig. 5a); however, a quantifiable HEDP signal was observed on the SRM chromatogram of the beef sample spiked with 0.4 mg/kg of HEDP (Fig. 5b). These results indicate that the developed method is suitable for determining HEDP on uncooked, complex-matrix food samples.
As shown in Table 1, the recovery of HEDP for seven fruits ranged from 73.9 to 103.8%, with the relative standard deviation (RSD) ranging from 1.9 to 12.6%, whereas the recovery for two vegetables was 89.9 and 95.9% (RSD: 4.1, 8.9%, respectively), and the recovery for three meats ranged from 80.3 to 90.1% (RSD: 4.4 to 10.8%). These results suggest that the developed method provides good recovery and precision for the determination of residual HEDP on a variety of uncooked foods.
Accuracy and Precision of the Method for Determination of HEDP on Beef and BroccoliTo assess the accuracy and precision of the method, we performed inter-day recovery tests on five different days using two replicates prepared in parallel each day and two levels of HEDP in samples prepared from two uncooked foods (broccoli and beef). As shown in Table 2, the recovery ranged from 93.6 to 101.2% for all samples and spike concentrations. The RSDr and RSDR were less than 6.9 and 11.5%, respectively. These recovery results suggest that the developed method is capable of providing very accurate and precise determinations of trace levels of HEDP on uncooked foods.
Table 2. Inter-day Recovery, Repeatability, and Reproducibility of Determinations of HEDP on Broccoli and Beef
| Spiked level (mg/kg) | Broccoli | Beef |
|---|
| 0.06 | 0.6 | 0.4 | 4.0 |
|---|
| Recoverya) (%) | 93.6 | 94.0 | 96.0 | 101.2 |
| RSDrb) (%) | 2.9 | 5.9 | 6.9 | 5.7 |
| RSDRc) (%) | 5.4 | 5.9 | 11.5 | 6.9 |
a) Each recovery value represents the mean of results on five different days (two trials per day). b) RSDr, relative standard deviation for repeatability. c) RSDR, relative standard deviation for reproducibility. RSDr and RSDR were calculated by one-way ANOVA of the recovery values obtained on five different days.
The developed method was applied to PAS-treated fruits and vegetables. The PAS product was diluted to a maximum concentration of PAA (80 mg/L) for sanitizing fruits and vegetables. The determined level of HEDP in the diluted PAS was 2.03 mg/L, and the RSD was 5.7% (n=3).
Table 3 shows the determined levels of HEDP on PAS-treated fruits and vegetables. The average HEDP level ranged from 0.009 to 0.047 mg/kg for fruits and 0.008 to 0.317 mg/kg for vegetables. These levels of HEDP on PAS-treated fruits and vegetables were similar to those reported by the JECFA (0.0042–0.202 mg/kg).3) However, the experimentally determined levels of HEDP on PAS-treated broccoli and celery appeared to be slightly higher than the levels estimated by the JECFA. Moreover, the experimentally determined levels of HEDP on broccoli and celery were higher than the levels on the fruits and vegetables examined (Table 3). The higher levels of residual HEDP on PAS-treated broccoli and celery may be due to the complex surface structure and large surface area of these vegetables compared with the other fruits and vegetables examined, which have a less complex surface structure and lower surface area. Therefore, we attribute the differences in HEDP levels between the JECFA estimates and this study to differences in the surface structure and surface area of the food samples examined.
Table 3. Application of the Developed Method for the Determinatin of Residual HEDP on PAS-Treated Uncooked Foods
| Sample | Determined HEDPa)(mg/kg) | Averagec)(mg/kg) |
|---|
| Fruits | | |
| Cherry | 0.045–0.049 | 0.047 |
| Grapefruit | (0.005)b)–0.011 | 0.009 |
| Kiwi | 0.019–0.027 | 0.022 |
| Papaya | 0.008–0.011 | 0.009 |
| Vegetables | | |
| Broccoli | 0.284–0.351 | 0.317 |
| Celery | 0.141–0.217 | 0.170 |
| Red bell pepper | (0.006)b)–0.010 | 0.008 |
The uncooked food samples were treated by imitating the process of actual sanitization using a product of peracetic acid–based sanitizer (PAS). a) Determined levels of 1-hydroxyethylidene-1,1-diphosphonic acid (HEDP). b) Reference value (<Method limit of quantification (MLOQ)). c) Average of three tests. n=3.
For a safety assessment of residual HEDP on foods, the daily intake of HEDP from consuming PAS-treated foods in Japan was estimated by the Food Safety Commission of Japan (FSCJ) in 2015.19) Based on the toxicological evidence, the FSCJ concluded that the acceptable daily intake (ADI) is 0.013 mg/kg body weight (b.w.)/d.20) In addition, the FSCJ estimated that the daily intake of HEDP is 0.0014 mg/kg b.w./d. The estimation was calculated based on the highest level (0.202 mg/kg) of residual HEDP on vegetables in the JECFA report.3) However, we conservatively estimated the daily intake of HEDP using the highest level (0.351 mg/kg for broccoli) of residual HEDP determined in the present study. The resulting calculated daily intake was 0.0021 mg/kg b.w./d. These findings show that the present estimated daily intake of HEDP is still lower than the ADI established by the FSCJ.
Conclusion
In the present study, an analytical method for the determination of residual HEDP on PAS-treated uncooked foods was developed. The method consists of a simple sample preparation protocol followed by IC-MS/MS analysis. Sample preparation requires only three steps: sample preparation, filtration using a PTFE membrane filter, and purification using an SCX cartridge. The total time required for the determination of HEDP on uncooked foods is approximately 50 min (sample extraction: 30 min; sample clean-up [filtration and purification]: 10 min; IC-MS/MS analysis: 11 min). The method has a low ILOQ (0.005 mg/L) for HEDP determination using IC-MS/MS. The MLOQ for HEDP was 0.007 mg/kg for fruits and vegetables (0.02 mg/kg for cherries and broccoli), 0.1 mg/kg for beef, and 0.2 mg/kg for chicken and pork. The developed method was validated for the determination of HEDP on uncooked foods and exhibited good calibration curve linearity. The recovery of HEDP from fruits and vegetables ranged from 73.9 to 103.8%, with the RSD ranging from 1.9 to 12.6%, and the recovery of HEDP from meats ranged from 80.3 to 90.1%, with the RSD ranging from 4.4 to 10.8%. The recovery was satisfactory for the determination of HEDP on PAS-treated fruits and vegetables. The accuracy of the developed method was evaluated based on the recovery means, which ranged from 93.6 to 101.2% for all spiked samples. The within-laboratory repeatability and reproducibility of the developed method were evaluated based on the RSD. The RSDr and RSDR were less than 6.9 and 11.5%, respectively, for all tested HEDP levels and samples. Accordingly, the accuracy and precision are satisfactory for the determination of HEDP on uncooked foods. The developed method was applied to the analysis of a variety of PAS-treated fruits and vegetables. The average level of residual HEDP ranged from 0.009 to 0.047 mg/kg for PAS-treated fruits and 0.008 to 0.317 mg/kg for PAS-treated vegetables. The results of this study suggest that the proposed method is an accurate, precise, and practical means of determining residual HEDP on PAS-treated uncooked foods.
Acknowledgment
This research was supported by Grants from the Ministry of Health, Labour, and Welfare of Japan.
Conflict of Interest
The authors declare no conflict of interest.
References
- 1) Oakes T. R., Stanley P. M., Keller J. D., U. S. Patent 5200189A (1993).
- 2) Broda D. M., Lett. Appl. Microbiol., 45, 336–341 (2007).
- 3) JECFA, WHO Food Addit. Ser., 54, 103–107 (2006).
- 4) FSANZ, “Application A513 Octanoic Acid as a Processing Aid.”: ‹http://www.foodstandards.gov.au/code/applications/pages/applicationa513octan2312.aspx›, cited 2016.
- 5) EFSA, Eur. Food Saf. Auth. J., 306, 1–10 (2005).
- 6) Lovdahl M. J., Pietrzyk D. J., J. Chromatogr. A, 850, 143–152 (1999).
- 7) Kovačevič M., Gartner A., Novič M., J. Chromatogr. A, 1039, 77–82 (2004).
- 8) Xie Z., Jiang Y., Zhang D., J. Chromatogr. A, 1104, 173–178 (2006).
- 9) Fernandes C., Leite R. S., Lanças F. M., J. Chromatogr. Sci., 45, 236–241 (2007).
- 10) Warnke M. M., Breitbach Z. S., Dodbiba E., Crank J. A., Payagala T., Sharma P., Wanigasekara E., Zhang X., Armstrong D. W., Anal. Chim. Acta, 633, 232–237 (2009).
- 11) Yuzawa T., Watanabe C., Tsuge S., Freeman R. R., Matherly R., J. Chromatogr. A, 1216, 5292–5295 (2009).
- 12) “Scripps Center For Metabolomics and Mass Spectrometry-METLIN”: ‹https://metlin.scripps.edu/metabo_info.php?molid=2629›, cited 23 June, 2016.
- 13) Peng S. X., Dansereau S. M., J. Chromatogr. A, 914, 105–110 (2001).
- 14) Bertolini T., Vicentini L., Boschetti S., Andreatta P., Gatti R., J. Chromatogr. A, 1365, 131–139 (2014).
- 15) Fritz J. S., J. Chromatogr. A, 1085, 8–17 (2005).
- 16) Huikko K., Kotiaho T., Yli-Kauhaluoma J., Kostiainen R., J. Mass Spectrom., 37, 197–208 (2002).
- 17) Ismail Z., Aldous S., Triggs E. J., Smithurst B. A., Barry H. D., J. Chromatogr. A, 404, 372–377 (1987).
- 18) Sparidans R. W., den Hartigh J., Beijnen J. H., Vermeij P., J. Chromatogr. B Biomed. Sci. Appl., 696, 137–144 (1997).
- 19) Food Safety Commission of Japan, “Evaluation report of food additive, ID: kya20151211476.”: ‹https://www.fsc.go.jp/fsciis/evaluationDocument/show/kya20151211476›, cited 17 August, 2016.
- 20) Nagata R., Nagata T., Onimaru T., Tanaka K., Onishi M., Nagata T., Clin. Rep., 23, 1257–1288 (1989).