Experimental
MaterialsDibasic sodium phosphate, monobasic sodium phosphate, sodium chloride, citric acid, sodium citrate and acetic acid were all special-grade reagents purchased from Kanto Chemical (Tokyo, Japan) or Wako Pure Chemical Industries (Osaka, Japan). L-Histidine was of USP compendium quality, and purchased from Research Organics Inc. (Cleveland, OH, U.S.A.). L-Histidine monohydrochloride was of Ph. Eur compendium quality, and purchased from Merck (Darmstadt, Germany). For pH adjustment, aqueous sodium hydroxide or aqueous hydrochloric acid were purchased from Kanto Chemical or Wako Pure Chemical Industries, Ltd. The other chemicals were all commercially available, reagent-grade chemicals. All water used in this study was ultrapure water supplied by an ultrapure water system.
Borosilicate (Type I) tubing, colorless glass vials were obtained from various suppliers with or without treatment on the surface as shown in Table 1. Except for some specific studies, we used 10 mL-sized vials. One of the vials in this study was a Type IA vial (33-1) with a coefficient of expansion (COE) of 33×10−7 per degree and all others were Type IB vials (51-1, 2, 3, 4 and 5) with a COE of 51×10−7 per degree.
Table 1. Vials Used in This Study
| Vial name | Vial 51-1 | Vial 51-2 | Vial 51-3 | Vial 51-4 | Vial 51-5 | Vial 33-1 |
|---|
| Supplier | Supplier A | Supplier B | Supplier C | Supplier D | Supplier E | Supplier F |
| Glass tubing | Type IB | Type IB | Type IB | Type IB | Type IB | Type IA |
| Coefficient of expansion (COE) (/°C) | 51×10−7 | 51×10−7 | 51×10−7 | 51×10−7 | 51×10−7 | 33×10−7 |
| Surface treatment used in this study | No treatment | No treatment | No treatment | No treatment | No treatment | No treatment |
| | Sulfur treatment | Sulfur treatment | | |
| SiO2 coating | | SiO2 coating | SiO2 coating | |
| Size used in this study | 10 mL size | 10 mL size | 10 mL size | 10 mL size | 10 mL size | 10 mL size |
| 20 mL size(a) | 20 mL size(a) | 100 mL size(a) | | |
a) Only for obtaining data shown in Table 2 and Fig. 2. b) Only for obtaining data shown in Figs. 5 and 6.
For rubber closures, S10-F6, D777-1 and RB2-40 closures whose surfaces were laminated by a fluororesin were obtained from Daikyo Seiko (Tokyo, Japan).
Buffer PreparationPhosphate buffer solutions were prepared from monobasic sodium phosphate or dibasic sodium phosphate and sodium hydroxide. Citrate buffer solutions were prepared from citric acid or sodium citrate and sodium hydroxide. Acetate buffer solutions were prepared from acetate and sodium hydroxide. Histidine buffer solutions were prepared from L-histidine or L-histidine monohydrochloride and hydrochloric acid. All of the buffer solutions contained 0.9% sodium chloride, which served as a tonicity agent.
Filling and Storage of the Sample SolutionRubber closures were washed with purified water and then autoclaved in a steam sterilizer (HV-25, Hirayama, Saitama, Japan) at 121°C for 30 min. Glass vials were washed with purified water and dried without heat sterilization. Sample solutions were filtered by a 0.22 µm Millex GV Durapore membrane filter (Merck Millipore, Billerica, MA, U.S.A.), and then each vial was filled with solution on a clean bench, and was immediately stoppered and capped. Each filled sample was stored at the given conditions. Except for some specific studies, we filled 5 mL of solution into each vial.
Treating Particles with Citric AcidTo confirm whether the particle contained Al in the phosphate buffer solution, according to our previous study12) a 1 mol/L citric acid aqueous solution was added to each sample solution, and the sample solutions were stored at 40°C for 2 d in plastic tubes. The final citrate concentrations in the vials were 20 mM.
Visual InspectionEach sample vial was inspected for insoluble particulate matter under a 5000 Lux light condition.
Laser Scanning Microscopy ObservationFor roughness measurement, we used a laser scanning microscope (VK-9500, Keyence, Osaka, Japan). Using a diamond cutter, each vial was cut to a sample size that was 10 mm in length from the bottom and 3 mm in width. For roughness measurement, we used Ra (arithmetic average roughness) as a common roughness parameter from JIS B 0601-1994.
Particle CountingTo confirm the results of visual inspection and to measure sizes of particles, a laser particle-counting instrument PC-2300 (Spectrex, CA, U.S.A.) was used. Features of this apparatus are described by Iacocca et al.6) Calibration was done using polystyrene spheres (4–5 µm, ca. 960 particles per mL). Prior to measurement, each vial exterior was wiped to remove surface contaminants and then the vial was gently swirled for approximately three seconds.
Inductively Coupled Plasma (ICP) AnalysisFor Al and Si concentration measurement, we used ICP-MS (7700x, Agilent Technologies, Waldbronn, Germany). Standard solutions were prepared by serial dilution of a standard 1000 mg/L of Al (Kanto Chemical, Tokyo, Japan) and Si (Merck, Darmstadt, Germany) with each buffer solution.
In situations necessitating the measurement of boron (B) as well as Al and Si, we used ICP-optical emission spectrometry (OES) (VISTA-PRO, Seiko Instruments, Chiba, Japan). Standard solutions were prepared by serial dilution of an ICP standard 1000 mg/L of multi-element IV (including Ag, Al, B, Ba, Bi, Ca, Cd, Co, Cr, Cu, Fe, Ga, In, K, Mg, Mn, Na, Ni, Pb, Sr, Tl, and Zn) and an ICP standard 1000 mg/L of Si (Merck) with 0.9% sodium chloride solution.
Heat TreatmentTo evaluate the effect of heat treatment on the glass vials, the given vials were heated in a clean oven (DRC633FA, Advantec, Tokyo, Japan).
Results and Discussion
The Observation of Particles in Phosphate Buffer in Glass Vials during StorageTable 2 shows the results of a visual inspection of the vials filled with phosphate buffer solution after storage at 5°C and 25°C. The phosphate buffer solution (16 mM, pH 7, containing 0.9% sodium chloride) was referred to in our previous report.12) Under the storage condition of 25°C for three months, particles were detected only in the 51-1 vial which was manufactured by Supplier A, and no particles were detected from the other vials for up to 6 months. After 12 months, particles were detected in all of the samples stored at 25°C. In the case of storage at 5°C, no particles were detected in all of the samples stored for 6 months and 7 in 10 samples showed particles after 12 months only in the 51-1 vials. Even after 24 months, the 51-2 vial from Supplier B and sulfur-treated 51-3 vial from Supplier C did not show particles.
Table 2. Results of Visual Inspection of Phosphate Buffer Solution in Vials from Three Different Suppliers
| Storage | Vials detected particles/vials inspected |
|---|
| Temp. | Period | Vial 51-1 (Non-treated, 10 mL fill, in 10 mL-size vial) | Vial 51-2 (Non-treated 10 mL fill, in 20 mL-size vial) | Vial 51-3 (Sulfur-treated, 10 mL fill, in 20 mL-size vial)) |
|---|
| 5°C | 6 months | 0/10 | 0/10 | 0/10 |
| 12 months | 7/10 | 0/10 | 0/10 |
| 24 months | 10/10 | 0/10 | 0/10 |
| 25°C | 3 months | 9/10 | 0/10 | 0/10 |
| 6 months | 10/10 | 0/10 | 0/10 |
| 12 months | 10/10 | 10/10 | 10/10 |
Phosphate buffer was 16 mM, pH 7 and contained 0.9% sodium chloride.
These particles observed in this experiment were transparent and reflected light irregularly. They were also observed as flakes in some of the vials because of their thinness (Fig. 1). Since the shape and transparency was similar to those formed in phosphate buffer stored at 40°C as reported previously,12) it is suggested that the particles were aluminum–phosphate complexes.
We measured Al and Si concentrations in the phosphate buffer during storage. As shown in Fig. 2, as expected, both Al and Si concentrations in 51-1 vials were higher than in other vials.
We added 20 mM of citric acid into the phosphate buffer to confirm whether aluminum–phosphate complexes existed in the phosphate buffer solution observed particles. As the result, some solutions showed an increase of Al. It is noteworthy that Al increased even in solutions in which no particles were observed. The increase of Al by adding citric acid suggests that the aluminum–phosphate complexes were dissolved with citric acid, and the aluminum–phosphate complexes existed even in vials in which particles were not observed. It is considered that the phosphate buffer solution which showed an increase of Al by adding citric acid had the potential to form visible particles.
Among the three vials, both Al and Si concentrations of the sulfur-treated 51-3 vial, which was manufactured by supplier C, were the lowest and the phosphate buffer solution in the vial did not show the increase of Al by adding citrate. This suggests that the vial has a low risk of particle formation.
The 51-1, 51-2 and 51-3 vials are made from borosilicate glass tubing manufactured by Nippon Electric Glass. The amount of SiO2 and Al2O3 in the glass from Nippon Electric Glass is 70–75 and 5–10%, respectively, and based on this formulation, the ratio of Si to Al as an atomic element is estimated to be approximately 6 to 13. The ratio of approximately 10 is quite similar to the ratio of the Si/Al concentration noted when citrate was added, and presents the fact that both Si and Al were eluted from the glass vials in ratios similar to the ratios of Si and Al found within the composition of the borosilicate glass. These results are consistent with the previous report which was conducted using a higher storage temperature.12,13)
In the case of these study conditions, Al itself would be stable as long as its concentration is below approximately 0.5 ppm and Al would precipitate when its concentration surpasses 0.5 ppm. In other words, Al would start precipitating when Si elutes more than approximately 5 ppm because Si elutes ten times as much as Al does. This threshold of Si concentration for precipitating aluminum–phosphate complexes is relatively lower than the threshold for the occurrence of delamination.6,8)
Provided that Si and Al are always eluted from the vial surface at the same ratio, it is noteworthy that the three different vials eluted at different rates at an early stage in time, especially during storage at 5°C. On the other hand, after three months, the eluting rates showed themselves to be similar.
It was considered that the result of the three different vials showing three different eluting rates was due to the homogeneity of the surfaces on the interiors of the containers, as USP ‹1660› describes.11) The description states that the process of forming tubular vials makes a nonhomogeneous surface chemistry on the interior of the container, especially above the heel of the container. The roughness of the surface is affected by the process parameter of the forming, and thus the roughness is dependent on each vial supplier.
In addition, the comparable eluting rates after three months suggests that these eluting rates are fundamentally dependent upon the borosilicate glass tube, regardless of the surface condition characterized by each vial manufacturer. This hypothesis is based on the results from our previous study that demonstrated the discussion in the following section.
Guadognino and Zuccato reported the importance of determining the Si concentration as the best indicator of incompatibility between the specific drug product formulation and its glass container.8) The results we studied here suggested also that the monitoring of SiO2 concentration indicates the risk of whether or not Al will precipitate, especially in a phosphate buffer solution.
Hereafter, we investigate the propensity of Si and Al elution by using vials from a more varied selection of suppliers, including two kinds of surface treatments, not only the sulfur treatment but also the SiO2-coating.
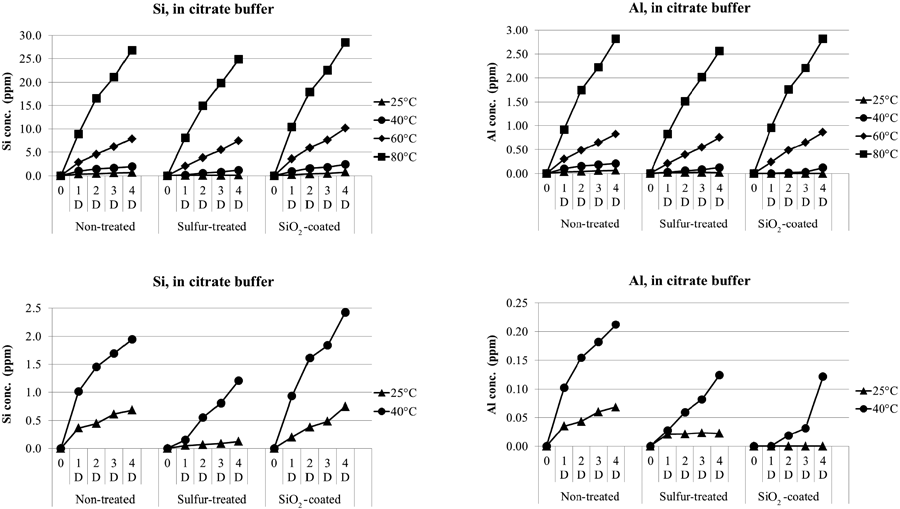
Comparison of Eluting Amounts among Surface Treatments at High TemperaturesFigure 3 shows the comparison of eluting amounts by citrate buffer (50 mM, pH 7) among non-treated, sulfur-treated, and SiO2-coated vials of type 51-4 at 25, 40, 60 or 80°C for up to 4 d. Also, Fig. 4 shows the comparison of eluting amounts by phosphate buffer (50 mM, pH 7).
For citrate buffer (Fig. 3), no particles were observed from any stored samples. Si elution apparently showed a similar rate at each temperature and showed itself to be higher at higher temperatures. In addition, in most cases, Al elution showed a linear trend similar to Si elution, where the elution rate of Al was one tenth that of Si. Exceptionally, SiO2-coated vials at a lower temperature condition showed an Al elution lower than one tenth of the Si elution. Particularly, the solution stored at 25°C did not elute Al from the SiO2-coated vials. The sulfur-treated vials, compared to non-treated vials, showed less Al and Si elution at any time point.
In the phosphate buffer (Fig. 4), different from in the citrate buffer, the eluting rate of Si decreased according to the storage period. This phenomenon is reasonable because Al2O3 has a lower solubility in phosphate buffer than in citrate buffer, as described in our previous report13) which discussed the solubilities. In addition, particles were visually observed in samples that were stored at 60 and 80°C. As shown in Fig. 4, the Al concentration at the time of measurement (opened mark) was lower than one tenth of the Si concentration. However, addition of citric acid into the stored sample raised the Al concentration (filled mark) and these concentrations were approximately one tenth of the Si concentration. The results indicate that the Al had already precipitated before the measurement. As the rationale of this phenomenon, Table 3 shows the differential value of the Al concentration which is obtained by subtracting the Al concentration of the intact sample from the Al concentration of the sample after adding 20 mM of citrate prior to the measurement. It is noteworthy that each average mean size in this measurement was within a range of 5–10 µm and any increases of the size were not observed (data not shown). In addition, the differential value of the Al concentration showed a high correlation to the count of particles by a correlation coefficient of 0.98. These results are consistent with the fact that the approximately 0.5 ppm of differential value of Al indicates the existence of visible particles as described in the previous section. Table 3 also shows that a slight difference of particle formation was observed among the three kinds of vial treatments. Particularly, the sulfur-treated vials showed a lower particulate formation than other vials, demonstrating the same profile as our previous study12) in which smaller amounts of aluminum–phosphate particulates were observed in sulfur-treated vials. It is considered that this phenomenon correlates with the result that not only in phosphate buffer, but also in citrate buffer, sulfur-treated vials show a lower Si elution than other vials, and consequently show a lower Al elution. Therefore, it is suggested that the difference of particle formation is due to the protective effect of sulfur treatment against the Al elution.
Table 3. The Differential Value of Al Concentration Which Is the Subtraction of the Concentration of Intact Sample from the Concentration of Sample after Adding 20 mM of Citrate Prior to the Measurement
| Storage condition | Non-treated | Sulfur-treated | SiO2-coated |
|---|
| Temperature | Period | Differential value of Al concentration (ppm) | Particles (count/mL) | Differential value of Al concentration (ppm) | Particles (count/mL) | Differential value of Al concentration (ppm) | Particles (count/mL) |
|---|
| 25°C | 2 d | 0.00 | 8 | 0.00 | 5 | 0.00 | 5 |
| 4 d | 0.06 | 5 | 0.00 | 5 | 0.00 | 5 |
| 40°C | 2 d | 0.02 | 5 | 0.00 | 8 | 0.00 | 5 |
| 4 d | 0.05 | 8 | 0.00 | 8 | 0.04 | 8 |
| 60°C | 2 d | 0.12 | 263 | 0.04 | 8 | 0.08 | 128 |
| 4 d | 0.19 | 273 | 0.10 | 145 | 0.15 | 243 |
| 80°C | 2 d | 0.39 | 558 | 0.25 | 263 | 0.40 | 799 |
| 4 d | 0.55 | 941 | 0.43 | 923 | 0.55 | 858 |
The differential value of concentrations in phosphate buffer solutions (50 mM, pH 7) from the surface of the glass 10 mL-sized 51-4 vials which have various kinds of surface treatments. Each filling volume was 5 mL.
In this section, both in the citrate buffer and in the phosphate buffer, the Al elution varied among the three treatments, but the difference was not remarkable when the vials were stored at an extremely high temperature and for a short storage term. It is considered that the Al and Si would be eluted from the whole glass tube when stored at a higher temperature, thus the effect of the surface treatment would be masked. This hypothesis is consistent with the previous result that showed a similar eluting rate among three kinds of vials (Fig. 2).
In the next section, we discuss the eluting propensity among the vials using lower temperatures and longer storage terms.
Comparison of Eluting Amount among Surface Treatments at Mild ConditionsFigure 5 shows the comparison of eluting amount among non-treated, sulfur-treated, and SiO2-coated vials during storage at 5°C or 25°C. The tested solution was phosphate buffer (16 mM) at a pH 7, and 100 mL of this solution was filled into three kinds of 100 mL-sized vials of type 51-4. As compared to prior sections, 100 mL-sized vials were used in this section of the study in order to investigate the eluting propensity using a lower ratio of vial surface area to filled solution. The 100 mL-sized vial with 45 mm internal diameter provided that the surface area ratio when filled with 100 mL of solution would be 0.011 mm2/mm3, while the surface area ratio when filled with 5 mL of solution into a 10 mL-sized vial with a 23 mm internal diameter would be 0.26 mm2/mm3.
In this experiment, no particles were observed from any stored samples. For the Al elution, non-treated vials eluted higher than other kinds of vials at any time point. On the other hand, for Si elution, SiO2-coated vials showed a higher elution at the time and temperature points of 24 months at 5°C, 3 months at 25°C, and 6 months at 25°C. The time and temperature point that made the most significant difference of eluting amount among these vials was that of 5°C for 3 months, showing a high elution of both Al and Si from only non-treated vials. This suggests that sulfur-treated vials and SiO2-coated vials have an ability to suppress the Al elution. For the SiO2-coated vials, it is reasonable to conclude that the coating layer can prevent the Al elution. The effect of sulfur-treatment on suppressing the Al elution is discussed further in the following section.
Meanwhile, Al eluting rate after the time point of three months was shown to be comparable among these vials after three months of storage. It is considered that the propensity of forming particles showed little difference among the three kinds of vials (Table 3) because the effects of suppressing Al elution by these surface treatments were not enough to make a remarkable difference in non-treated vials under the conditions in which Si is eluted at a higher rate.
The pH Dependency of Si and Al ElutionNext, we compared the Si and Al eluting amounts using 50 mM citrate buffer with various pHs. These results are shown in Fig. 6, and are the calculated Si and Al eluting amounts per unit surface area.
For any kind of vial, the eluting amount dependency on the pH showed that a higher pH caused a higher Si and Al elution. Considering the facts that Al does not precipitate in citrate buffer due to its chelating ability, and the highest pKa of citric acid is 6.4, which means citrate buffer has a buffering ability even around pH 7, citrate buffer with a pH 7 can be one of the appropriate solutions for evaluating the propensity of Si and Al elution. We also conducted the same study using phosphate buffers and measured the Si concentration, showing that the pH dependency of Si concentrations in phosphate buffers showed itself to be similar to that of in citrate buffers, and those concentrations were slightly lower than those in citrate buffers, as estimated (data not shown).
As the result of comparing the Al and Si eluting amounts between 100 mL-sized non-treated vials and 10 mL-sized non-treated vials using 51-4 vials, the 100 mL-sized vials showed a higher elution, particularly in short term storage (i.e., stored for 3 d), and as in the previous experiments. The results were consistent with the knowledge that a larger vial needs processing time during the forming process, thus more instances of rough surfaces inside a larger vial would be observed than in a smaller vial. However, the result that 51-1 vial (10 mL-sized vial) showed a far higher elution than other vials in this experiment suggests that the difference of vial size has less influence on the elution than the difference of vial supplier.
Comprehensive Comparison of Eluting Amounts among Different Vial Suppliers Using Citrate Buffer Solution at a Low TemperatureTo compare the elution from vials among different vial suppliers comprehensively, each vial was filled with 50 mM citrate buffer solution (pH 7), and was stored at 5°C for up to 6 months. In this study, borosilicate glass vials from both coefficient expansion 33×10−7 (vials 33-1) per degree and 51×10−7 (vials 51-1, 2, 3, 4 and 5) per degree were examined. As shown in Fig. 7, Si, Al and boron (B) showed various eluting rates in each vial. Hereafter, the discussion on each type of vial is described.
Further Investigation of Non-treated VialsFor Si and Al elution among non-treated vials, as in the study using phosphate buffer (Fig. 2), the 51-1 vial showed a higher elution of Al and Si than the 51-2 vial, and the difference of the initial eluting rate could be observed in samples stored for even 3 d. In addition, from the 33-1 vial, the eluting ratio of Al to Si was approximately 0.03 and this ratio is consistent with the fact that the Al generally contained in the glass of a 33-1 vial is approximately 0.03 times the Si present in the glass. On the other hand, for B elution, the B eluted remarkably within the beginning of the storage time period, and did not elute according to the ratio of the glass formulation. This phenomenon is reasonable because B (and sodium, Na) was absorbed abundantly into the surface of the glass vial during its forming process and these amounts of B and Na would affect the homogeneity of the surface. We observed the bottom part of the vials with a laser scanning microscope. However, we were not able to determine that the roughness on the glass surfaces showed any correlation to the eluting propensity (data not shown) due to lack of scanning resolution. Instead, measuring the Al, Si and/or B concentration can reveal the risk of delamination and precipitation directly.
Further Investigation of Sulfur-Treated VialsFigure 7 provides the comparison of Si, Al and B elution from citrate buffer between non-treated vials and sulfur-treated vials using vial types 51-3 and 51-4. In both vial types, the sulfur-treated vials showed a lower Al, Si and B elution. Especially, sulfur-treated vials showed a remarkable decrease of B elution, beginning from the time of contacting the buffer solution. For sulfur-treated 51-4 vials, the Al was eluted according to one tenth of the Si elution, roughly equivalent to a non-treated vial. On the other hand, for sulfur-treated 51-3 vials, the Al was eluted at lower than one tenth of the Si elution in the sample stored for up to 6 months. The results suggest that the sulfur treatment to the 51-3 vial might have washed out not only Na and B, but also Al from the inner surface of the vial.
To elucidate the phenomenon that the sulfur treatment could suppress the Si elution, we demonstrated the mock process of sulfur treatment using water and a dry heat sterilizer. As shown in Fig. 8, four kinds of vials which were non-treated 51-1 vials were prepared, and then were filled with 10 mL of citrate buffer (50 mM, pH 7) and stored at 40°C for periods of both 12 and 72 h. The amounts of Si, Al and B elution from these vials are shown in Fig. 9. Surprisingly, the vial which held water and was then heat treated showed a lower elution of Al and Si than other vials. We also measured the B and Na concentration in the water after “water treatment” and the average concentrations were 0.52 ppm for B and 0.45 ppm for Na, respectively. Considering the result that a 51-1 vial elutes approximately 3 ppm of B beginning from the time of its contacting the citrate solution (as shown in Fig. 7; but we should note that the filling volume of this experiment was 10 mL and the filling volume shown in Fig. 7 was 5 mL), all of the boron on the internal surface of the 51-1 vial was not washed out by the “water treatment.” Nevertheless, this showed that the surface washed by water for 2 h had obtained a durability against the neutral citrate buffer solution, but the effect also needed “heat treatment.” In other words, this suggests that the heat treatment, at the temperature even below glass transition temperature, can improve the homogeneity of an internal surface which had been deteriorated by adsorption of sodium and boron, and the washing process should be done in advance of the heat treatment. Therefore, the sulfur treatment can play a role in reducing the Si elution as long as the heat treatment is conducted after the washing process with ammonium sulfate. This is because ammonium sulfate is known to be one of the moderate washing agents for boron and sodium due to its dissolving ability. Furthermore, this suggests that the dry heat sterilization process of the empty vial prior to the filling process also has a possibility to enhance the glass durability. In order to much better improve the surface flatness, the most appropriate process parameters for both washing process and consecutive heat treatment should be determined by performing further parameter setting experiments.
Further Investigation of SiO2-Coated VialsAs well as sulfur-treated vials, Fig. 7 provides the comparison of Si, Al and B elution in citrate buffer between non-treated vials and SiO2-coated vials using 51-2, 51-4 and 51-5 vials. Regardless of the vial suppliers, SiO2-coated vials showed a higher Si elution, while the Al and B elution was far lower compared to non-treated vials. In particular, the 51-5 vial hardly showed any Al and B elution. The results demonstrate the suppressed Al and B elution due to SiO2 coating. However, increased Al and B elution was observed during the storage of the 51-2 and 51-4 vials with SiO2-coating, which explains the loss of the coating layer of those vials due to the elution of Si.
Figure 10 shows the Si and Al in solution with various buffer species and various pHs, using 51-4 vials with and without SiO2 coating. In non-treated vials, these profiles of the pH-dependency of Si and Al during the storage at 40°C for one month were shown to be comparable to our previous report that demonstrated the pH-dependency after treatment at 105°C for 240 min.13) In SiO2-coated vials, there were two findings other than in the non-treated vials. The first finding is that there is also Si elution dependent upon the pH in any buffer species, and the second finding is that the Si concentration of SiO2-coated vials at pH 4 was lower, while the Si concentration of SiO2-coated vials at pH 7 was higher than that of non-treated vials. For Al elution, SiO2-coated vials showed lower levels than non-treated vials at any experimental solution, except for citrate and phosphate buffer solutions (including acetate buffer solution, slightly) at pH 7. This phenomenon that these buffer solutions make Al elute from SiO2-coated vials as much as non-treated vials suggests that the SiO2 layer was compromised due to a high Si elution. The result that the Si elution at pH 4 in SiO2-coated vials was lower than in non-treated vials appears to be based on the fact that the Si solubility is fundamentally low at pH 4, and Si elution in non-treated vials would be forced by the dominant high Al solubility. These results strongly suggest that SiO2-coated vials would be effective against Al elution as long as the SiO2 layer can prevent against Si elution by the drug solution, and the SiO2 layer would be more effective against the solution at a lower pH.
Aside from 40°C storage, we conducted the eluting study at 25 and at 60°C, using not only 50 mM citrate buffer but also 10 mM citrate buffer. Figure 11 shows the comparison of the plots representing Si and Al concentrations, between non-treated vials and SiO2-coated vials in all of the storage conditions. When the plots representing not more than 0.02 ppm of an Al concentration in SiO2-coated vials are disregarded, each fitting line shows a similar slope, suggesting that the Al is eluted proportionally according to Si elution. Furthermore, two different intercepts were observed, indicating the existence of an SiO2 layer. Al would be eluted when approximately 1.8 ppm of Si was eluted from SiO2-coated vials (51-4 vial). For all of the plots in this figure, the filling volume was 5 mL. Because the 10 mL-sized vial in this study has 23 mm as an internal diameter, 1282 mm2 of the vial surface would be contacting the solution when 5 mL of the solution is filled into the vial. Provided that the density of silica is 2.2 g/cm3 (2.2×10⁻³ g/mm3), the thickness of the SiO2 layer which gives 1.8 ppm of Si in 5 mL solution can be estimated to be 3.19 nm. Using this calculation, we estimated the layer thickness of the 100 mL-sized vial with SiO2 coating from Fig. 5 as being 4.3 nm. This thickness of the 100 mL-size coated vial, having the similar level as the 10 mL-sized vial, is reasonable because the same vial manufacturer uses a similar coating method. Even if the nominal thickness is not disclosed by the manufacturer, citrate buffer can be used to estimate the thickness of the SiO2 coating and also estimate the tolerance of the effect of the SiO2 coating on suppressing the Al elution.
White et al. reported that an SiO2-coated type I glass vial is effective for conforming to EP specifications.2) For evaluation, they used water for injection and did not use any buffer solution. In the case of evaluating the effect of an SiO2 coating thoroughly, it is necessary to measure Al or other major elements contained in borosilicate glass (e.g. Na, B and/or Ca).