Abstract
In the pharmaceutical tablet film coating process, we clarified that a difference in exhaust air relative humidity can be used to detect differences in process parameters values, the relative humidity of exhaust air was different under different atmospheric air humidity conditions even though all setting values of the manufacturing process parameters were the same, and the water content of tablets was correlated with the exhaust air relative humidity. Based on this experimental data, the exhaust air relative humidity index (EHI), which is an empirical equation that includes as functional parameters the pan coater type, heated air flow rate, spray rate of coating suspension, saturated water vapor pressure at heated air temperature, and partial water vapor pressure at atmospheric air pressure, was developed. The predictive values of exhaust relative humidity using EHI were in good correlation with the experimental data (correlation coefficient of 0.966) in all datasets. EHI was verified using the date of seven different drug products of different manufacturing scales. The EHI model will support formulation researchers by enabling them to set film coating process parameters when the batch size or pan coater type changes, and without the time and expense of further extensive testing.
In general, pharmaceutical film coatings are applied in order to protect core tablets from light or for masking the taste of the active pharmaceutical ingredients. Therefore, the surface state of the coating layer is important to maintain the expected performance. During the coating process, however, the coating layer surface state is affected by the water content of the tablets. In a conventional approach, the water content of drug products is maintained at the validated level by monitoring the product’s temperature and/or the exhaust air temperature during the coating process. In a scale up study, the batch scale and manufacturing equipment are changed according to the progress of the process development stage. At each stage, the water content of drug products is constantly monitored and well-controlled to secure the consistency of the drug product’s quality. In this approach, numerous experiments are necessary to optimize the process parameters in each batch scale. As a result, the costs of materials, human resources, and time for development will become considerable.
Recently, continuous manufacturing systems, which are based on a no-scale up concept of the drug products, have been proposed and evaluated.1,2) Process analytical technology (PAT) using near infrared spectroscopy (NIR) or Raman spectroscopy has been widely evaluated for the in-line measurement of the water content of tablets, the coated film thickness and other related qualities.3–8) However, in the process controls using spectroscopic analysis, a large amount of experimental data and human resources are required for developing models. Additionally, a large amount of data are also required for the maintenance of the model after development. Moreover, when PAT is introduced into the film coating equipment, some investment is needed for renovation or the installation of a new film coater.
From the viewpoint of manufacturing conditions, the humidity in the film coating process should be controlled by adjusting the balance of the spraying rate of the film coating suspension, and the heated air flow drying rate. To control the water content of tablets, in addition to the operating parameters such as spray rate, drying air temperature or flow rate, the atmospheric air humidity, which fluctuates according to weather and season, should also be considered to be a constant that is one of the dominant operating parameters; it must be considered because the atmospheric air is introduced to the coating equipment as inlet heated air. These variations in the atmospheric air humidity can be controlled by adjusting the functions of humidification and dehumidification. However, some machines have only an air dehumidification function.
From the background described above, the numerical analysis of the film coating process has been reported.9–15) Consequently, a thermodynamic scale up method adopting a water and organic solvent film coating process was proposed16); it employs material balance, enthalpy balance and a heat loss factor in the approach. Although this theoretical model is a very useful method to express the situation of the film coating process, it requires the measurement of each coating machine’s heat loss, and therefore demands some additional engineering work.
In this study, we define a novel equation to predict the appropriate process parameters for the scale up or down of any coating process when the batch scale or equipment is changed. This new practical equation was developed using existing coating process data obtained from laboratory, pilot plant and commercial plant drug product scales. The drying ability proposed in this study is defined as, “Exhaust air relative Humidity Index (EHI).” The EHI is expressed as a non-dimensional index enabling the calculation of the drying abilities of coaters, independent of manufacturing scales and types of coaters. Based on the relationship between EHI and the experimental data regarding the exhaust air relative humidity (EARH), we developed an equation for predicting the water content of tablets. The predictive accuracy of this equation regarding the relative humidity was evaluated by comparing predicted values with experimental data. The aim of this study is to propose an equation which can be widely adopted for use in laboratory to commercial scale pharmaceutical manufacturing to determine the appropriate process parameters for any film coating process.
Experimental
MaterialsOpadry and Opadry II (Colorcon Japan LLC, Japan), consisting of hydroxypropyl methyl cellulose (HPMC), polyvinyl alcohol (PVA), polyethylene glycol (PEG-4000 or PEG-6000), talc and titanium oxide (TiO2), were used as film coating agents.
Coating MachinesA DRIACOATER DRC-650, DRC-900, DRC-1400 and DRC-1600 (Powrex Corporation, Japan), HICOATER multi and AQUA COATER AQC-17AF (Freund Corporation, Japan) were used. These are popular pan coaters classified as pan coating in the SUPAC-IR equipment classification.17) Scales of pan coaters in the study included a range of both laboratory scale and commercial scale pan coaters, as shown in Table 1.
Table 1. Information of Type and Size of Pan Coater Used
| Type | Volume (L) | Dimension H×W×L (mm) | Scale |
|---|
| HICOATER-Multi | 9 | 1730×1100×1200 | Lab. |
| DRC-650 | 15 | 1850×1100×1500 | Lab. |
| DRC-900 | 75 | 2300×1560×2000 | Pilot |
| DRC-1400 | 270 | 2800×1900×2750 | Pilot |
| DRC-1600 | 700 | 3450×2100×3500 | Commercial |
| AQC-17AF | 780 | 3185×2400×3420 | Commercial |
Tablets were loaded into a pan coater and were heated by inlet heated air. To begin, the pan coaters were rotated at a low speed to heat tablets homogeneously until the exhaust temperature reached a set target (pre-heating process). Subsequently, powder suspension for coating was sprayed continuously on the surface of the tablet bed using a spray nozzle. At the beginning of the spraying process, the pan coater rotation speed was set at a low rate in order to avoid the defacement of the uncoated tablet. In this stage, the spray rate was set at slow to avoid tablets from sticking to each other (Spray 1 process). In the next stage, the spray rate and pan coater rotation speed were both set at high (Spray 2 process). After spraying of the suspension, the tablets were subsequently dried by inlet heated air until the exhaust temperature reached a known target (drying process), and then tablets were cooled by the air flow (cooling process). The manufacturing data, including drying air temperature, drying air humidity, drying air flow rate, spray rate, exhaust air temperature, exhaust air humidity, rotation speed of the pan, atmospheric air temperature and atmospheric air humidity, were collected at every minute or every 10 min. The product list of pan coaters, manufacturing scales and compositions of coating suspensions used in each product are shown in Table 2. The results of experiments using these products were used for developing the EHI model. On the other hand, the results using the products shown in Table 3 were used as the validation data set for this model.
Table 2. The List of Production Data for EHI Parameter Fitting
| Product name | Type | Scale (kg) | Coating compositions | Concentration of coating solution | Intended purpose |
|---|
| Product A | DRC-650 | 10 | HPMC, Talc, TiO2 | 15 wt% | Calibration |
| DRC-900 | 50 | HPMC, Talc, TiO2 | 15 wt% | Calibration |
| DRC-1400 | 200 | HPMC, Talc, TiO2 | 15 wt% | Calibration |
| Product B | DRC-650 | 10 | HPMC, PEG-6000, Talc, TiO2 | 12 wt% | Calibration |
| AQC-17AF | 300 | HPMC, PEG-6000, Talc, TiO2 | 12 wt% | Calibration |
| AQC-17AF | 350 | HPMC, PEG-6000, Talc, TiO2 | 12 wt% | Calibration |
| Product C | DRC-900_1 | 50 | HPMC, Talc, TiO2 | 15 wt% | Calibration |
| DRC-900_2 | 50 | HPMC, Talc, TiO2 | 15 wt% | Calibration |
| Product D | DRC-900 | 50 | HPMC, PEG-6000, Talc, TiO2 | 15 wt% | Calibration |
| DRC-1400 | 200 | HPMC, PEG-6000, Talc, TiO2 | 15 wt% | Calibration |
| Product E | DRC-900 | 50 | HPMC, PEG-6000, Talc, TiO2 | 15 wt% | Calibration |
| Product F | DRC-900 | 50 | HPMC, PEG-6000, Talc, TiO2 | 15 wt% | Calibration |
| DRC-1400 | 200 | HPMC, PEG-6000, Talc, TiO2 | 15 wt% | Calibration |
| Product G | DRC-1600 | 500 | HPMC, Talc, TiO2 | 14 wt% | Calibration |
| Product H | DRC-1600 | 500 | HPMC, Talc, TiO2 | 14 wt% | Calibration |
| Product I | DRC-1400 | 200 | HPMC, PEG-6000, Talc, TiO2 | 15 wt% | Calibration |
| Product J | HC-multi | 5 | HPMC, Talc, TiO2 | 15 wt% | Calibration |
| Product K | AQC-17AF | 350 | HPMC, PEG-6000, Talc, TiO2 | 12 wt% | Validation |
| Product B | AQC-17AF | 350 | HPMC, PEG-6000, Talc, TiO2 | 12 wt% | Validation |
| Product J | DRC-1400 | 200 | HPMC, Talc, TiO2 | 15 wt% | Validation |
| Product F | DRC-900 | 50 | HPMC, PEG-6000, Talc, TiO2 | 15 wt% | Validation |
| Product L | DRC-900 | 50 | HPMC, Talc, TiO2 | 15 wt% | Validation |
| Product M | AQC-17AF | 500 | PVA, PEG-4000, Talc, TiO2 | 25 wt% | Validation |
| Product N | AQC-17AF | 500 | PVA, PEG-4000, Talc, TiO2 | 25 wt% | Validation |
Table 3. Manufacturing Conditions of Product A with DRC-650 (Influence of Process Parameters)
| Lot No. | Atmospheric air humidity (g/kg) | Inlet air flow rate (m3/min) | Inlet air temperature (deg.) | Spray rate (mL/min) | Max. LOD (wt%) |
|---|
| Spray 1 | Spray 2 |
|---|
| Lot 1 | 8.2 | 5.1 | 71.9 | 20 | 30 | 1.3 |
| Lot 2 | 8.3 | 5.1 | 69.9 | 35 | 45 | 1.6 |
| Lot 3 | 8.3 | 5.1 | 65.0 | 50 | 59 | 2.6 |
An HN-CPA (CHINO, Japan, accuracy: ±2%RH [0 to 90%RH at 25°C] and ±0.3°C [0 to 80°C]) was used for the measurement of exhaust air humidity. Exhaust air humidity data was collected automatically at appropriate intervals.
Loss on Drying (LOD) MeasurementFor the measurement of LOD, an HR73 (Halogen Moisture Analyzer, METTLER TOLEDO, Japan) equipped with a halogen light as a heat source was used. About 2 g of tablets were milled for measurement.
Results
Change of the Relative Humidity of Exhaust Air with Process ParametersThe time course of exhaust air temperature and relative humidity, and the various coating conditions of Product A using a DRC-650 with 10-kg scale are shown in Fig. 1 and Table 3, respectively. These results include the pre-heating process, low spray rate process (Spray 1), high spray rate process (Spray 2), drying process and cooling process. By the vaporization of water from the surface of the tablets, the relative humidity of exhaust air increased at the beginning of the pre-heating process. In the Spray 1 process, the relative humidity of exhaust air was decreased due to the fact that the coater drying ability was superior to the wetting ability of the spray. In the Spray 2 process, at first the relative humidity of exhaust air increased with the increase of the spray rate, but by adjusting the combination of heated air temperature, heated air flow rate and spray rate, the humidity curve showed a steady state. At the beginning of the drying process, the humidity decreased drastically, but the humidity increased again in the cooling process. The influence of heated air temperature and spray rate on the exhaust air humidity under the equivalent air flow rate is shown in Fig. 1. The lowest and highest values of the relative humidity of exhaust air were observed under the dried manufacturing conditions (Lot 3, high temperature and low spray rate) and the wetted manufacturing conditions (Lot 1, low temperature and high spray rate), respectively. From these results, we confirmed that the change in spray rate, drying air temperature, and air flow are reflected in the EARH.
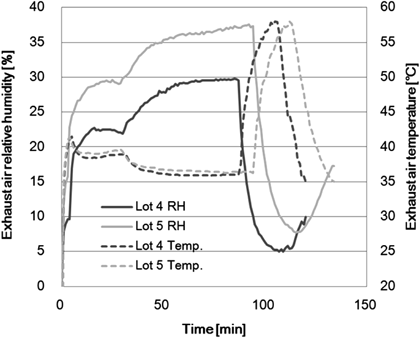
The Influence of Atmospheric Air Conditions on Tablet LODFigure 2 shows the results of EARH and the temperature behavior of two different lots in the film coating process under the same manufacturing process conditions, with the exception of the atmospheric air absolute humidity. The atmospheric air conditions were different due to the weather and the season, and because the air handling unit had no humidifier function. The manufacturing conditions of each lot and maximum value of LOD are shown in Table 4. The relative humidity of exhaust air exhibited a difference, even though all mechanically set values of the manufacturing process parameters were equivalent. On the other hand, the temperature of exhaust air showed an equivalent value between both lots. The maximum values of the water content of tablets in the film coating process were 1.9 wt% in Lot 4 and 2.5 wt% in Lot 5. Therefore, we found that the atmospheric air humidity does have a direct influence on the water content of the tablets.
Table 4. Manufacturing Conditions of Product A with DRC-650 (Influence of Atmospheric Air Humidity)
| Lot No. | Atmospheric air humidity (g/kg) | Inlet air flow rate (m3/min) | Inlet air temperature (deg.) | Spray rate (mL/min) | Max. LOD (wt%) |
|---|
| Spray 1 | Spray 2 |
|---|
| Lot 4 | 3.3 | 5 | 64 | 50 | 60 | 1.9 |
| Lot 5 | 7.8 | 5 | 64 | 50 | 60 | 2.5 |
Figure 3 shows the time course of the EARH within the same type of pan coater (DRC-900) placed in a different manufacturing room. The manufacturing conditions of each coater are shown in Table 5. They were the same with the exception of only the atmospheric air humidity. The atmospheric air humidities recorded for DRC-900-1 and DRC-900-2 were 9.8 and 8.7 g/kg, respectively. The relative humidity of the exhaust air over time was obviously different between the two lots, while the difference in atmospheric air humidity between the two was slightly different. These results suggest an influence of manufacturing location upon coating conditions, even if there is no change in the process parameters.
Table 5. Manufacturing Conditions of Product C with DRC-900-1 and DRC-900-2
| Type of coater | Atmospheric air humidity (g/kg) | Air volume rate (m3/min) | Air temperature (deg.) | Spray rate (mL/min) |
|---|
| Spray 1 | Spray 2 |
|---|
| DRC-900-1 | 9.8 | 10 | 73 | 80 | 100 |
| DRC-900-2 | 8.7 | 10 | 73 | 80 | 100 |
Figure 4 shows the relationship between the relative humidity of exhaust air in the coating process using two different formulations and the maximum values of water content of the tablets. These results indicated a good correlation between the two variables. All plots were on the same fitting line while the formulations of coating suspensions and products were different.
Discussion
Scale Up Model for Prediction of Exhaust Air Relative HumidityThe results of Figs. 1 to 4 indicate that controlling the tablet water content in the coating process is possible by controlling the relative humidity of the exhaust air. In the pharmaceutical process study during the development phase, the batch scale and coating equipment are changed. However, it is considered that tablet water content can be regulated by controlling the relative humidity of the exhaust air if an index of predicted process parameters is available for application to the coating process. In this study, this index was newly developed and named “EHI.” EHI is a practical equation utilizing fitting parameters determined from experimental data. EHI consists of the following variables: heated air flow rate, heated air temperature and spray rate. Generally, these are the main process parameters in order to control the moisture of the film coating process. It also incorporates the atmospheric temperature and humidity from our experimental results shown in Table 4. The heated air temperature is replaced by saturated water vapor pressure, and atmospheric temperature and humidity are replaced by partial water vapor pressure at atmospheric air temperature and humidity. As shown in Fig. 3, the relative humidity of exhaust air differed among the coating machines placed in separate rooms, though the type of machine and process parameters were the same. Based on these results, we considered that the terms of the machine properties should be included in the EHI. The EHI is a non-dimensional equation which consists of three terms; a machine property term, a drying speed term (combination of heated air flow rate and coating suspension spray rate), and a drying ability term (combination of heated air temperature and atmospheric air humidity). EHI is defined as the following equation:
 | (1) |
Where
Q is heated air flow rate (kg/min),
W is coating suspension spray rate (kg/min),
Pst1 is saturated water vapor pressure at heated air temperature (Pa),
Pwt2 is water partial vapor pressure at atmospheric air temperature and absolute humidity (Pa), and
k,
a and
b are fitting parameters which were determined by fitting them to all the experimental data shown in
Table 2.
The values of k, a and b shown in Table 6 were optimized in order to maximize the correlation coefficient value between the experimental data and the calculated value using the Microsoft Excel solver function. The calculated values of the relative humidity of the exhaust air are derived from the slope and intercept of the fitted curve depicting the relationship between the EHI and the experimental data of the EARH.
Table 6. EHI Fitting Parameter Values of
k,
a and
b| Type of pan coater | k | a | b | R | REave.* |
|---|
| DRC-650 | 1.000 | 0.465 | 0.169 | 0.931 | 14.8% |
| DRC-900-1 | 1.409 |
| DRC-900-2 | 1.106 |
| DRC-1400 | 1.167 |
| DRC-1600 | 1.422 |
| AQC-17AF | 1.193 |
| HC-multi | 1.138 |
* Relative error [%]=[(Calculation value of relative humidity with EHI)−(Experimental value of relative humidity)/(Experimental value of relative humidity)]×100.
Figure 5 shows the relationship between the actual results obtained from experiments and the calculated results of the EARH based on optimized fitting parameters. The correlation coefficient value was high at 0.931. Ideally, the relationship between the predicted value and experimental value should show a linear correlation. However, as shown in Fig. 5, the calculated result from Eq. 1 did not show a linear correlation with the experimental results, and the plots showed a wide distribution. Moreover, the calculated values were quite different from the experimental data found in both the high and low humidity conditions. Therefore, the results in Fig. 5 suggest that the predictions of EHI calculated using Eq. 1 and employing the fitting parameters shown in Table 6 were not accurate enough.
In order to evaluate the cause of the gaps between the calculated results and the experimental results as shown in Fig. 5, the limited results of two products, which include the data changing only in the 3rd parameter (parameter of the combination of heated air temperature and atmospheric air humidity), and the conditions of Eq. 1 were extracted and are shown in Fig. 6. The triangle plots show the results under different heated air temperature conditions. The results indicate that there is a strong influence of the heated air temperature or atmospheric air conditions on the predictive capability of the EHI. There is a low correlation relationship between the EARH calculated results and experimental results. From this, we judged that the EHI value calculated from Eq. 1 was not able to reflect the influence of temperature conditions on the EARH. However, under the standard atmospheric air conditions (temperature is 25°C and absolute air humidity is 10 g/kg), plots showed the same tendency among all data even though the results include the different inlet air temperature conditions (as shown in Fig. 7). Therefore, we modified the terms of the temperature effect as shown in Eq. 2 so that atmospheric air conditions are represented as a deviation from the standard atmospheric condition:
 | (2) |
Where
c is the standard atmospheric air condition, which is the control reference value of dew point. The value of
c was determined as 16.06 (Pa) here, and corresponded to the water vapor pressure under our standard dew-point control condition (25°C and absolute air humidity of 10 g/kg). Equation 2 is represented as follows:
 | (3) |
As shown in Table 7, the fitting parameter values for Eq. 3 were optimized. The calculated results of the EARH are shown in Fig. 8. The calculated results employing the optimized fitting parameters showed a good linear correlation with all the experimental data. In comparison to Fig. 5, the deviation between plots and the differences from the experimental data decreased. The correlation coefficient value became 0.966, which indicates that the predictive accuracy of EHI increased due to the addition of the term c into the equation.
Table 7. EHI Fitting Parameter Values of
k,
a,
b and
c| Type of pan coater | k | a | b | c | R | REave.* |
|---|
| DRC-650 | 1.000 | 0.349 | 0.293 | 16.062 | 0.966 | 10.7% |
| DRC-900-1 | 1.184 |
| DRC-900-2 | 0.968 |
| DRC-1400 | 1.063 |
| DRC-1600 | 1.170 |
| AQC-17AF | 1.037 |
| HC-multi | 1.017 |
* Relative error [%]=[(Calculation value of relative humidity with EHI)−(Experimental value of relative humidity)/(Experimental value of relative humidity)]×100.
The fitting parameters of EHI determined from the 17 experimental results for calibration shown in Table 2 were then validated using the seven different products also shown in Table 2. These experiments included four different manufacturing scales and three types of coating machines. Figure 9 shows the validation results of the EHI parameters. The validation data were plotted on the same line as the calibration data. Although the EHI was developed from the experimental data using an HPMC base coating solution, based on the validation results it is possible to adopt its use for a PVA base coating solution and maintain a similar predictive accuracy. From these results, it was judged that the fitting parameters of EHI were valid. Therefore, it is considered that EHI can be widely used as a parameter setting index for the pharmaceutical film coating process when the manufacturing scale, pan coater type or environmental manufacturing conditions are changed.
Conclusion
In this study, the relationship between film coating process parameters and EARH was clarified. In addition, it was confirmed that the EARH affected the water content of tablets. These results indicated that the water content of tablets can be regulated by controlling the EARH. From these results, we proposed the EHI for quantification of the pharmaceutical film coating process. The fitting parameters in the EHI equation were set using the experimental data of 10 drug products and 7 kinds of pan coaters. These fitting parameters of EHI were validated by evaluating the correlation coefficient determined by comparing the calculated values of EARH and the measured experimental values of EARH from various drug products, pan coater scales and coating parameters. The main advantage of the EHI method is that commercial scale coating conditions can be predicted using only one film coating experimental result from a lab-scale pan coater.
Conflict of Interest
The authors declare no conflict of interest.
References
- 1) Cunningham C., Hansell J., Nuneviller F. III, Rajabi-Siahboomi A. R., Drug Dev. Ind. Pharm., 36, 227–233 (2010).
- 2) Kumar R., Wassgren C., Chem. Eng. Sci., 117, 1–7 (2014).
- 3) Wirges M., Funke A., Serno P., Knop K., Kleinebudde P., J. Pharm. Biomed. Anal., 78–79, 57–64 (2013).
- 4) Möltgen C.-V., Puchert T., Menezes J. C., Lochmann D., Reich G., Talanta, 92, 26–37 (2012).
- 5) Markl D., Hannesschläger G., Sacher S., Leitner M., Khinast J. G., Eur. J. Pharm. Sci., 55, 58–67 (2014).
- 6) Gendre C., Genty M., Boiret M., Julien M., Meunier L., Lecoq O., Baron M., Chaminade P., Péan J. M., Eur. J. Pharm. Sci., 43, 244–250 (2011).
- 7) Andersson M., Josefson M., Langkilde F. W., Wahlund K.-G., J. Pharm. Biomed. Anal., 20, 27–37 (1999).
- 8) Kauffman J. F., Dellibovi M., Cunningham C. R., J. Pharm. Biomed. Anal., 43, 39–48 (2007).
- 9) Reiland T. L., Seitz J. A., Yeager J. L., Drug Dev. Ind. Pharm., 9, 945–958 (1983).
- 10) Stetsko G., Banker G. S., Peck G. E., Pharmaceutical Technology, 7, 50–62 (1983).
- 11) Ebey G. C., Pharmaceutical Technology, 11, 40–50 (1987).
- 12) Liu L. X., Litster J. D., Powder Technol., 74, 259–270 (1993).
- 13) am Ende M. T., Berchielli A., Chidlaw M. D., A Thermodynamic Model for Organic and Aqueous Tablet Film—Coating. AIChE National Meeting, Reno, NV, November 9, 2001.
- 14) Prpich A., am Ende M. T., Katzschner T., Lubczyk V., Weyhers H., Bernhard G., Comput. Chem. Eng., 34, 1092–1097 (2010).
- 15) Turton R., Cheng X.-X., Powder Technol., 150, 78–85 (2005).
- 16) M. T. am Ende, Berchielli A., Pharm. Dev. Technol., 1, 47–58 (2005).
- 17) FDA Administration, “Guidance for Industry, SUPAC-IR/MR: Immediate Release and Modified Release Solid Oral Dosage Forms Manufacturing Equipment Addendum,” January, 1999.