Abstract
Surface water samples were collected at 15 sampling sites in the southeastern Japan Sea along the Japanese Archipelago for analysis of polycyclic aromatic hydrocarbons (PAHs). Water samples were fractionated by filtration through a glass fiber membrane (pore size 0.5 µm) and analyzed by high-performance liquid chromatography with fluorescence detection. Thirteen PAHs having 3 to 6 rings were found in the dissolved phase (DP) and 12 were found in the particulate phase (PP). The total (DP+PP) PAH concentration ranged from 6.83 to 13.81 ng/L with the mean±standard deviation (S.D.) concentration of 9.36±1.92 ng/L. The mean±S.D. PAH concentration in the DP and PP was 5.99±1.80 and 3.38±0.65 ng/L, respectively. Three-ring PAHs predominated in the DP, while the proportion of 4-ring PAHs was higher in the PP. The mean total PAH concentration in the southeastern Japan Sea was higher than the concentration in the northwestern Japan Sea (8.5 ng/L). The Tsushima Current, which originates from the East China Sea with higher PAH concentration, is considered to be responsible for this higher concentration.
Polycyclic aromatic hydrocarbons (PAHs) having two or more aromatic rings are ubiquitous environmental pollutants. PAHs are mainly generated through incomplete combustion of organic matter, such as oil, coal and wood, and they are found in crude oil as derivatives of petrogenetic, biogenic and diagenetic sources.1) As the result of oil spills, PAHs end up in the atmosphere, soil, rivers, and eventually the oceans, producing large-scale marine pollution. Physical and biological characteristics of PAHs, such as volatility, solubility in water and half-life in the environment, are strongly dependent on the number of aromatic rings.2,3)
Some PAHs and oxidative derivatives of PAHs have adverse health effects. Several PAHs such as benzo[a]pyrene (B[a]P), for example, are carcinogenic and/or mutagenic. Oxidative derivatives of hydroxy and quinoid PAHs have endocrine-disrupting activity and/or produce reactive oxygen species.4–7) PAHs are known to have several adverse effects for aquatic organisms, such as causing deformities of the vertebral column and weakening of the immune system in fish.8) Bone deformities were reported in Pacific herring, pink salmon and sea bass as a result of exposure to PAHs.9,10) Toxicity to the embryo was considered a possible mechanism for the effects of PAHs.11) The WHO set guidelines for PAH levels in drinking water,12) and PAHs have been used as markers for estimating marine pollution.13,14)
Little is known about the behavior of PAHs in the Japan Sea. The Japan Sea is virtually a closed ocean system because all of the straits connecting it with other seas are narrow and shallow, having an average depth of 1350 m, compared to the maximum depth of the Japan Sea of more than 3700 m.15) In the Japan Sea, redistribution of PAHs is considered to reflect this circulation. The Tsushima Current (warm current) and the Liman Current (cold current) largely control water circulation in the Japan Sea. The Tsushima Current enters the Japan Sea through the Tsushima Straits while the Liman Current flows along the coast of Far Eastern Russia, and water flows out of the Japan Sea through the Tsugaru and Soya staits.16)
Recently, we investigated the surface and vertical distributions of PAHs in the northwestern Japan Sea (Russia side of the Japan Sea).17) In the present study, we determined the distribution of PAHs in the southeastern Japan Sea (Japan side of the Japan Sea). We also compared the pollution levels of PAHs in both the southeastern and northwestern Japan Sea.
Experimental
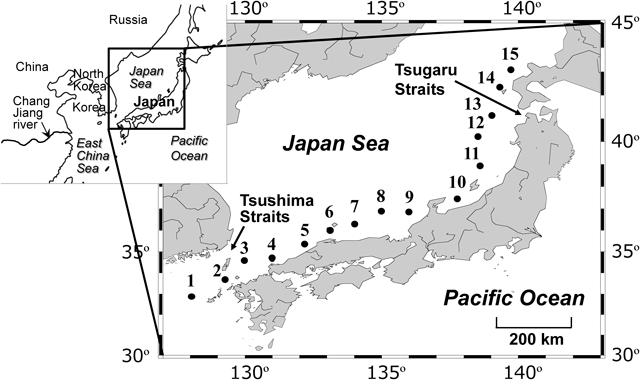
Sea Water SamplingSurface water samples were collected in August 2008 at 15 sampling sites with geographic range from 32°56′N, 128°6′E (site 1) to 43°5′N, 139°47′E (site 15) in the southeastern Japan Sea along the Japanese Archipelago (Fig. 1). Surface water (4 L) was collected from the deck of the Nagasaki-maru (Nagasaki University Research Vessel) using a bucket. Water samples were immediately kept in glass bottles which were rinsed with 50 mL of 5% methanol in water before use.
ChemicalsU.S. Environmental Protection Agency 610 PAH mix, a mixture of 16 PAHs was purchased from Supelco Park (Bellefonte, PA, U.S.A.). Three internal standards for PAHs (acenaphthylene-d10 (Ace-d10), pyrene-d10 (Pyr-d10) and B[a]P-d12 were purchased from Wako Pure Chemical Industries, Ltd. (Osaka, Japan). All other chemicals were of analytical reagent grade.
Sample ProcessingAn aliquot (3 L) of each surface water sample was filtered through a glass fiber membrane (pore size 0.5 µm, Advantec, Tokyo, Japan) into the glass bottle with methanol to collect the dissolved phase (DP)-PAHs. The particulate phase (PP)-PAHs were retained on the glass fiber membrane.
C18 cartridges (Waters Sep-Pak Plus C18 Cartridge (820 mg), Milford, MA, U.S.A.) were preconditioned with successive filtrations of 15 mL of dichloromethane–water (1 : 9, v/v), 15 mL of methanol–water (1 : 9, v/v) and 15 mL of methanol–water (1 : 9, v/v) at a flow rate of about 10 mL/min and dried overnight before use. The DP fraction (3 L) was spiked with 20 µL of internal standard solution including Ace-d10, Pyr-d10 and B[a]P-d12 and subjected to solid phase extraction using the pre-conditioned C18 cartridge at a flow rate of about 10 mL/min.
Both the C18 cartridge (containing DP-PAHs) and glass fiber membrane (containing PP-PAHs) were stored in a freezer at –20°C until analysis in our laboratory.
Extraction and Clean-UpThe DP-PAHs were eluted from the C18 cartridge with 15 mL of dichloromethane. After adding a drop of dimethyl sulfoxide (DMSO) to the eluate, the solution was evaporated. The residue was dissolved in 1 mL of n-hexane and applied to a silica-gel cartridge (Waters, Milford, MA, U.S.A.). After washing the cartridge with 5 mL of n-hexane, PAHs were eluted using 15 mL of the mixture of n-hexane–acetone (9 : 1, v/v). The eluate was evaporated, and the residue was dissolved in 800 µL of acetonitrile for HPLC assay.
PP-PAHs were extracted by passing 50 mL of dichloromethane through the glass fiber membrane twice. The solution was combined with 20 µL of the same internal standard solution as was added to the DP-fractions (2.3). The extraction of PAHs from the same membrane was repeated again using additional 50 mL of dichloromethane. All extracts were combined, a drop of DMSO was added, and then the mixture was evaporated. The residue was dissolved in 1 mL of n-hexane, and the solution was applied to a silica-gel cartridge in the same manner as described above for DP-PAHs. The eluate from the cartridge was evaporated, and the residue was dissolved in 800 µL of acetonitrile for HPLC assay.
HPLC AnalysisThe HPLC system (L series, Hitachi High Technologies, Tokyo, Japan) equipped with Inertsil ODS-P analytical (4.6 mm i.d.×250 mm, 5 µm, GL Sciences, Tokyo, Japan) and guard (4.0 mm i.d.×10 mm, 5 µm, GL Sciences) columns. Both columns were kept at 20°C in a column oven. The mobile phase (mixture of acetonitrile–water) was delivered in gradient mode with acetonitrile increasing from 55 to 100% over the course of 60 min. The flow rate of the mobile phase was kept at 1 mL/min. Both the excitation and emission wavelengths of the fluorescence detector were set at optimum wavelengths for each PAH with a time program.
Among PAHs in the above standard mixture, 13 PAHs were quantified: acenaphthylene (Ace), fluorene (Fle), anthracene (Ant), fluoranthene (Flu), Pyr, benz[a]anthracene (B[a]A), chrysene (Chr), benzo[b]fluoranthene (B[b]F), benzo[k]fluoranthene (B[k]F), B[a]P, dibenz[a,h]anthracene (DBA), benzo[ghi]perylene (BPe) and indeno[1,2,3-cd]pyrene (IDP). Data for Nap and Phe were not reported due to low recovery and imperfect resolution with interfering peaks, respectively. Additionally, data for three PAHs were not included in analysis for different reasons: acenaphthene was not fluorescent, the recovery of naphthalene was too low for quantification, and the phenanthrene peak showed interference with neighboring peaks.
CalculationsAnalytical results were corrected according to the recovery rates of surrogates. Surrogate recoveries were 54.7% of Ace-d10 (for Ace, Fle and Ant), 123.4% of Pyr-d10 (for Flu, Pyr, B[a]A and Chr) and 72.5 of B[a]P-d12 (for B[b]F, B[k]F, B[a]P, DBA, BPe and IDP) in DP samples and were 68.3% of Ace-d10, 101.3% of Pyr-d10 and 85.9% of B[a]P-d12 in PP samples. Instrument detection limits (IDL) and quantification limits (IQL) of each PAH were shown in Table S1. All 13 PAHs were quantified in the surface water samples collected at 15 sampling sites in the southeastern Japan Sea, except for IDP and DBA which had concentrations that were lower than the detection limit in several DP and PP samples. For the calculation of the mean concentration of PAHs, values lower than the quantification limits were assumed to be 0 for the calculation and were reported as “not detected” or “ND.”
Results and Discussion
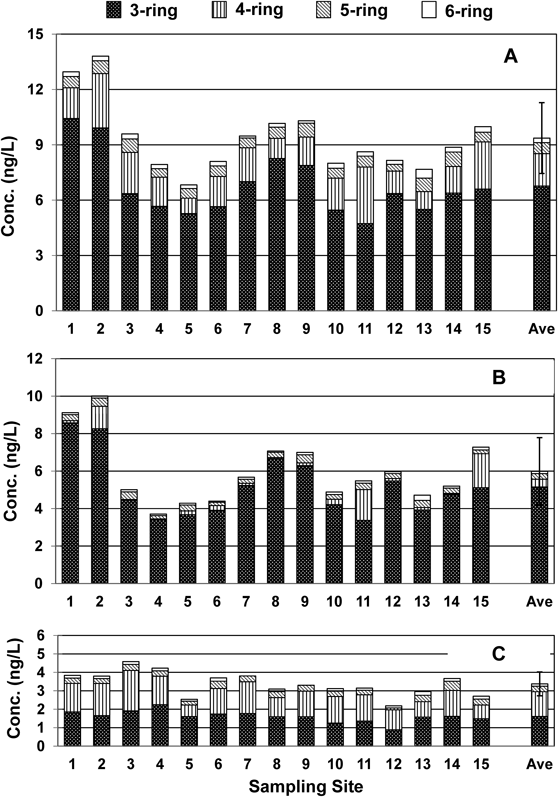
PAH Concentrations and Distribution in DP and PP FractionsPAH concentrations at the 15 sampling sites are listed in Table S2. From this table, DP-PAH, PP-PAH and total PAH (T-PAH) concentrations were calculated and are reported in Table 1. PAH concentrations were not constant in the southeastern Japan Sea (Fig. 2). The T-PAH concentrations ranged from 6.83 to 13.81 ng/L with a mean concentration of 9.36 ng/L. Site 2 (South Tsushima Strait) (13.81 ng/L) and site 1 (East China Sea) (12.95 ng/L) showed concentrations that were more than one standard deviation (1.92 ng/L) higher than the mean (Fig. 2A), although the correlations were not very strong (p>0.05) for T-PAH concentration vs. latitude (y=−0.2433x+18.463, R2=0.1463, p=0.1594) and T-PAH concentration vs. longitudes (y=−0.2255x+39.759, R2=0.2348, p=0.067) across the 15 sampling sites. The total PAH concentration in the DP fraction (DP-PAH) ranged from 3.71 ng/L (site 4) to 10.01 ng/L (site 2) with a mean concentration of 5.99 ng/L (Fig. 2B), and the total PAH concentration in the PP fraction (PP-PAH) ranged from 2.18 ng/L (site 12) to 4.58 ng/L (site 3) with a mean concentration of 3.38 ng/L (Fig. 2C). Of the T-PAH concentration, the DP-PAH concentration accounted for 63.9%, suggesting that differences in the T-PAH concentrations (Fig. 2A) are mainly caused by differences in the DP-PAH concentrations.
Table 1. Concentrations of PAHs in the Southeastern Japan Sea
| PAH | DP | PP | Total (DP+PP) |
|---|
| Max. | Min. | Mean | S.D. | Max. | Min. | Mean | S.D. | Max. | Min. | Mean | S.D. |
|---|
| Ace | 3.9 | 1.5 | 2.3 | 0.76 | 0.44 | 0.22 | 0.32 | 0.066 | 4.2 | 1.8 | 2.6 | 0.77 |
| Fle | 4.5 | 1.7 | 2.7 | 0.91 | 1.8 | 0.54 | 1.2 | 0.26 | 5.9 | 2.7 | 3.9 | 0.93 |
| Ant | 0.21 | 0.043 | 0.12 | 0.048 | 0.26 | 0.072 | 0.14 | 0.056 | 0.46 | 0.14 | 0.25 | 0.092 |
| Flu | 1.7 | 0.047 | 0.47 | 0.64 | 1.1 | 0.050 | 0.50 | 0.32 | 2.1 | 0.050 | 0.81 | 0.63 |
| Pyr | 0.020 | 0.0067 | 0.015 | 0.00 | 0.89 | 0.43 | 0.69 | 0.12 | 0.90 | 0.45 | 0.70 | 0.12 |
| B[a]A | 0.15 | 0.012 | 0.043 | 0.045 | 0.057 | 0.016 | 0.041 | 0.013 | 0.15 | 0.035 | 0.078 | 0.039 |
| Chr | 0.038 | 0.0058 | 0.021 | 0.0094 | 0.21 | 0.079 | 0.14 | 0.035 | 0.24 | 0.10 | 0.16 | 0.039 |
| B[b]F | 0.10 | 0.047 | 0.064 | 0.014 | 0.18 | 0.11 | 0.15 | 0.022 | 0.25 | 0.063 | 0.20 | 0.049 |
| B[k]F | 0.059 | 0.036 | 0.047 | 0.0066 | 0.090 | 0.062 | 0.077 | 0.0078 | 0.14 | 0.10 | 0.12 | 0.0090 |
| B[a]P | 0.30 | 0.035 | 0.12 | 0.078 | 0.15 | 0.031 | 0.076 | 0.037 | 0.37 | 0.078 | 0.20 | 0.081 |
| DBA | 0.13 | 0.046 | 0.082 | 0.028 | 0.11 | 0.11 | 0.11 | 0.00 | 0.23 | 0.046 | 0.090 | 0.048 |
| BPe | 0.28 | 0.036 | 0.11 | 0.057 | 0.20 | 0.10 | 0.14 | 0.026 | 0.48 | 0.084 | 0.23 | 0.092 |
| IDP | 0.035 | 0.027 | 0.031 | 0.00 | N.D. | N.D. | N.D. | N.D. | 0.035 | 0.027 | 0.031 | 0.00 |
| ΣPAHs | 10 | 3.7 | 6.0 | 1.8 | 4.6 | 2.2 | 3.4 | 0.65 | 14 | 6.8 | 9.4 | 1.9 |
Unit: ng/L. DP, dissolved phase. PP, particulate phase. N.D., not detection.
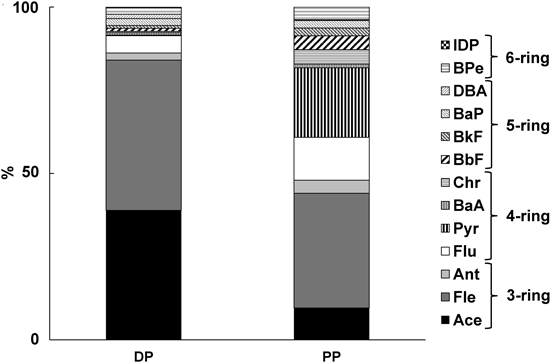
In the T-PAH, the most abundant PAH was Fle, followed by Ace (ST-1). However, the PAH composition differed between the DP and PP fractions (Fig. 3). In the DP fraction, the most abundant PAH was Fle followed by Ace. Classified by number of rings, 3-ring PAHs (Ace, Fle and Ant) accounted for 86.2% of the PAHs in the DP fraction and 4-ring PAHs (Flu, Pyr, B[a]A and Chr) accounted for only 6.5%. In the PP fraction, the most abundant PAH was Fle, followed by Pyr, which is different from the pattern found in the DP fraction. In the PP fraction, the proportion of 4-ring PAHs (39.2%) was significantly larger, while the proportion of 3-ring PAHs (48.0%) was the largest, and the proportion of 5-ring PAHs (9.0%) and 6-ring PAHs (3.8%) also was larger.
The differences in PAH composition between the DP and PP fractions is probably a result of the differences in vapor pressures of PAHs. Vapor pressure of PAHs is dependent on ring number. The vapor pressure of Ace, a 3-ring PAH is 3.86 Pa, while the vapor pressure of 4- to 6-ring PAHs are in the range of 1.08×10⁻³ Pa (Flu) to 2.80×10⁻⁹ Pa (DBA).18,19) Accordingly, the water solubility of PAHs decreases with increasing ring number.20)
The transferring mechanisms of PAHs between the water bodies and the atmosphere depend on the different phases, gas and particulate. Based on water solubility, 3-ring PAHs exist in the gas phase in the atmosphere, 4-ring PAHs exist in both gas and particulate phases and PAHs having 5 rings or more exist only in the particulate phase in the atmosphere.21) This difference suggested that gas phase PAHs dissolve in the surface sea water to be the DP-PAHs and particulate phase PAHs fall into the surface sea water to be the PP-PAHs. These two pathways can explain the different PAH composition between the DP and PP fractions shown in Fig. 3.
PAH SourcesThe major atmospheric PAH sources were identified as automobile exhaust in Japan and Korea and emissions from burning coal in China and Far Eastern Russia.22–25) In the marine environment, other major sources of PAHs include oil spills from tankers and ballast water from ships. The sinking of the Russian Tanker “Nakhodka” in 1997 resulted in a spill of more than 7000 kL of heavy oil, which contained many kinds of PAHs, increasing the concentrations of PAHs in the southeastern Japan Sea. It took more than 2 years for the PAH levels to return to baseline levels.26)
Several PAH pairs have been identified for use as markers to identify the source of PAHs in natural water systems.27) For example, the ratio of (Flu)/(Flu+Pyr)<0.4 implies petroleum leakage, while 0.4 to 0.5 implies petrogenic combustion and >0.5 implies grass, wood or coal combustion. Similarly, the ratio of (B[a]A)/(B[a]A+Chr)<0.2 implies petroleum leakage, while 0.2 to 0.35 implies petrogenic combustion and >0.35 implies grass, wood or coal combustion.
Figure 4 shows the ratios of (B[a]A)/(B[a]A+Chr) vs. (Flu)/(Flu+Pyr) calculated from Table S1 for the DP and PP fractions at the 15 sampling sites. In the DP fraction, the (Flu)/(Flu+Pyr) and (B[a]A)/(B[a]A+Chr) ratios were in the range from 0.77 to 1.00 and 0.35 to 0.96, respectively, suggesting grass, wood or coal combustion was a major contributor to the DP-PAHs. For the PP fraction, the (Flu)/(Flu+Pyr) ratios were in the wide range <0.6 and the (B[a]A)/(B[a]A+Chr) ratios were in the range <0.35, suggesting not only pyrogenic origins but also petroleum origins such as oil form ships. Considering that the PP-PAH concentrations were lower than the DP-PAH concentrations (Fig. 5), the contribution from petroleum is considered to be smaller than that of the emissions from combustion. In our previous report,17) both DP- and PP-PAHs in the northwestern Japan Sea showed ratios of (Flu)/(Flu+Pyr) in the range of 0.2 to 0.4, while the ratio of (B[a]A)/(B[a]A+Chr) was 0.4 to 0.9 and 0.2 to 0.6 for the DP- and PP-PAHs, respectively. These values suggest mixed sources of inputs from both pyrogenic and petroleum origins, and PAHs were considered to be of similar origins in both the southeastern and northwestern Japan Sea. The atmospheric PAH concentration in China increased significantly in winter as a result of coal burning for heating.28) However, the atmospheric PAH concentration in the southeastern Japan Sea was several times lower in summer than those in winter because that the source of the PAHs in this region was not in China but mainly domestic.24,25) Considering the fact that the sea water samples were collected in August (non-coal heating season) in this experiment, the burning of coal in winter in China would have little effect on the present results.
PAH Distribution in the Southeastern and Northwestern Japan SeaWe collected seawater samples in the northwestern Japan Sea (41°30′–45°N, 131°80′–137°30′E) in late summer 2010. The total (DP+PP) PAH concentrations ranged from 7.4 to 10.2 ng/L with a mean of 7.9 ng/L.17) The mean T-PAH concentration in the southeastern region (9.36 ng/L) in the present report was slightly higher than that of the northwestern region. The PAH concentrations and the distribution between the DP and PP fractions were compared between southeastern and northwestern Japan Sea (Fig. 5). The DP-PAH concentration of the southeastern region (6.0 ng/L) was 1.07 times higher than that of the northwestern region (5.6 ng/L). The PP-PAH concentration of the southeastern region (3.4 ng/L) was 1.3 times higher than that of the northwestern region (2.7 ng/L). The proportion of 4-ring PAHs (6.5%) in the DP fraction was significantly smaller in the southeastern region than that in the northwestern region (36.4%, p<0.01). The proportion of 3-ring PAHs (86.2%) in the DP fraction was higher in the southeastern region than that in the northwestern region (60.4%, p<0.01). However, the PAH composition of the PP fraction was similar between the two regions of the Japan Sea.
As a possible reason for the different DP-PAH concentrations between the two regions of the Japan Sea, the effect of currents may be considered. The Liman current (cold current) flows along the northwestern Japan Sea, and the Tsushima current (warm current) flows into the southwestern region of the Japan Sea through the Tsushima Straits. Several large rivers, such as the Chang Jiang (Yangtze) River, flow into the East China Sea from highly populated areas of China where industry, power plants, domestic heating and cooking use fossil fuels and burning of biomass in agriculture are sources of PAHs. The concentration of the T-PAHs in the Chang Jiang River (185.3 ng/L) was about 20 times higher than the concentration in the southeastern Japan Sea. Moreover, in the DP fraction, 3-ring PAHs were the most abundant PAHs. This result corresponds to the PAH compositions of not only sites 1 and 2, but also the average values of the southeastern Japan Sea (Fig. 4). The Chang Jiang River flows into the East China Sea at the rate of 1×10¹² ton/year and accounts for about two-thirds of the effluent that flows into the Tsushima Straits area. The higher T-PAH concentration at sites 1 and 2 in Fig. 2 supports the supposition that the East China Sea may be contaminated with PAHs. On the other hand, the Liman Current originates from Russian rivers, such as the Amur River, which flow through much less populated areas than does the Chang Jiang River. Moreover, the flow volume of the Amur River (3.3×10⁸ ton/year) is much less than that of the Chang Jiang River. Thus, the Tsushima Current polluted with PAHs might increase the concentration of T-PAHs in the southeastern Japan Sea. This transport process of PAHs might explain the observation that the mean concentration of the T-PAHs was lower in the southeastern Japan Sea than in the East China Sea (70.22–120.2 ng/L) and the Western Taiwan Strait, which also connects to the East China Sea (23.3–70.9 ng/L).29)
The change in concentration of T-PAHs was not gradual among the 15 sampling sites (Fig. 2). Both currents and inputs of river water are considered to account for the slight increases observed around central (sites 8 and 9) and northern (site 15) regions of the Japan Sea. The Tsushima Current is divided into the Korean side stream and Japanese side stream by the Tsushima Islands and merges again in the central region. This may cause an increase the PAH concentration around sites 8 and 9. It has been reported that the concentrations of several persistent organic pollutants, such as hexachlorocyclohexane, became greater in the North Pacific Ocean with increasing latitude.30) The concentration of PAHs may also occur by a similar mechanism in the northern region of the Japan Sea (site 15), although more detailed experiments are necessary.
Comparison of PAHs in the Japan Sea and Other SeasWe collected sea water samples by a single cruise in August but not in the other seasons and after then. Although the present result may not be the annual average concentration levels of PAHs accurately, we compared the concentrations of PAHs in the Japan Sea to the pollution levels in other seas reported. The total concentration of 10 PAHs (Ace, Phe, Ant, Flu, Pyr, B[b]F, B[k]F, B[a]P, BPe and coronene) in the open Atlantic Ocean was in the range of 0.06 to 1 ng/L.14) The total concentration of 8 PAHs (Flu, Pyr, B[a]A, Chr, B[b]F, B[k]F, DBA and BPe) in the western Mediterranean Sea was 1.07 ng/L (Dachs et al.).13) In contrast, the total concentration of 5 PAHs (Ace Fle, Flu, Pyr and B[a]A) in the Gulf of Venice in the Adriatic Sea (9.62 ng/L)31) was at the same level as that in the Japan Sea. Several recently published reports concerning PAH distribution in seawater in Asia show that the concentrations of 16 PAHs in the PP and DP fractions of the surface seawater along the coast of Xiamen Island, China were in the range of 28.2 to 128.7 ng/L (mean, 59.2 ng/L) and 62.0 to 341.9 ng/L (mean, 182.4 ng/L), respectively.32) The concentrations of 7 PAHs in seawater along the Klang Strait, Malaysia were in the range of 67.0 to 693.7 ng/L.33) These results suggest that the Japan Sea and surrounding seas seemed to be more polluted with PAHs than did the Atlantic Sea and Mediterranean Sea.
East Asian countries are developing quickly with increasing energy consumption. Pollution loading from countries surrounding the Japan Sea such as China has increased significantly, and PAH contamination in seas adjoining to the Japan Sea has been reported.34–36) In order to predict future trends in PAH concentrations and to take effective countermeasures against contamination in East Asian seas, continuous observations are needed.
Conclusion
This is the first report of PAH distribution in the southeastern Japan Sea. Surface water samples were collected at 15 sampling sites and 13 PAHs having 3 to 6 rings were quantified by HPLC with fluorescence detection.
(1) The mean concentration of T-PAHs among all 15 sampling sites was 9.36 ng/L. The mean concentration of the DP- and PP-PAHs was 5.99 and 3.38 ng/L, respectively. Three-ring PAHs predominated in the DP and the proportion of 4-ring PAHs was greater in the PP. Gas and particulate phase PAHs in the atmosphere were considered to contribute to the seawater DP- and PP-PAH concentrations, respectively.
(2) Examination of the PAH composition suggested that the major contributors to the DP-PAHs were of pyrogenic origin and that the major contributors to the PP-PAHs were mixed type of pyrogenic and petrogenic origins such as blast water.
(3) The southeastern Japan Sea was more heavily polluted with PAHs than the northwestern region. This difference might be attributable to the Tsushima Current being more polluted with PAHs.
(4) The Japan Sea during this survey (August 2008) was more polluted with PAHs than the Atlantic Ocean and Mediterranean Sea.
Acknowledgment
This research was supported in part by Grants-in-Aid for Scientific Research (Nos. 21256001 and 21390034) from the Ministry of Education, Culture, Sports, Science and Technology of Japan, and the Environmental Research and Technology Development Funds (Nos. B-0905 and 5-1306) from the Ministry of the Environment of Japan.
Conflict of Interest
The authors declare no conflict of interest.
Supplementary Materials
The online version of this article contains supplementary materials.
References
- 1) Neff J. M., “Polycyclic Aromatic Hydrocarbons in the Ocean,” ed. by Neff J. M., Elsevier Science, 2002, pp. 241–318.
- 2) Haritash K., Kaushik P., J. Hazard. Mater., 169, 1–15 (2009).
- 3) Shuttleworth K. L., Cerniglia C. E., Appl. Biochem. Biotechnol., 54, 291–302 (1995).
- 4) Kumagai Y., Koide S., Taguchi K., Endo A., Nakai Y., Yoshikawa T., Shimojo N., Chem. Res. Toxicol., 15, 483–489 (2002).
- 5) Hayakawa K., Onoda Y., Tachikawa C., Hosoi S., Yoshita M., Chung S. W., Kizu R., Toriba A., Kameda T., Tang N., J. Health Sci., 53, 562–570 (2007).
- 6) Motoyama Y., Bekki K., Chung S. W., Tang N., Kameda T., Toriba A., Taguchi K., Hayakawa K., J. Health Sci., 55, 845–850 (2009).
- 7) Hayakawa K., Bekki K., Yoshita M., Tachikawa C., Kameda T., Tang N., Toriba A., Hosoi S., J. Health Sci., 57, 274–280 (2011).
- 8) Reynaud S., Deschaux P., Aquat. Toxicol., 77, 229–238 (2006).
- 9) Barron M. G., Carls M. G., Heintz R., Rice S. D., Toxicol. Sci., 78, 60–67 (2004).
- 10) Danion M., Deschamps M. H., Thomas-Guyon H., Bado-Nilles A., Le Floch S., Quentel C., Sire J. Y., Ecotoxicol. Environ. Saf., 74, 1888–1895 (2011).
- 11) Incardona J. P., Carls M. G., Teraoka H., Sloan C. A., Collier T. K., Scholz N. L., Environ. Health Perspect., 113, 1755–1762 (2005).
- 12) WHO/Guidelines for Drinking Water Quality, “Polynuclear Aromatic Hydrocarbons,” 2nd ed., Vol. 2, 1996, pp. 495–506.
- 13) Dachs J., Bayona J., Raoux C., Albaigés J., Environ. Sci. Technol., 31, 682–688 (1997).
- 14) Nizzetto L., Lohmann R., Gioia R., Jahnke A., Temme C., Dachs J., Herckes P., DiGuardo A., Jones K. C., Environ. Sci. Technol., 42, 1580–1585 (2008).
- 15) Mori K., Matsuno T., Senjyu T., J. Oceanogr., 61, 761–773 (2005).
- 16) Senjyu T., J. Oceanogr., 55, 111–122 (1999).
- 17) Chizhova T., Hayakawa K., Tishchenko P., Nakase H., Koudryashova Y., Deep Sea Res. Part II Top. Stud. Oceanogr., 86–87, 19–24 (2013).
- 18) Kim K. H., Jahan S. A., Kabir E., Brown A., Environ. Int., 60, 71–80 (2013).
- 19) Fu J., Suuberg E. M., J. Chem. Thermodyn., 43, 1660–1665 (2011).
- 20) Feng J., Yang Z., Niu J., Shen Z., Environ. Pollut., 147, 193–200 (2009).
- 21) Araki Y., Tang N., Ohno M., Kameda T., Toriba A., Hayakawa K., J. Health Sci., 55, 77–85 (2009).
- 22) Tang N., Tabata M., Mishukov V. F., Sergienko V., Toriba A., Kizu R., Hayakawa K., J. Health Sci., 48, 30–36 (2002).
- 23) Tang N., Hattori T., Taga R., Igarashi K., Yang X., Tamura K., Kakimoto H., Mishukov V., Toriba A., Kizu R., Hayakawa K., Atmos. Environ., 39, 5817–5826 (2005).
- 24) Inomata Y., Kajino M., Sato K., Ohara T., Kurokawa J., Ueda H., Tang N., Hayakawa K., Ohizumi T., Akimoto H., Environ. Sci. Technol., 46, 4941–4949 (2012).
- 25) Inomata Y., Kajino M., Sato K., Ohara T., Kurokawa J., Ueda H., Tang N., Hayakawa K., Ohizumi T., Akimoto H., Environ. Pollut., 182, 324–334 (2013).
- 26) Hayakawa K., Nomura M., Nakagawa T., Oguri S., Kawanishi T., Toriba A., Kizu R., Sakaguchi T., Tamiya E., Water Res., 40, 981–989 (2006).
- 27) Yunker M. B., Macdonald R. W., Vingarzan R., Mitchell R. H., Goyette D., Sylvestre S., Org. Geochem., 33, 489–515 (2002).
- 28) Yang X.-Y., Okada Y., Tang N., Matsunaga S., Tamura K., Lin J.-M., Kameda T., Toriba A., Hayakawa K., Atmos. Environ., 41, 2710–2718 (2007).
- 29) Wu Y. L., Wang X. H., Li Y. Y., Hong H. S., Mar. Pollut. Bull., 63, 459–463 (2011).
- 30) Kunugi M., Abe S., Tsurukawa M., Matsumura C., Fujimori K., Nakano T., Bunseki Kagaku, 59, 967–984 (2010).
- 31) Manoli E., Samara C., Trends Analyt. Chem., 18, 417–428 (1999).
- 32) Ya M. L., Wang X. H., Wu Y. L., Ye C. X., Li Y. Y., Mar. Pollut. Bull., 78, 110–117 (2014).
- 33) Tavakoly Sany S. B., Hashim R., Rezayi M., Salleh A., Rahman M. A., Safari O., Sasekumaru A., Mar. Pollut. Bull., 84, 268–279 (2014).
- 34) Chen Y., Zhu L., Zhou R., J. Hazard. Mater., 141, 148–155 (2007).
- 35) Men B., He M., Tan L., Lin C., Quan X., Mar. Pollut. Bull., 58, 818–826 (2009).
- 36) Ren H., Kawagoe T., Jia H., Endo H., Kitazawa A., Goto S., Hayashi T., Estuar. Coast. Shelf Sci., 86, 395–400 (2010).