Abstract
Two creams containing 20% (w/w) urea and various emulsifiers, a nonionic surfactant (NS) and lecithin (LEC), were prepared, and the rate of crystallization following application of the cream and differences in the properties of the deposits were investigated. Post-application crystallization was slower with the LEC formulation. Differences in the crystals obtained from the two formulations and from a 20% aqueous solution of urea were evaluated by powder X-ray diffraction (PXRD), differential scanning calorimetry (DSC), powder X-ray–DSC (PXRD–DSC) and Fourier transform infrared spectrophotometry (FT-IR). PXRD and PXRD–DSC measurements showed that the diffraction patterns of both formulations differed from that of urea. The NS formulation provided diffraction peaks for urea and a urea composite, whereas only the urea composite was evident in the LEC formulation. DSC scans of urea showed an endotherm at around 134°C, whereas the deposits from both formulations provided an endotherm 23–25°C below that of urea; the NS formulation also showed a peak at around 140°C. These results indicate a tendency for urea crystallization in the NS formulation. FT-IR measurements showed that both deposits have a urea-based structure. The effects of the LEC formulation components on the physical properties of urea were investigated by PXRD and showed that all diffraction peaks were evenly weakened, suggesting that urea tends to be amorphous and that the formulation impacts post-application urea crystallization. Consequently, the amorphous state of urea can be maintained post-application by optimizing the formulation, thereby increasing the clinical efficacy of the cream.
Urea helps retain moisture in the stratum corneum and is widely used in external preparations to treat dry skin disorders such as keratosis and senile xerosis. The softening effect on the stratum corneum generally increases with the urea content of the cream.1,2) Urea is more readily transferred to the stratum corneum in the dissolved (amorphous) state3) and exhibits higher clinical efficacy when compared to crystalline urea; consequently, preparations are formulated to suppress crystallization4) and thus maintain easy absorption.5) External preparations that crystallize post-application exhibit drastically decreased transfer of urea to the skin6) and may feel taut or gritty, and irritate the skin.4) Winter conditions (low temperature and humidity) tend to aggravate skin conditions and thus preparations must be compatible with low humidity conditions. It is difficult to add sufficient water to maintain the solubility of the urea in preparations containing ≥20% urea, yet external preparations must be formulated to ensure that urea does not crystallize post-application.
Urea forms inclusion compounds through intermolecular interactions with other molecules and atoms,7) and the size and molecular structure of the guest compound greatly affects the formation of urea composites.8–10) Paraffins with six or more hydrocarbons11–16) and their derivatives (for example, alcohols and carboxylic acids) such as stearic acid,17) palmitic acid18) and cetyl alcohol,19) as well as fatty acid-based surfactants, are commonly used guest molecules in numerous urea external preparations.20–22) Therefore, urea inclusion compounds are likely formed when urea crystallizes from an external preparation,4) suggesting that crystallization is affected by the formulation.
Here, we compared the post-application deposition states of two 20% (w/w) urea preparations containing different emulsifiers (LEC formulation: lecithin formulation; NS formulation: nonionic surfactant formulation).
In the LEC formulation, the emulsifier consisted primarily of the natural emulsifier lecithin, together with glycerin fatty acid esters as a nonionic surfactant. The main component of the lecithin was phosphatidylcholine, a phospholipid containing two fatty acids. In the NS formulation, the emulsifier consisted primarily of the nonionic surfactant polyoxyethylene (50) hydrogenated castor oil (HCO 50), together with other sorbitan fatty acid esters.
The deposits were evaluated by powder X-ray diffraction (PXRD), differential scanning calorimetry (DSC), powder X-ray–DSC (PXRD–DSC) and Fourier transform infrared spectrophotometry (FT-IR). The post-application deposition state and the rate of crystallization were found to depend on the formulation, thus providing insights into the effect of cream components on suppressing post-application crystallization.
Experimental
Samples-
·Model formulations (O/W (Oil in Water) type cream): ① NS formulation, ② LEC formulation
-
·Twenty percent urea aqueous solution
The compositions of the NS and LEC formulations are shown in Table 1.
Table 1. Model Formulations
| Component | Suppliers | Amount |
|---|
| NS formulation | LEC formulation |
|---|
| Urea | Junsei Chemical Co., Ltd., Tokyo, Japan | 20.0 | 20.0 |
| Oily substances | Various sources | 15.0 | 15.0 |
| Cetostearyl alcohol (CSA) | Kokyu Alcohol Kogyo Co., Ltd., Chiba, Japan | 4.0 | 4.0 |
| Polyoxyethylene (50) hydrogenated castor oil (HCO 50) | Nikko Chemicals Co., Ltd., Tokyo, Japan | 1.0 | 0.0 |
| Polyoxyethylene sorbitan monostearate | Nikko Chemicals Co., Ltd., Tokyo, Japan | 1.0 | 0.0 |
| Sorbitan monostearate | Nikko Chemicals Co., Ltd., Tokyo, Japan | 0.4 | 0.0 |
| Purified soybean lecithin (Lecithin) | Tsuji Oilmills Co., Ltd., Mie, Japan | 0.0 | 0.8 |
| Propylene glycol monostearate | Nihon Emulusion Co., Ltd., Tokyo, Japan | 0.0 | 0.8 |
| Glyceryl monostearate | Nikko Chemicals Co., Ltd., Tokyo, Japan | 0.0 | 0.8 |
| Glycerin | NOF Corporation, Tokyo, Japan | 10.0 | 10.0 |
| Purified water | Yoshida Pharmaceutical Co., Ltd., Tokyo, Japan | 48.6 | 48.6 |
| Total | | 100.0 | 100.0 |
Formulations were prepared as shown in Fig. 1. The aqueous phase consisted of urea, which is the active pharmaceutical ingredient, glycerin and purified water, and the oil phase consisted of non-polar and polar oil, emulsifier23) and cetostearyl alcohol. The phases were separately dissolved by heating to 80°C with stirring, and then the aqueous phase was added to the oil phase and mixed. The mixture was stirred using a homomixer (HM) vacuum emulsifier (PVQ-5UN; Mizuho Industrial Co., Ltd., Osaka, Japan) with a rotational speed of 3500 rpm and an anchor rotational speed of 70 rpm under vacuum (40 cm/Hg). Cooling was initiated under stirring, HM stirring was stopped at 40°C and the model formulation was obtained by cooling to 35°C.
Preparation of 20% Urea Aqueous SolutionTo 80 g of purified water, 20 g of urea was added and dissolved at room temperature by stirring with a stirrer for 15 min.
Polarizing Microscope Observation by Simple Glass-Surface Coating5)Crystallization on a glass surface was observed with a microscope, and crystal growth and growth rate were investigated for the two formulations and the aqueous urea sample.
About 20 mg of sample was placed on a 60×26 mm glass slide. The sample was thinly and evenly spread with an ointment spatula at an application rate of 3.2 mg/cm2, maintained at 40–50% relative humidity, 20–25°C, and crystallization over a 2 h period was clearly observed using a polarizing microscope (Polarizing Microscope Model BH, Model PM-10AK; Olympus Corporation, Tokyo, Japan; 100×objective). Photos were taken at 15, 60, and 120 min.
PXRD MeasurementsThe two formulations and 20% urea aqueous solution were applied to glass plates as in Section “Polarizing Microscope Observation by Simple Glass-Surface Coating” and maintained at 20–25°C, 40–50% relative humidity for 6 h. Samples showing deposits were compared using an X-ray diffractometer (MiniFlex600; Rigaku Corporation, Tokyo, Japan).
Measurement conditions are shown in Table 2.
Table 2. PXRD Measurement Conditions
| Parameter | Description |
|---|
| X-Ray source | CuKα |
| Scan mode | Continuous |
| X-Ray tube voltage–current | 40 kV–15 mA |
| Scan axis | 2θ/θ |
| Scan range (2θ) | 2.0–50.0° |
| Scan speed | 10.0°/min |
| Samping interval | 0.02°/step |
The test samples were prepared as in Section “Polarizing Microscope Observation by Simple Glass-Surface Coating” and maintained at 20–25°C, 40–50% relative humidity for 6 h. Samples showing deposits were compared by DSC using thermal analysis equipment (Thermo Plus DSC8230; Rigaku Corporation).
Measurements were conducted under a stream of nitrogen (40 mL/min) using the following conditions: starting temperature, 20°C; ending temperature, 150°C; rate of temperature increase, 5°C/min; container, closed aluminum (Al) pan.
PXRD–DSC MeasurementsTest samples were prepared as in Section “Polarizing Microscope Observation by Simple Glass-Surface Coating” and maintained at 20–25°C, 40–50% relative humidity for 6 h. Samples showing deposits were compared by PXRD–DSC using an automated horizontal X-ray diffractometer (SmartLab/PXRD–DSC Manage, Rigaku Corporation).
Measurement conditions are shown in Table 3.
Table 3. PXRD–DSC Measurement Conditions
| Parameter | Description |
|---|
| X-Ray Source | CuKα |
| Scan MODE | Continuous |
| X-Ray tube voltage–current | 45 kV–200 mA |
| Scan axis | 2θ/θ |
| Scan range (2θ) | 3.0–40.0° |
| Scan speed | 80° min. |
| Samping interval | 0.02° step |
| Start temperature | Room temperature (r.t.) |
| End temperature | 150°C |
| Temperature rising speed | 5.0°C/min |
| N2 flow rate | 50 mL/min |
| Sample vessel | Open pan (Al) |
| Detector | 1D High-speed detector (D/teX Ultra250) |
Based on the LEC formulation, 1 g of each formulation component was blended with urea in order (No. 1→2→3→4) and four samples were prepared (Table 4). Each sample was placed in a crucible, mixed, melted by heating to 145°C, and was allowed to cool naturally. Each sample was lightly pulverized in a mortar and evaluated by PXRD as described in Section “PXRD Measurements” using the conditions shown in Table 2.
Table 4. Combinations of Urea and LEC Formulation Components (Mixing Ratios Are Shown in Parentheses)
| No. | Sample (mix rate) |
|---|
| 1 | Urea |
| 2 | Urea+Cetostearyl alcohol (1 : 1) |
| 3 | Urea+Cetostearyl alcohol+Lecithin (1 : 1 : 1) |
| 4 | Urea+Cetostearyl alcohol+Lecithin+Glycerin (1 : 1 : 1 : 1) |
NS and LEC formulation test samples were prepared as in Section “Polarizing Microscope Observation by Simple Glass-Surface Coating” and maintained at 20–25°C, 40–50% relative humidity for 6 h. Several milligrams of each test sample was collected and pulverized with an agate mortar and pestle, KBr was added, and the sample was further mixed and pulverized for about 5 min until homogeneous. Disk-shaped samples were formed with a pellet press, then FT-IR spectra were measured using a Fourier transform infrared spectrophotometer (Model FT-210; HORIBA, Kyoto, Japan) and compared with that of urea.
Measurement conditions were: method, KBr; wave number range, 400–4000 cm−1; scan number, 20; resolution, 4 cm−1.
Measurement Results
Polarizing Microscope Observation of Glass Slides Coated with SampleThe results of polarizing microscope observations are provided in Fig. 2. They show that the NS and LEC formulations differ in their crystal growth patterns (crystal habits). The LEC formulation formed small plate-shaped crystals, whereas the NS formulation and the 20% urea aqueous solution both formed needle-shaped crystals with similar crystal habits.
Needle crystals were observed in the NS formulation after 15 min, crystals covered the entire glass slide after 60, then remained unchanged up to 120 min.
In contrast, a small number of plate crystals were present in the LEC formulation after 15 min; the intensity of the polarized section remained weak at 60 and 120 min compared with the NS formulation, showing that crystal growth was slow. The small light spots observed early in the process in the LEC formulation are liquid crystal emulsion particles.
These results confirmed that the quantity of crystal deposition over time was smallest for the LEC formulation and can be seen on visual inspection to increase in the order of LEC formulation<NS formulation<urea aqueous solution, and that the rate of crystal deposition varied with the ingredients.
In the LEC formulation, the small points of light observed in the initial stages are attributable to liquid-crystal regions that formed in the emulsified particles on the loss of water content immediately following application, rather than to changes in the base accompanied by polarization.
The 20% urea aqueous solution provided results similar to that of the NS formulation after 15 min, but the crystals were larger.
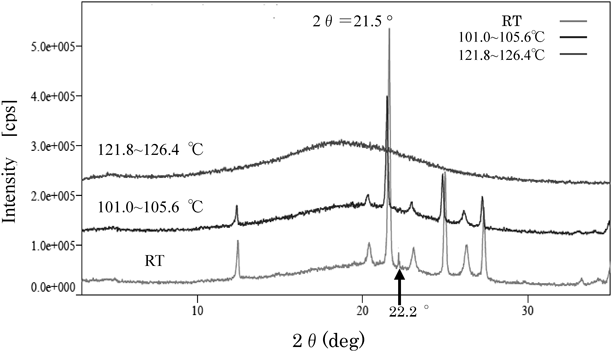
PXRD ResultsPXRD measurements on deposits from the three sample types are shown in Fig. 3. A sharp X-ray diffraction peak for urea was observed at 2θ=22.2°.
Crystals obtained from the NS and LEC formulations had a main diffraction peak (★) at 2θ=21.5°, which is slightly lower than that for urea and thus the diffraction patterns differed from that of urea. A difference was also observed between the NS formulation and the LEC formulation. The deposit from the NS formulation showed a diffraction peak (☆) at 2θ=22.2°, the same as that for urea, in addition to the diffraction peak at 2θ=21.5°, whereas the 2θ=22.2° peak was not observed for the deposit from the LEC formulation.
DSC Results for DepositsDSC results for the three types of sample are shown in Fig. 4. The deposit from the NS formulation provided endothermic peaks at 110.8 and 139.2°C, whereas these peaks were absent from the scan of the LEC formulation deposit, but an endothermic peak at 112.3°C was obtained. These melting temperatures are approximately 25.0°C lower (NS formulation) and 23.5°C lower (LEC formulation) than that of urea (135.8°C). The results indicate that the deposit from the NS formulation contains both a urea composite and urea, in contrast to the deposit from the LEC formulation.
PXRD–DSC ResultsPXRD–DSC results and the X-ray diffraction patterns before and after the main endothermic peak temperature of the three sample types are shown in Figs. 5–8 (urea: Fig. 5; NS formulation: Figs. 6, 7; and LEC-formulation: Fig. 8). An endothermic peak corresponding to melting was observed at about 135°C for urea; the diffraction peak arising from the crystals (2θ=22.2°) disappeared and a halo due to amorphous urea appeared (Fig. 5).
The DSC profile of the NS formulation deposit showed endothermic peaks at about 110°C and 140°C, but no diffraction peak was observed by PXRD–DSC (Fig. 6); a diffraction peak (↑: 2θ=22.2°) due to urea was observed at room temperature but disappeared above 75°C. The main diffraction peak (2θ=21.5°) disappeared upon melting of the sample at about 110°C and a halo arising from amorphous urea appeared.
In contrast, the deposit from the LEC formulation showed the endothermic peak due to melting at about 110°C and no endothermic change at about 140°C, consistent with the DSC profile (Fig. 7). The diffraction peak (2θ=21.5°) disappeared during melting at about 110°C and a halo due to amorphous urea appeared (Fig. 8).
Effect of Formulation Components on Urea Crystals in LEC FormulationThe effect of formulation components was investigated by PXRD to determine why urea crystallizes more slowly in the LEC formulation when compared with the NS formulation.
Figure 9 shows that the diffraction peak due to urea decreased significantly following the addition of cetostearyl alcohol (CSA), and a new diffraction peak likely due to a urea composite6,17,19) was observed at 2θ=21.5°. The addition of lecithin suppressed both peaks and no new diffraction peak was generated. The addition of glycerin essentially eliminated the peak due to urea and a halo became dominant, showing that the urea was amorphous.
Thus, post-application crystallization can be suppressed by judicious choice of formulation components.
Identification of the Deposits by IR SpectroscopyThe IR spectrum of urea (deposits from urea aqueous solution) in Fig. 10 (a) shows two peaks (3444 cm−1 and 3347 cm−1) due to N–H stretching vibrations (range: 3300–3500 cm−1) and a peak due to C–O stretching vibrations in the range 1000–1200 cm−1.
The spectrum of the NS formulation deposit was similar to that of urea and showed two peaks due to N–H stretching vibrations in the range 3300–3500 cm−1, but the peaks were broadened, suggesting that the environment of the urea N–H groups was different when compared to that of urea in aqueous solution. The C–O stretching vibration at 1000–1200 cm−1 was also broadened, indicating that the C=O double bond had transformed to an ether (C–O–C) and that a urea composite had formed.
The spectrum of the LEC formulation deposit was different from that of urea and very different from that of the NS formulation. The two peaks due to urea in the range 3300–3500 cm−1 broadened into one peak and the physical environment of the N–H groups was apparently different from that in urea and the NS formulation. In addition, the peak due to the C–O stretching vibrations of urea at 1153 cm−1 (∆) weakened and a lower frequency peak appeared at 1043 cm−1 (▲), again indicating the transformation of the C=O to C–O–C and the formation of a urea composite.
The observed differences in the IR spectra of the NS and LEC formulations indicated that the urea in the formulations existed in a state that was distinct from that of urea alone.
The deposit from the LEC formulation showed one peak in the range 3300–3500 cm−1 whereas the NS formulation and urea showed two peaks, suggesting a structural difference between the LEC formulation and the other two samples.
Discussion and Conclusion
This study (1) confirmed the slow rate of urea crystallization in an LEC formulation when compared with an NS formulation and urea aqueous solution under winter-like low humidity conditions (humidity: 40–50%; temperature: 20–25°C).
It also showed that the crystal habits in their deposition differed, with the LEC formulation forming small plate-like crystals and both the NS formulation and the urea aqueous solution forming needle-like crystals. The deposits also differed in their properties.
Polarizing microscope observation of glass slides individually coated with the three samples showed numerous needle crystals in the NS formulation and the urea aqueous solution deposits after 15 min, whereas the LEC formulation provided far fewer, but plate-like, crystals. Even after 120 min, the intensity of the polarized section of the LEC formulation deposit was weak compared with the NS formulation, and crystal growth remained slow. These differences (crystal growth rate, crystal habit, and intensity of the polarized section) are likely due to the combination of emulsifier and urea in the formulation.4) Slow urea crystal growth helps maintain a stable crystal interface and the formation of a regular hexahedron with ideal equivalent faces, whereas fast urea crystal growth results in an unstable crystal interface and dendritic growth.4,9)
From these results, it was inferred that the ingredients, particularly the emulsifier in the LEC formulation, which formed small plate-like crystals, tended to decrease the deposition rate, induce a characteristic crystal habit, and lower the deposition quantity in comparison with both the NS formulation and the aqueous urea solution with their differing ingredients and formation of needle-like crystals.
Urea forms urea composites (inclusion compounds etc.) with many linear hydrocarbons and their derivatives. Urea easily arranges along the crystal c-axis by adopting a helical structure through N–H…O hydrogen bonding to form a hexagonal cylinder-type tunnel, known as hexagonal prisms8,9) suggesting that the urea inclusion compound forms hexagonal crystals.4,17,19)
Inclusion compounds vary widely depending on the guest.7,24–26) Studies on urea inclusion compounds have focused on inclusion compounds formed by linear hydrocarbons and their derivatives such as long-chain alcohols,17,18,27,28) for example, the urea-cetyl alcohol inclusion compounds reported in 1979,19) and urea-stearic acid and urea-palmitic acid inclusion compounds reported in 1996 and 1997, repectively.17,18) The DSC, PXRD and PXRD–DSC results obtained here are discussed in reference to these earlier reports. The NS and LEC formulations provided a peak at around 2θ=21.5°, suggesting the formation of an inclusion compound (urea composite) comprising a long-chain alcohol (CSA) and urea. PXRD–DSC scans of the deposit from the NS formulation showed an endothermic peak and diffraction peak due to urea, indicating the presence of urea and a urea composite, whereas the LEC formulation deposit showed only the peak due to the urea composite. The IR spectra of the three samples confirmed that the deposits from the LEC and NS formulations contained urea-based structures, although other peaks were also present.
The results of this study indicate that the ingredients, particularly the lecithin and other emulsifiers, in the LEC formulation suppress crystallization of urea, thereby substantially lengthening the maintenance of its amorphous state and thus lowering the rate of crystal deposition. Based on these findings, it may therefore be expected to provide relatively long periods of suppressed crystallization and thus a dissolved state of urea contents, even under winter conditions, which facilitates transfer of the urea to the skin on application.
It is difficult to include sufficient water in a cream containing 20% or more (w/w) urea because of restrictions imposed by the composition of the formulation. Thus, urea crystals are deposited on the skin over time, often resulting in skin irritation, an unpleasant feeling, and reduced transfer of urea to the stratum corneum.4) It is therefore important to suppress urea crystal growth following application by devising judicious formulations of 20% urea preparations to increase their efficacy, particularly under low humidity conditions.
Acknowledgment
We are grateful to Mr. Yutaka Koyama at Rigaku Corporation for providing technical support.
Conflict of Interest
The authors declare no conflict of interest.
References and Notes
- 1) Kligman A. M., Acta Derm. Venereol., 37, 155–159 (1957).
- 2) Fukahori M., Seki M., Akatsu S., Sakurai H., Yakuzaigaku, 56, 23–31 (1996).
- 3) Allenby A. C., Creasen N. H., Edginton J. A. G., Fletcher J. A., Schock C, Br. J. Dermatol., 81 (Suppl. 4), 47–55 (1969).
- 4) Matumaru H., Tsuchiya S., Yamaguchi K., Sugiyama S., Yakuzaigaku, 37, 57 (1977).
- 5) Ohno H., Iwahara R., Tagami H., Hifukakiyou, 85, 419–428 (1990).
- 6) Higuchi T., J. Pharm. Sci., 52, 1145–1149 (1963).
- 7) Takemoto K., Sonoda N., “Inclusion Compounds,” Vol. 2, ed. by Atwood J. L., Davies J. E. D., MacNicol D. D., Academic Press, London, 1984, pp. 47–67
- 8) George A. R., Harris K. D. M., J. Mol. Graph., 13, 138–141, 190 (1995).
- 9) Harris K. D. M., J. Mol. Struct., 374, 241–250 (1996).
- 10) Harris K. D. M., Thomas J. M., J. Chem. Soc., Faraday Trans., 86, 2985–2996 (1990).
- 11) Knight H. B., Anal. Chem., 24, 1331 (1952).
- 12) McAdie H. G., Can. J. Chem., 40, 2195 (1962).
- 13) Marik K., Ph.D. Thesis, Faculty of Natural Sciences, Charles University, Prague, 1972
- 14) Marik K., Smolkova E., Chromatographia, 6, 420–426 (1973).
- 15) Marik K., Smolkova E., J. Chromatogr. A, 91, 303–312 (1974).
- 16) Smolková-Keulemansová E., Chromatographia, 11, 70–73 (1978).
- 17) Kuhnert-Brandstatter M., Burger A., J. Therm. Anal., 50, 559–567 (1997).
- 18) Kuhnert-Brandstatter M., Burger A., Pharmazie, 51, 288 (1996).
- 19) Smolková E., Feltl L., Všetečka J., Chromatographia, 12, 147–149 (1979).
- 20) Rattner H., Arch. Derm., 48, 47 (1943).
- 21) Wohlrab W., Dermatol. Mon. Schr., 174, 94 (1988).
- 22) Pope F. M., Rees J. K., Wells R. S., Lewis K. G., Br. J. Dermatol., 86, 291–296 (1972).
- 23) Emulsifiers in NS formulation consisted polyoxyethylene (50) hydrogenated castor oil, polyoxyethylene (POE) (20) sorbitan monostearate and sorbitan monostearate; emulsifiers in LEC formulation consisted of purified soybean lecithin, propylene glycol monostearate and glyceryl monostearate.
- 24) Welberry T. R., Mayo S. C., J. Appl. Cryst., 29, 353–364 (1996).
- 25) Kuhnert-Brandstaetter M., Burger A., Pharmazie, 51, 288–292 (1996).
- 26) Yutronic N., Manriquez V., Jara P., Witke O., Merchan J., Gonzalez G., J. Chem. Soc., Perkin Trans. 2, 2000, 1757–1760 (2000).
- 27) Schlenk W., Justus Liebigs Ann. Chem., 565, 204–240 (1949).
- 28) Schlenck W. Jr., “Organische Einschußverbindugen in; Fortschritte der chemischen Forschung,” Vol. 2, Springer Verlag, Berlin, Gottingen, Heidelberg, 1951, p. 92.