Abstract
In drug formulations for external application, variations in the state of pharmaceutical agents within the base formulation may affect the transfer of agents to the skin. Here, we use Raman spectroscopic methods to acquire more detailed information on the state of the active pharmaceutical ingredients within an externally applied formulation. The combination of wide-field Raman spectroscopy with an experimental method in which drug formulations are applied to glass surfaces provided a new method for characterizing the state of pharmaceutical agents within drug formulations. Here, we demonstrate the usefulness of this new method, called application to glass–wide-field Raman spectroscopy (AG-WRS). In addition to allowing rapid and easy wide-field observations, the use of WRS allows Raman imaging in a manner that is insensitive to variations in the thickness of the formulations applied to sample slides. We consider two types of urea-compound creams with different crystal deposition rates, using AG-WRS to characterize the post-application time-evolving state of deposited crystals. Differences in the base pharmaceutical produce different spectra for the deposits, indicating that the deposits differ in composition and structure. In addition, we use microscopic laser Raman measurements to demonstrate that the process of crystal formulation differs significantly for formulations with different compositions. Our results demonstrate that the combination of AG-WRS with existing analytical techniques such as powder X-ray diffraction or thermal analysis yields more detailed and timely post-application information on the state of pharmaceuticals in external application. We believe this will be a valuable analytical tool for future studies related to the development of external application.
In studies related to the development of external application, detailed knowledge of the state of the active pharmaceutical ingredients within the drug formulation is important for determining whether or not the pharmaceutical components can properly exert their intended effect. For crystalline pharmaceuticals in particular, crystallization that occurs a short time after application—as well, of course, as crystallization that occurs within the formulation itself—can degrade the efficiency of transfer to the stratum corneum, making it difficult to achieve clinical effectiveness.1–3)
Methods for the qualitative or quantitative characterization of the crystallization of active pharmaceutical ingredients within drug formulations include Raman spectroscopy, near-infrared (NIR) spectroscopy, powder X-ray diffraction (PXRD), solid-state NMR, and terahertz spectroscopy, and many reports using these methods have appeared to date.4–11) In recent years, the ease with which characteristic peaks associated with various crystal structures of active pharmaceutical ingredients may be obtained has stimulated many studies using Raman spectroscopy12) and PXRD.13,14) In particular, Raman spectroscopy has the advantage that Raman scattering is weak in water15,16); for this reason, in comparison to IR spectroscopy, Raman-based methods for obtaining multicomponent spectra are relatively insensitive to the effect of water molecules, allowing easy measurement of spectra in aqueous solutions.17)
Raman spectroscopic methods thus hold promise for applications in fields involving materials such as liquid detergents and foodstuffs containing large quantities of water.18–20) In this study, we consider the application of these methods to O/W (oil in water)-type creams with significant water content. Microscopic Raman spectroscopy equipment is beginning to enjoy widespread use for studies of solid drug formulations, such as observations of the distribution of pharmaceutical substances on pill surfaces.21–23) However, Raman spectroscopic methods have not been widely used for measurements of external application due to many issues, including the focus depth, the range of observation, and the working distance.
In this study, we show that the focus depth and range of observation can be expanded by using a wide-field Raman spectroscope (RAMANview, Nanophoton Corporation, Osaka, Japan)24) equipped with a laser beam scanning system and an objective lens from a stereomicroscope; this solves the traditional problems associated with rapid measurements of wide fields of view due to sensitivity to variations in the thickness of sample coating layers. Moreover, the fact that Raman spectroscopy measurements may be performed on samples in glass bottles and of similar configurations ensures that characteristics such as the dispersion and deposition states of the active pharmaceutical ingredients in external application can be characterized in situ. Here, we exploit these various advantages to develop a new technique that combines experiments on simple coating layers on glass surfaces—which are used to characterize external application25)—with wide-field Raman spectroscopy (WRS). We show that our new method—termed application to glass–wide-field Raman spectroscopy (AG-WRS)—can be used to analyze the temporal evolution of crystal deposition phenomena in external application following application as coating layers on glass surfaces.
The model formulations used in this study were two distinct 20% urea-compound creams (an NS formulation and an LEC formulation)26) exhibiting different rates of crystal deposition after application to a glass surface. The differences in time dependence of the deposition phenomena within the two creams after application to a glass surface were verified using the AG-WRS method. AG-WRS analyses clearly demonstrated the different compositions of deposits arising from different formulations after application to a glass surface. Moreover, through the use of Raman imaging, it is possible to obtain information that cannot be gleaned by existing measurement methods such as visualization of differences in spectra during the crystal deposition process. We therefore report here on the usefulness of this new measurement method.
Experimental
SamplesModel formulations: 1. NS formulation (NS); 20% urea-compound preparation (O/W-type cream formulation) in which a nonionic surfactant is used as an emulsifier. 2. LEC formulation (LEC); 20% urea-compound preparation (O/W-type cream formulation) in which lecithin is used as an emulsifier. 3. L20; 20% aqueous solution of urea. 4. Urea (JP: the Japanese Pharmacopoeia: Junsei Chemical Co., Ltd., Tokyo, Japan).
Formulas for Model FormulationsThe compositions of the NS and LEC formulations are shown in Table 1.
Table 1. Model Formulations
| Component | Suppliers | Amount |
|---|
| NS formulation | LEC formulation |
|---|
| Urea | Junsei Chemical Co., Ltd., Tokyo, Japan | 20.0 | 20.0 |
| Oily substances | Various sources | 15.0 | 15.0 |
| Cetostearyl alcohol (CSA) | Kokyu Alcohol Kogyo Co., Ltd., Chiba, Japan | 4.0 | 4.0 |
| Polyoxyethylene (50) hydrogenated castor oil (HCO 50) | Nikko Chemicals Co., Ltd., Tokyo, Japan | 1.0 | 0.0 |
| Polyoxyethylene sorbitan monostearate | Nikko Chemicals Co., Ltd., Tokyo, Japan | 1.0 | 0.0 |
| Sorbitan monostearate | Nikko Chemicals Co., Ltd., Tokyo, Japan | 0.4 | 0.0 |
| Purified soybean lecithin (Lecithin) | Tsuji Oilmills Co., Ltd., Mie, Japan | 0.0 | 0.8 |
| Propylene glycol monostearate | Nihon Emulusion Co., Ltd., Tokyo, Japan | 0.0 | 0.8 |
| Glyceryl monostearate | Nikko Chemicals Co., Ltd., Tokyo, Japan | 0.0 | 0.8 |
| Glycerin | NOF Corporation, Tokyo, Japan | 10.0 | 10.0 |
| Purified water | Yoshida Pharmaceutical Co., Ltd., Tokyo, Japan | 48.6 | 48.6 |
| Total | | 100.0 | 100.0 |
Model formulations were prepared in accordance with the preparation methods shown in Fig. 1.
The aqueous phase consists of urea and glycerin—the active pharmaceutical ingredients—together with purified water. The oil phase consists of oils—including both polar and non-polar oils—emulsifiers,27) and cetostearyl alcohol. Each phase was dissolved by heating to 80°C while stirring, then the aqueous phase was added to the oil phase to create a mixture. Next, the mixture was stirred using a vacuum emulsifier (PVQ-5UN, Mizuho Industrial Co., Ltd., Osaka, Japan) under vacuum (40 cm/Hg) with a homomixer (HM) and anchor using rotational speeds of 3500 rpm (HM) and 70 rpm (anchor). Cooling was initiated during stirring; HM stirring was terminated at 40°C, and the mixture was further cooled to 35°C.
Preparation Methods for 20% Aqueous Solution of Urea (L20)Urea (20 g) was added to 80 g of purified water and stirred with a stirrer for 15 min in a heated chamber to ensure dissolution. The mixture was sampled after the urea was confirmed to have dissolved.
Raman Spectral Analysis of Formulation ComponentsWRS was used to measure Raman spectra of the components (Table 1) blended to form the NS and LEC formulations. Table 2 lists the conditions under which measurements were made.
Table 2. Measurement Conditions for Wide-Field Raman Spectroscopy
| Parameter | Operating conditions |
|---|
| Excitation wavelength | 532 nm |
| Laser intensity | 200 mW (L20: 51 mW) |
| Exposure time | 0.3 s/point |
| Objective lens | 1× |
| Measurement area | 5×5 mm |
| The number of the imaging pixels | 50×50 pixel |
| Laser spot scanning interval | 100 µm |
| Measurement time | 13 min 40 s |
Measurement apparatus is WRS device (RAMANview, Nanophoton Corp., Osaka, Japan).24)
Raman Spectrum Measurements of Model FormulationsSamples of NS, LEC, L20, and urea were placed in 10-mL glass bottles and analyzed by WRS using the measurement conditions reported in Table 2.
Measurement apparatus is WRS device (RAMANview, Nanophoton Corp., Osaka, japan).24)
Time-Evolving Measurements of Deposits from Model Formulations Using the AG-WRS MethodAfter producing simple coating layers of NS, LEC, and L20 on glass surfaces as described above, the slides were subjected to both Raman spectral analysis via WRS and to Raman imaging (mapping) at 0 (starting time), 15, 60, and 120 min after application. The conditions under which measurements were performed are listed in Table 2.
Mapping measurements were conducted over a 5×5 mm area. Using a scanning mirror mounted on the optical system of the RAMANview apparatus, mapping was carried out by scanning the laser spot irradiation position below the objective lens and imaging the result of the scanning.
Similarly, after application to the glass slides, experimental procedures for producing simple coating layers on glass surfaces were followed to allow time-evolving observations of the state of crystal deposition using polarization microscopy (100× magnification). Observations were continued for 120 min, and photographs were taken at 0 (starting time), 15, 60, and 120 min.
Measurement apparatus is WRS device (RAMANview, Nanophoton Corp.)24) and polarizing microscopes (models BH and BX-50, Olympus Corporation, Tokyo, Japan).
Our experimental procedure for producing simple coating layers on glass surfaces involves placing approximately 20 mg of the substance in question on a 60×26 mm glass slide and then using a smoothing spatula to spread the substance thinly, yielding a layer of uniform thickness covering the entire area of the slide. After application of the substance, the samples were allowed to rest uncovered in a low-humidity environment (relative humidity 40–50%, temperature 20–25°C).
Measurement apparatus is WRS device (RAMANview, Nanophoton Corp.).24)
Characterization of Deposits Using PXRDUsing the procedures described above, simple coating layers of NS, LEC, and L20 on glass surfaces were prepared to provide the experimental samples. The quantity of each substance applied to the slide was 3.2 mg/cm2, and the substance was spread uniformly over the glass surface (21×30 cm). The samples were left to rest (20–25°C, relative humidity 40–50%), and then PXRD measurements were conducted on the samples 15, 60, and 120 min after application to the glass surface using a PXRD apparatus. Measurement conditions are listed in Table 3.
Table 3. Measurement Conditions for PXRD
| Parameter | Operating conditions |
|---|
| X-Ray source | CuKα |
| Scan mode | Continuous |
| X-Ray tube voltage–current | 40 kV–15 mA |
| Scan axis | 2θ/θ |
| Scan range (2θ) | 2.0–50.0° |
| Scan speed | 10.0°/min |
| Samping interval | 0.02°/step |
Experimental apparatus is PXRD apparatus (MiniFlex600, Rigaku Corp., Tokyo, Japan).
Microscopic Laser Raman Measurements of Deposits from the NS and LEC FormulationsUsing the procedures described above for producing simple coating layers on glass surfaces, approximately 20-mg quantities of NS and LEC formulations were applied to glass slides (60×26 mm) to provide experimental samples.
After application to glass slides, samples were left to rest (20–25°C, relative humidity 40–50%) and were then observed via laser Raman microscopy (10× magnification) at various times to obtain time-evolving Raman images (mapping).
Mapping measurements were conducted over a 0.8×0.16 mm area. Mapping was carried out by scanning the laser spot irradiation position below the objective lens and imaging the result of the scanning.
The measurement conditions are listed in Table 4.
Table 4. Conditions for Microscopic Laser Raman Measurements
| Parameter | Operating conditions |
|---|
| Excitation wavelength | 532 nm |
| Laser intensity | 0.9 mW |
| Exposure time | 20 s/line |
| Objective lens | 10× |
| Measurement area | 0.8×0.16 mm |
| The number of the imaging pixels | 400×40 pixel |
| Laser spot scanning interval | (x, y)=(2, 4 µm) |
| Measurement time | 13 min 28 s |
Experimental apparatus is laser Raman microscope (RAMANtouch, Nanophoton Corp.).
Regarding measurement points, because the changes in the crystal precipitation states of the two formulations differed, the crystal state for the NS formulation was observed 15 and 60 min after the formulation was applied to the glass surface. The crystal deposits at these two times exhibited different spectra. Similarly, for the LEC formulation, the crystal state was observed at 15 min and 8 h.
Results
Results of Raman Spectral Analysis of Formulation ComponentsFigure 2 shows the results of Raman spectrum measurements, obtained by WRS, of the individual components that were blended together to provide the NS and LEC formulations. A sharp peak characteristic of urea is visible at 1012 cm−1. The fact that this feature is easily distinguishable and is not affected by the spectra of the other components in the formulations confirms the possibility of identifying urea using Raman spectroscopy. This result demonstrates that Raman spectroscopy may be used to analyze urea in both formulations (NS and LEC).
Results of Raman Spectral Measurements of the Model FormulationsFigure 3 shows Raman spectra, obtained by WRS, of the NS and LEC formulations, L20 and Urea.
Whereas the spectrum obtained for urea exhibits a sharp peak at 1012 cm−1 originating from urea, the spectrum of L20—which is an aqueous solution of urea—exhibits a broad peak near 1000 cm−1, which may be interpreted as the spectrum of urea in its dissolved state. The spectra of both model formulations are broad, with all peaks lying in the vicinity of 1000 cm−1.
From these observations, we conclude that urea exists in the dissolved (amorphous) state in both model formulations. Note that the peak at 1100 cm−1 is due to the glass slide.
Results of AG-WRS Measurements of the Temporal Evolution of Deposits from Model FormulationsTime-Evolving Raman Spectral Analysis and Polarization Microscopy Observations Using AG-WRSThe NS and LEC formulations and L20 were applied as coating layers on glass slides. Raman spectral analysis and imaging were performed 0 (starting time), 15, 60, and 120 min after application to the glass slides.
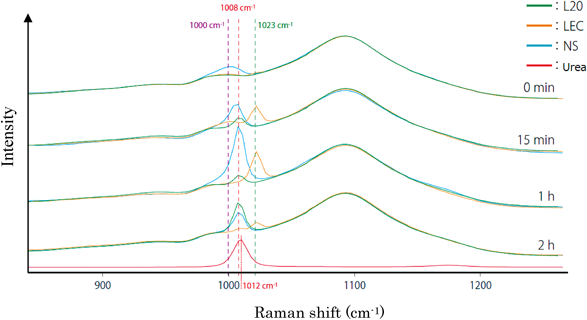
Figure 4 shows the spectra for each formulation at each of the measurement times. A reference spectrum of urea is included in Fig. 4. Figure 5 shows images obtained by mapping the measured spectra of the deposits from the test preparations. The color contrast in these images depicts spectral features at 1000 cm−1 in purple, 1008 cm−1 in red, and 1023 cm−1 in green.
Comparing the results shown in Fig. 4 for the NS and LEC formulations—which exhibit different rates of crystal deposition after application—we see that the deposits that gradually appear from the two formulations exhibit different spectra.
For NS, the spectral peak is visible at 1008 cm−1, similar to L20 after 15 min; thereafter, the peak position does not change, and the peak intensity grows over time.
For LEC, no peak is discernible initially; after 15 min, a peak is visible at 1023 cm−1. Thereafter, the peak position does not change. For L20, a spectral peak at approximately 1008 cm−1 is visible after 15 min; the intensity of this peak increases over time.
By focusing the mapping procedure on the characteristic peak of bulk urea near 1012 cm−1 in Fig. 6, we found that the NS formulation, for which the rate of crystal deposition is relatively rapid, initially exhibits spectral peaks corresponding to urea in its dissolved state (1000 cm−1: purple). The images reveal that, after 15 min, purple (1000 cm−1) and red (1008 cm−1) peaks exist in a blended configuration, and the peak shifts toward 1008 cm−1 (red) as time passes. At subsequent times of 60 min and 120 min, only the red (1008 cm−1) spectral peak is discernible.
Polarization microscopy observations of NS indicate the formation of needle crystals after 15 min; at 60 min and later, the needle crystals cover the entire area of the glass slide.
For the LEC formulation, in which the rate of crystal deposition is relatively slow, the initial images reveal a weak peak at 1000 cm−1 (purple). After 15 min, the images show that the peak has shifted to 1023 cm−1 (green), demonstrating that the nature of the spectral shift in LEC differs from that in NS. Images taken after 15 min show that purple and green exist in a blended configuration, indicating spectral shifts that evolve with time during the measurement period (13 min 40 s). After 60 min, only the 1023 cm−1 (green) peak is visible. After 120 min, a slight spectral peak near 1008 cm−1 (red) becomes evident, coexistent with the spectral peak at 1023 cm−1 (green).
Polarization microscopy images of LEC reveal that its deposit forms plate crystals; after 15 min there is little crystal deposition, and after 60 min and 120 min, the intensity of the polarization signal is weaker than for NS, indicating slower crystal deposition compared with the NS formulation. The areas of low-intensity light visible in the early stages for the LEC formulation represent liquid crystal emulsion particles.
In the LEC formulation, the small points of light observed in the initial stages are attributable to liquid-crystal regions that formed in the emulsified particles on the loss of water content immediately following application, rather than to changes in the base accompanied by polarization.
The images for L20 are originally purple; after 15 min this changes to red, and Fig. 4 indicate that the L20 deposit exhibits a spectral peak at 1008 cm−1 (red).
The results of polarization microscopy observations of L20 are similar to those of NS; needle crystals are evident after 15 min, and these crystals are relatively large compared with those of deposits from NS.
Images derived from Raman spectral analysis and polarizing microscope photographs reveal that the growth state of crystals (the crystal habit) is different for NS and LEC, from which we conclude that the composition and crystal structure of the deposits differ as well. On the other hand, the crystal habits of the NS and L20 samples are similar: both are needle-shaped, with spectral features originating from urea appearing at the same wavelengths.
Comparison of the Spectra of NS (1008 cm−1), LEC (1023 cm−1), and L20 (1008 cm−1)Comparison of the spectra of the NS red-colored region and the LEC green-colored region showed that both include spectral peak(s) in the C–H group vibrational spectral region (2800–3000 cm−1) thought to be attributable to long-chain alcohol including its alkyl group and the emulsifier, and that the spectra were similar in overall shape.
The urea-derived vibrational peaks found near 1000 cm−1, in contrast to the urea peak occurring at 1012 cm−1, occurred at 1023 cm−1 in the green region found for LEC and at 1008 cm−1 in the red region found for NS and L20, and thus differed between the two formulations. The spectrum near 1000 cm−1 is believed to represent the vibrational spectral region (700–1200 cm−1) of the C–N group in the urea molecular structure. It was concluded on this basis that the difference in the emulsifiers affected the urea N–H group.
It was also found that near the regions assumed to represent the C=O group vibrational spectrum (1500–1650 cm−1) and the N–H group vibrational spectrum (3100–3600 cm−1), the peak shapes were slightly different. From this, we inferred that the NS and LEC depositions differ in the states of their C–N, C=O and N–H groups in the urea due to differences in their ingredients, thus giving rise to a difference in the structure of their molecular aggregates.
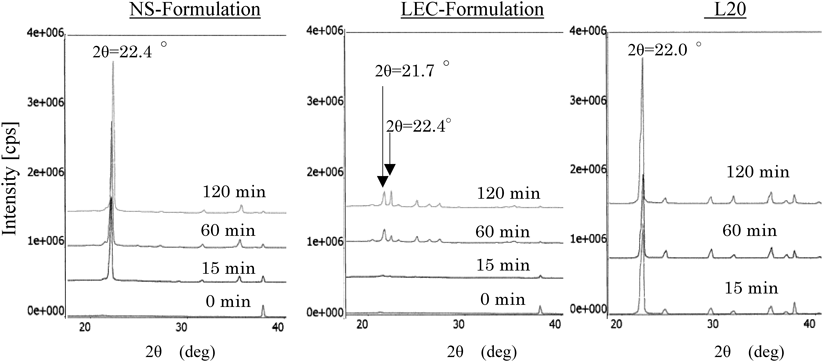
Characterization of Deposits Using PXRDFigure 7 shows the results of PXRD measurements of samples containing deposits from the NS formulation, the LEC formulation, and L20; the deposit samples were collected at 15, 60, and 120 min after the substance in question was applied as a coating layer to a glass surface.
Time-evolving PXRD measurements of coating layers of the NS formulation, which exhibits relatively rapid crystal deposition, show a prominent diffraction peak at 2θ=22.4°; the peak is present in the 15-min sample and grows stronger with the passage of time.
Time-evolving PXRD measurements of coating layers of the LEC formulation, which exhibits relatively slow crystal deposition, show diffraction patterns different from those of the NS formulation. The 15-min sample of the LEC formulation exhibits broad diffraction patterns indicating an amorphous state, although a slight diffraction peak is discernible at 2θ=21.7°. The 60-min sample shows characteristic diffraction peaks at 2θ=21.7° and 2θ=22.4°. The 120-min sample shows patterns similar to those of the 60-min sample, with increased strength for the peak at 2θ=22.4°.
Time-evolving PXRD measurements of a coating layer of L20 reveal a sharp diffraction peak at 2θ=22.0°; this peak is present in the 15-min sample, and the 60- and 120-min samples yield similar diffraction patterns. Thus, we have demonstrated that the X-ray diffraction peaks of NS, LEC, and L20 deposits all exhibit distinct behavior, consistent with their Raman spectra.
Results of Microscopic Laser Raman Measurements of Deposits from the NS and LEC FormulationsThe process of crystal deposition from the NS and LEC formulations—which contain different base pharmaceuticals—was observed microscopically over a 0.8×0.16 mm area using laser Raman microscopy. Figure 8 shows the resulting images.
For the NS formulation, the crystal state was observed 15 and 60 min after the formulation was applied to the glass surface; the crystal deposits at these two times exhibit different spectra. Similarly, for the LEC formulation, the crystal state was observed 15 min and 8 h after the formulation was applied to the glass surface; the crystal deposits observed at these two times exhibit different spectra.
For the NS formulation, in which crystal deposition is relatively rapid, observations at 15 min revealed needle crystals that produce a peak at 1008 cm−1 (red), whereas observations at 60 min revealed crystal deposits surrounding the needle crystals producing a peak at 1023 cm−1 (green).
On the other hand, for the LEC formulation, in which crystal deposition is relatively slow, observations at 15 min revealed only particulate crystals exhibiting a peak at 1023 cm−1 (green), whereas observations at 8 h revealed needle crystals producing a peak at 1008 cm−1 (red) separate from the particulate crystals: the needle and particulate crystals exist in a blended configuration. These results indicate that the NS and LEC formulations involve different processes of crystal formation within the formulation as the formulation dries after application.
Discussion
Using Raman spectroscopic methods to measure the various components of several model formulations consisting of creams containing 20% (w/w) urea, we identified the characteristic spectral peak of urea at 1012 cm−1. This success, together with our further finding that the characteristic urea peak is not affected by the presence of surfactants and other similar components, demonstrates that Raman spectroscopic methods may be applied to the qualitative analysis of urea in model formulations (creams containing 20% (w/w) urea).
Using the AG-WRS method, we performed time-evolving Raman spectroscopic analyses of the state of crystal deposition in two creams containing 20% (w/w) urea with different crystal deposition rates (NS and LEC) and L20. The results of our experiments demonstrated that the wavelengths of the Raman peaks originating from urea in the deposits shifted relative to the urea peak of 1012 cm−1; the shifted values were 1008 cm−1 for NS, 1023 cm−1 for LEC, and 1008 cm−1 for L20. The spectral region near 1000 cm−1 is deemed to represent the C–N group vibrational spectrum (700–1200 cm−1) based on the urea molecular structure, and an effect on the amino group of the urea was therefore inferred.
In addition, from the timescale over which the spectra varied, we determined that the rate of crystal deposition in LEC is slower than that in NS. Our imaging plots indicated that the urea-related Raman spectrum of LEC—which exhibits relatively slow crystal deposition—differs from the spectra of NS and L20, in which crystal deposition is relatively rapid. This finding indicates that the deposits exhibit different compositions and crystal structures.
Images obtained using the AG-WRS method and polarizing microscope photographs indicate similar patterns of temporal evolution. However, the addition of mapping measurements—made possible by the AG-WRS method—allows one to not only see the state of crystal deposition but also to perform simultaneous non-destructive measurements of features that cannot be identified from photographs, including the composition of deposits and differences in their crystal structure. This establishes the AG-WRS method as a useful characterization technique.
Comparison of the spectra of deposits from the NS formulation (red) and the LEC formulation (green) showed that their shapes were similar overall but the peak shapes were different in the C–N group (700–1200 cm−1), C=O group (1515–1650 cm−1) and N–H group (3100–3600 cm−1) vibrational spectral regions. This indicates that the two formulations differed in the state of their urea constituent C–N, C=O and N–H groups due to their differing emulsifiers, which led to different crystallization rates and crystal structures.
It is known that urea forms composites with linear hydrocarbons and their derivatives.28–31) The LEC and NS ingredients include molecular distributions of long-chain alcohols and emulsifiers bearing straight-chain hydrocarbons, and complexes presumably tend to form between these ingredients and the urea in both formulations. In this light, it was inferred that the difference between the NS and the LEC formulas leads to differences between their molecular interactions that result in different Raman spectrum wavelengths of their deposits.
PXRD measurements of the NS formulation, the LEC formulation, and L20 reveal distinct X-ray diffraction peaks for each formulation, indicating distinct structures for the various formulations. In particular, the deposit from the LEC formulation had an almost entirely amorphous form after 15 min, and Raman spectroscopic analysis confirmed a spectral shift from 1000 to 1023 cm−1. Considering this finding together with the PXRD diffraction patterns, we conclude that the constituents of LEC responsible for the 1023 cm−1 (green) spectral component are less likely to form a crystalline structure than the constituents of NS responsible for the 1008 cm−1 (red) spectral component.
Microscopic observations using laser Raman microscopy indicate that the NS formulation—for which the rate of crystal deposition is relatively rapid—first forms a needle crystal deposit with spectral features at 1008 cm−1 (red); thereafter, the deposition process proceeds by the accumulation of constituents with spectral features at 1023 cm−1 (green) around the needle crystal. In contrast, the LEC formulation, for which the rate of crystal deposition is relatively slow, first forms particulate crystals with spectral features at 1023 cm−1 (green) and thereafter begins to form needle crystals with spectral features at 1008 cm−1 (red). This demonstrates that the different formulas of the two formulations result in different sequential orders for the formation of deposits originating from urea.
Conclusion
We here demonstrated the utility of the AG-WRS method, a technique consisting of two components: (a) a laser-beam scanning system and a WRS apparatus equipped with an objective lens from a stereomicroscope, and (b) a method for producing simple coating layers on glass surfaces. The AG-WRS method makes it easy to perform imaging analyses of the temporal evolution of the state of crystal deposition occurring in urea preparations.
Our study demonstrates that the AG-WRS method, by allowing simultaneous spectral analysis and imaging, allows concurrent chemical, qualitative, and visual characterization of the surfaces of external application. In addition, the measured samples do not require preprocessing but may be subject to measurement in situ; this proves useful for characterizing the temporal evolution of deposition states. However, to obtain more detailed characterization of the crystal deposition states of active pharmaceutical ingredients from external application, one would need to combine these results with results obtained using existing methods such as PXRD and thermal analysis.
Regarding future work, we hope that further improvements in the performance of experimental equipment will allow wider fields of vision to be scanned in shorter periods of time, enabling a more exhaustive characterization of sample surfaces. The AG-WRS method allows the temporal evolution of external application after their application to a glass surface to be characterized quickly and easily. Consequently, this method should find a wide range of applications, including not only the obvious example of designing formulations for external application but also the observation of blend variations arising when external applications are mixed together.
Acknowledgment
We are grateful to Mr. Tomoya Uchiyama at Nanophoton Corporation for providing technical support.
Conflict of Interest
The authors declare no conflict of interest.
References and Notes
- 1) Allenby A. C., Creasen N. H., Edginton J. A. G., Fletcher J. A., Schock C. Brit. J. Derm., 81 (Suppl. 4), 47–55 (1969).
- 2) Ohno H., Iwahara R., Tagami H., Hifukakiyou, 85, 419–428 (1990).
- 3) Higuchi T., J. Pharm. Sci., 52, 1145–1149 (1963).
- 4) Palermo R. N., Short S. M., Anderson C. A., Tian H., Drennen J. K. III, J. Parm. Innov., 7, 56–68 (2012).
- 5) Katrincic L. M., Sun Y. T., Carlton R. A., Diederich A. M., Mueller R. L., Vogt F. G., Int. J. Pharm., 366, 1–13 (2009).
- 6) Chieng N., Rades T., Aaltonen J., J. Pharm. Biomed. Anal., 55, 618–644 (2011).
- 7) Shen Y.-C., Int. J. Pharm., 417, 48–60 (2011).
- 8) Newman A. W., Byrn S. R., Drug Discov. Today, 2013, 898–905 (2013).
- 9) Terada K., Pharm. Tech. Jpn., 31, 149–155 (2007).
- 10) Hisazumi J., Watanabe T., Suzuki T., Wakiyama N., Terada K., Chem. Pharm., 452, 249–256 (2013).
- 11) Xiang D., Lobrutto R., Cheney J., Wabuyele B. W., Berry J., Lyon R., Wu H., Khan M. A., Hussain A. S., Appl. Spectrosc., 63, 33–47 (2009).
- 12) Ueno T., Urakami K., Higashi A., Umemoto K., Godo M., Kitamura K., The Pharmaceutical Society of Japan, 125, 807–814 (2005).
- 13) Stephenson G. A., Forbes R. A., Reutzel-Edens S. M., Adv. Drug Deliv. Rev., 48, 67–90 (2001).
- 14) Terada K., Pharm. Tech. Jpn., 21, 31–37 (2005).
- 15) “Analitical Applications of Raman Spectroscopy,” ed. by Pelltier M. J., Blackwell Science, Oxford, 1999.
- 16) “Handbook of Raman Spectroscopy,” ed. by Lewis I. R., Edwards H. G. M., Marcel Dekker Inc., New York, 2001.
- 17) Terashita K., Pharm. Tech. Jpn., 31, 157–161 (2015).
- 18) Qin J., Chao K., Kim M. S., Cho B.-K., Peng Y., Trans. ASABE, 57, 1783–1792 (2014).
- 19) Hashimoto S., Yagyu F., Higuchi S., Tanaka S., Bunseki Kagaku, 26, 433–437 (1977).
- 20) Hashimoto S., Tanaka S., Yagyu F., Higuchi S., Yukagaku, 28, 417–420 (1979).
- 21) Terashita K., Fuurukawa T., Hisada H., Ochiai S., Pharm. Tech. Jpn., 23, 87–96 (2007).
- 22) Terashita K., Fuurukawa T., Hisada H., Ochiai S., Pharm. Tech. Jpn., 30, 215–223 (2014).
- 23) Terashita K., Hisada H., Pharm. Tech. Jpn., 31, 865–873 (2015).
- 24) Kobayashi M., Kubota N., Uchiyama T., Oota T., Wide-field scope with Deep Depth of Field and Long Working Distance, JSAP spring meeting proceeding, Vol. 60th ROMBUNNO 27P-D1-2 (2013).
- 25) Ohno H., Iwahara R., Tagami H., Hifukakiyou, 85, 419–428 (1990).
- 26) The NS formulation is a formula in which a nonionic surfactant is used as an emulsifier. The LEC formulation is a formula in which lecithin is used as an emulsifier.
- 27) Emulsifiers of NS formulation consisted polyoxyethylene (POE) (50) hydrogenated castor oil, POE (20) sorbitan monostearate and sorbitan monostearate, and emulsifiers of LEC formulation consisted purified soybean lecithin, propylene glycol monostearate, glyceryl monostearate.
- 28) Takemoto K., Sonoda N., “Inclusion Compounds,” Vol. 2, ed. by Atwood J. L., Davies J. E. D., MacNicol D. D., Academic Press, London, 1984, pp. 47–67.
- 29) Fukahori M., Seki M., Akatsu S., Sakurai H., Yakuzaigaku, 56, 23–31 (1996).
- 30) Kuhnert-Brandstätter M., Burger A., J. Therm. Anal., 50, 559–567 (1997).
- 31) Smolkova E., Feltl L., V’setecka J., Chromatographia, 12, 3 (1979).