Abstract
The decision criteria for the physical appearance of pharmaceutical products are subjective and qualitative means of evaluation that are based entirely on human interpretation. In this study, we have developed a comprehensive method for the quantitative analysis of the physical appearance of film coated tablets. Three different kinds of film coated tablets with considerable differences in their physical appearances were manufactured as models, and their surface roughness, contact angle, color measurements and physicochemical properties were investigated as potential characteristics for the quantitative analysis of their physical appearance. All of these characteristics were useful for the quantitative evaluation of the physical appearances of the tablets, and could potentially be used to establish decision criteria to assess the quality of tablets. In particular, the analysis of the surface roughness and film coating properties of the tablets by terahertz spectroscopy allowed for an effective evaluation of the tablets’ properties. These results indicated the possibility of inspecting the appearance of tablets during the film coating process.
The physical properties of pharmaceutical products can be evaluated by visual inspection based on human interpretation or by using machines for inspection. The decision criteria for the appropriate appearance of pharmaceutical products are generally specified based on a comparison with the appearance of products that have been prepared as a standard. This means that the interpretation of the decision criteria can be subjective and a qualitative means of evaluation. In this regard, evaluating the quality of film coated tablets can be difficult because no objective criteria are currently available for this purpose. The development of suitable decision criteria based on objective and quantitative evaluation methods is therefore highly desired.
Changes in the surface roughness of tablet films during the film coating process have been evaluated using a laser profilometer.1) Differences in the color properties of tablets have been used to measure differences in their physical appearance, which can be dependent on the compression pressure used during the manufacture of the tablets.2) Furthermore, contact angle measurements have been used to characterize a variety of different physicochemical properties, including the hydrophilicity properties of silicone pressure-sensitive adhesives and ethyl cellulose matrix tablets.3) The cracking of the film coated layers on a swelling tablet can be predicted in a non-destructive manner using terahertz waves.4) Although these quantitative methods of evaluation have been individually applied to assess the appearance of different tablets, there have been no reports in the literature to date pertaining to the development of a comprehensive system for evaluating the surface properties of tablets. Furthermore, it has not been determined whether any of these measurement values coincide with the appearance properties of tablets. Lastly, there has been no research aimed at developing a comprehensive method for quantitatively evaluating the quality characteristics of film coated tablets.
We have developed a comprehensive and quantitative method for evaluating the appearance of film coated tablets. Three different types of film coated tablets with significant differences in their appearance were manufactured, and their surface roughness, contact angle, color and physicochemical properties were evaluated as potential performance parameters for the quantitative analysis of their appearance.
Results and Discussion
The physical appearances of the surfaces of the different batches of the tablets are shown in Fig. 1. The surface of the Product 1 tablet was uniform with very few imperfections, whilst the surface of the Product 2 tablet was heterogeneous with a highly uneven surface. The surface quality of Product 3 tablet was classed as intermediate between those of the Products 1 and 2 tablets. The results of a conventional method for evaluating the physical appearances of the tablets by visual inspection revealed that the quality of the physical appearance of the three tablet surfaces was ranked in the following order, from best to worst: Products 1, 3 and 2.
The surface roughness (Ra) and contact angle (AC) values are shown in Table 1. The Ra and AC values were determined to be 4.08 µm and 83.0°, 7.52 µm and 70.7°, and 5.16 µm and 71.7° for Products 1, 2, and 3, respectively. The Ra values of the different products increased in the order of Products 1, 3 and 2, whilst the AC values decreased in the same order. This result indicated that the heterogeneity of visual appearance for the tablet surfaces could be correlated with the Ra and AC values of the tablets (i.e., tablet surfaces with higher heterogeneity showed higher Ra values and lower AC values). Statistically significant differences in the Ra values were observed for multiple comparisons among the three different products. In contrast, there were no significant differences between the AC values of Products 2 and 3.
Table 1. Surface Roughness and Contact Angle Measurements*
| Parameters | Product 1 | Product 2 | Product 3 |
|---|
| Surface roughness, Ra (µm) | 4.08±0.12†, ** | 7.52±0.51††, ** | 5.16±0.44 †††, ** |
| Contact angle, AC (°) | 83.0±1.9†, ** | 70.7±1.7††, ** | 71.7±2.7 ††, ** |
* All data are the average values obtained from ten samples. ** Average values that do not share the same number of dagger symbols (i.e., †) are statistically significantly different at the 5% standard.
The luminosity (L), chromaticity (a and b) and calculated color difference (ΔE) values are shown in Table 2. The ΔE value between Products 1 and 2 was classified as ‘Appreciable,’ whilst the corresponding values between Products 1 and 3 and Products 2 and 3 were classified as ‘Noticeable.’ Based on these values, it was possible to quantify differences in the color of the tablets that could not be distinguished by visual inspection alone.
Table 2. Color Difference Details
| Parameters | Product 1 | Product 2 | Product 3 |
|---|
| Brightness, L* | 86.7 | 85.6 | 87.2 |
| Chromaticity, a* | 7.5 | 7.9 | 7.3 |
| b* | 42.1 | 38.8 | 40.1 |
| Color difference, ΔE | ΔE12 (Product 1 vs. 2): 3.4, Appreciable |
| ΔE13 (Product 1 vs. 3): 2.0, Noticeable |
| ΔE23 (Product 2 vs. 3): 2.2, Noticeable |
* L, a and b are the average values obtained from ten samples.
The average and relative standard deviation values of the thickness of the film coated layer (FT), the film surface density (FSD) and the difference between the interface density of the film layer and core tablet (IDD) are shown in Table 3. The average of FT, FSD and IDD values of Products 1–3 were determined to be in the ranges of 54.1–59.0 µm, 18.0–18.6% and −1.8 to −2.3%, respectively. The order of ranking among the average FT and FSD values did not coincide with the results of the visual appearance test. Furthermore, a statistically significant difference in the IDD values was only observed between Products 1 and 2, although the order of the IDD values for Products 1–3 coincided with that of the visual appearance test. These results therefore indicated that differences in the surface properties of Products 1–3 could not be detected based on the average FT, FSD or IDD values. In contrast, the order of the relative standard deviations (RSDs) of the FT, FSD and IDD values for Products 1–3 coincided with that of the visual appearance test. Furthermore, an increase in the heterogeneousness of the tablet surface appearance corresponded to an increase in the absolute value of the RSD values. Statistically significant differences in the RSD values of FT were observed for multiple comparisons between the three products, whilst differences in the RSD values of FSD were only observed between Products 1 and 2 and Products 2 and 3. In contrast, there were no significant differences between the RSD values of IDD for any of the products.
Table 3. Differences in the Film Thickness, Film Surface Density and Interface Density Properties of the Film Coated Layers*
| Parameters | Product 1 | Product 2 | Product 3 |
|---|
| Film thickness, FT | | | |
| Average (µm) | 54.1±1.3 | 56.6±1.5 | 59.0±2.2 |
| RSD (%) | 5.2±1.2†, ** | 14.8±5.8††, ** | 9.1±2.2†††, ** |
| Film surface density, FSD | | | |
| Average (%) | 18.6±0.3 | 18.4±0.8 | 18.0±0.6 |
| RSD (%) | 2.6±0.8†, ** | 4.2±0.6††, ** | 3.2±0.8†, ** |
| Interface density difference, IDD | | | |
| Average (%) | −1.8±0.2†, ** | −2.3±0.5††, ** | −2.0±0.5†, ††, ** |
| RSD (%) | −26.9±2.8†, ** | −34.2±8.7†, ** | −29.5±5.3†, ** |
* All data are the average values obtained from ten samples. ** Average values that do not share the same number of dagger symbols (i.e., †) are statistically significantly different at the 5% standard.
We analyzed the surface roughness, contact angle, color and film coating layer properties of three different film coated tablets. The results of this analysis clearly showed that variations in the appearance resulting from the different manufacturing conditions could be used as the basis of a quantitative method for evaluating the physical appearance of tablets. Decision criteria concerning the appearance of tablets could therefore be set using these comprehensive quantitative evaluation methods. In particular, the analysis of the surface roughness and film coating properties of the tablets by terahertz spectroscopy allowed for an effective evaluation of the tablet properties. These results therefore highlighted the possibility of inspecting the appearance properties of tablets during the film coating process. Furthermore, it is envisaged that these new methods could be used to evaluate film coating processes based on the quantitative evaluation of film coated tablets and film coated layers in terms of their physical appearance.
Experimental
MaterialsThe tablet cores were prepared using D-mannitol (Roquette, Lestrem, France), microcrystalline cellulose (Asahi Kasei Chemicals, Tokyo, Japan), crospovidone (BASF, Ludwigshafen, Germany) and magnesium stearate (Merck KGaA, Darmstadt, Germany). The composition of each tablet core was as follows: D-mannitol 64% (w/w), microcrystalline cellulose 30% (w/w), crospovidone 5% (w/w) and magnesium stearate 1% (w/w). D-Mannitol, microcrystalline cellulose and crospovidone were initially blended in a container mixer before being blended with magnesium stearate in the same container. The blended powder was subsequently compressed on a compression machine (HT-X20, Hata Iron Works, Kyoto, Japan) using 8 mm biconcave punches to form the core tablets. Opadry® Yellow (Colorcon, Shizuoka, Japan) containing hypromellose, polyethylene glycol, titanium oxide, talc and yellow ferric oxide was used as the film coating agent by dispersing in water at a concentration of 10% (w/w).
EquipmentThe film coating process was performed on a pilot scale with 33 kg of the core tablets charged into the film coater system (Powrex, Hyogo, Japan).
Film CoatingThe core tablets were coated with 3% (w/w) Opadry® Yellow by spraying the tablets with a dispersion of the coating. Three batches of film coated tablets were manufactured under the conditions shown in Table 4.
Table 4. Film Coating Process Parameters
| Process parameters | Product 1 | Product 2 | Product 3 |
|---|
| Inlet air temperature (°C) | 75 | 75 | 85 |
| Spray rate (mL/min) | 60 | 120 | 120 |
| Inlet air volume (m3/min) | 10 | 10 | 10 |
| Drum rotating speed (min−1) | 8 | 8 | 8 |
| Atomizing air volume (NL/min)* | 180 | 180 | 180 |
* NL/min means normal liter per min.
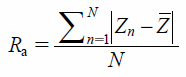
The surface roughness of the tablets was measured using a VK-9700 laser microscope (Keyence, Osaka, Japan). The arithmetic average roughness (calculated as
, where
Zn is the individual height value of the measurement point by the laser reflection measurement,
Z̄ is the mean value of all of the height data points and
N is the number of measurement points) was used as the standard roughness.
Contact AngleContact angle measurements were recorded using a contact angle meter (Kyowa Interface Science, Saitama, Japan). The θ/2 method was used to measure the contact angles with 2 µL of purified water.
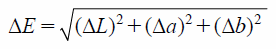
Color DifferenceThe luminosity and chromaticity values were measured using a color difference meter (Konica Minolta, Tokyo, Japan). The specular component exclude method was used to evaluate colors in the near visual range. Differences in the color (
) between two batch samples were evaluated based on the standard color difference value reported in the National Bureau of Standards (NBS unit) for each sample.
Terahertz SpectroscopyThe film coated layers were visualized using a TAS-7500 THz spectroscopic imaging system (Advantest, Tokyo, Japan). Details regarding element technology and the data acquisition process have already been reported.5) The images were collected in the reflection measurement mode. A circular area with a radius of 2.1 mm was set as the measurement area at the center of the tablet. Fifty points were measured within the circular area in each sample. Based on the principles of terahertz spectroscopic measurement, we measured the thickness of the film coated layer, the film surface density and the difference between the interface density of the film layer and core tablet. The FT was obtained from the time lag between the reflected signal from the surface of film coated layer and core tablet. The reflectance of reflected signal from the surface of film coated layer was obtained from the ration of the amplitude of the reference signal and the measurement signal. The reflectance is known to change depending on the refractive index of the surface of the object to be measured (film coated layer), which can be regarded as a parameter representing the density of the material. Therefore, the reflectance can be termed as the FSD of the film coated layer.
The amplitude of reflected signal from the boundary between the film coated layer and the core tablet changes with the refractive index difference (density difference) at the boundary suggested by Fresnel’s formula. Then, the IDD is defined as the ration of the amplitude obtained from the reference signal and the measurement signal at the boundary. Definitions of these parameters have already been reported.4)
StatisticsThe results for the three different products were checked for statistically significant differences where there was a coincidence between the results, except for differences in color. Bartlett’s test was used to check the equivalence of variance and a multiple comparison evaluation was also performed. The level of significance was taken as p<0.05.
Acknowledgment
The authors would like to thank Mr. Yasunori Mori at Astellas Pharma Tech Co., Ltd. for manufacturing the film coated tablets.
Conflict of Interest
The authors declare no conflict of interest.
References
- 1) Seitavuopio P., Heinämäki J., Rantanen J., Yliruusi J., AAPS PharmSciTech, 7, E1–E6 (2006).
- 2) Matsumoto R., Kawakami K., Aoki S., Int. J. Pharm., 341, 44–49 (2007).
- 3) Tolia G., Li S. K., Eur. J. Pharm. Biopharm., 82, 518–525 (2012).
- 4) Momose W., Yoshino H., Katakawa Y., Yamashita K., Imai K., Sako K., Kato E., Irisawa A., Yonemochi E., Terada K., Results Pharma Sci., 2, 29–37 (2012).
- 5) Imamura M., Nishina S., Irisawa A., Yamashita T., Kato E., Proceedings of the IEEE International Conference on IR. MMW. THz. waves. Rome, Italy (2010).