Notes
Reaction of Thymidine with Hypobromous Acid in Phosphate Buffer
2016 年 64 巻 8 号 p. 1235-1238
詳細
2016 年 64 巻 8 号 p. 1235-1238
When thymidine was treated with hypobromous acid (HOBr) in 100 mM phosphate buffer at pH 7.2, two major product peaks appeared in the HPLC chromatogram. The products in each peak were identified by NMR and MS as two isomers of 5-hydroxy-5,6-dihydrothymidine-6-phosphate (a novel compound) and two isomers of 5,6-dihydroxy-5,6-dihydrothymidine (thymidine glycol) with comparable yields. 5-Hydroxy-5,6-dihydrothymidine-6-phosphate was relatively stable, and decomposed with a half-life of 32 h at pH 7.2 and 37°C generating thymidine glycol. The results suggest that 5-hydroxy-5,6-dihydrothymidine-6-phosphate in addition to thymidine glycol may have importance for mutagenesis by the reaction of HOBr with thymine residues in nucleotides and DNA.
Hypobromous acid (HOBr) is a weak acid with a pKa of 8.6.1,2) Bromine (Br2) in water exists in an equilibrium with HOBr, H+, and Br−.3) Bromide-free HOBr is prepared from bromine water by the addition of silver nitrate and subsequent distillation.4) Eosinophil peroxidase (EPO), the predominant component of eosinophil granulocytes, generates HOBr from H2O2 and Br− in the presence of a plasma concentration of Cl− in humans.5,6) EPO plays an important role in defense mechanisms against parasites using HOBr. Meanwhile, myeloperoxidase (MPO), the most abundant protein in monocytes and neutrophils, generates hypochlorous acid (HOCl) from H2O2 and Cl−.7,8) The formed HOCl also plays a critical role in host defense mechanisms. It has been reported that an MPO/H2O2/Cl− system in the presence of Br− also generates HOBr by the reaction of formed HOCl with Br−.9) HOBr is a powerful electrophile rather than a powerful oxidant.10) While the redox potential of HOBr is lower than that of HOCl, HOBr reacts with amino acids faster than HOCl. Especially, ring halogenation of tyrosine by HOBr is 5000 times faster than that by HOCl.11) HOBr also reacts with nucleobases in nucleosides and DNA. 2′-Deoxycytidine generated 5-bromo-2′-deoxycytidine by an EPO/H2O2/Br− system and an MPO/H2O2/Cl−/Br− system.12,13) Adenine in double-stranded DNA resulted in 8-bromoadenine by an EPO/H2O2/Br− system.14) Guanine in a nucleoside, 3′,5′-di-O-acetyl-2′-deoxyguansoine, resulted in 8-bromoguanine and various oxidized compounds by reagent HOBr, an EPO/H2O2/Br− system, and an MPO/H2O2/Cl−/Br− system.15) For thymidine (Thd), bromine water generated 5,6-dihydroxy-5,6-dihydrothymidine (thymidine glycol, TG).16,17) TG is a common oxidative product of Thd with ionizing radiation and various oxidants including permanganate and HOCl.18–20) TG exists as four stereoisomers, cis-5R,6S, cis-5S,6R, trans-5R,6R, and trans-5S,6S. Two diastereomeric pairs (cis-5R,6S/trans-5R,6R and cis-5S,6R/trans-5S,6S) are in an equilibrium in water. In both the epimerization equilibriums, the cis forms are predominant (87 : 13 for cis-5R,6S : trans-5R,6R, 80 : 20 for cis-5S,6R : trans-5S,6S) in a neutral solution (pH 7.4).21) In the present study, we investigated the reaction of Thd with reagent HOBr in phosphate buffer and report the formation of a novel product in addition to TG.
A solution of 1 mM Thd was incubated with 1 mM HOBr in 100 mM potassium phosphate buffer (pH 7.2) at 37°C for 30 min. The reaction was monitored by reversed phase high performance liquid chromatography (RP-HPLC) with detection at 230 nm. Thd was consumed greatly and several product peaks were observed in the RP-HPLC chromatogram (Fig. 1). A peak (termed Peak 1) at an HPLC retention time of 3.7 min showed a UV spectrum with λmax=215 nm in the online detected UV spectrum. Peak 1 was isolated and subjected to electrospray ionization time of flight mass spectrometry (ESI-TOF/MS) and NMR measurements. Peak 1 showed an ESI-TOF/MS spectrum with m/z=257 and 355 in the negative mode (Fig. 2A). High-resolution (HR)-ESI-TOF/MS of the molecular ion showed m/z=355.055257, which agreed with the theoretical molecular mass for C10H15N2O10P composition within 2 ppm. The NMR measurements showed that Peak 1 included two compounds with an abundance ratio of 2.6 : 1 (compound 1-1 : compound 1-2). 1H-NMR showed a doublet signal at 5.19 or 5.11 ppm (J=7 Hz both) and a singlet methyl proton signal in addition to seven aliphatic deoxyribose proton signals for each compound. No aromatic proton signal was observed. It has been reported that the 1H–31P coupling constant via three bond (3JHP) of H–C–O–P of triethyl phosphate (C2H5)3PO4 is 8.5 Hz.22) In 1H–31P HMQC of the Peak 1 product, a correlation between the proton at 5.19 or 5.11 ppm and a phosphorous atom was observed. 13C-NMR showed two aliphatic carbons, two carbonyl carbons, and a methyl carbon in addition to five aliphatic deoxyribose carbons for each compound. Combining these data, the products were identified as two stereoisomers of a Thd derivative which was added by a phosphate group at the 6 position and by a hydroxyl group at the 5 position. This was 5-hydroxy-5,6-dihydrothymidine-6-phosphate (HTP), a novel compound. The structures of the products are shown in Fig. 2B. Peak 1 includes two stereoisomers of HTP out of possible four stereoisomers. Peak 2 at a retention time of 6.0 min showed a UV spectrum with λmax=214 nm. Isolated Peak 2 showed an ESI-TOF/MS spectrum with m/z=275 in the negative mode. HR-ESI-TOF/MS (negative) of the molecular ion of Peak 2 agreed with the theoretical molecular mass for C10H15N2O7 composition within 2 ppm. The 1H-NMR measurements showed that Peak 2 included two compounds with an abundance ratio of 2.7 : 1 (compound 2-1 : compound 2-2). 1H-NMR showed a singlet aliphatic proton signal at 4.71 ppm and a methyl proton signal in addition to seven aliphatic deoxyribose proton signals for each compound. No aromatic proton signal was observed. Combining these data, the products were identified as two stereoisomers of 5,6-dihydroxy-5,6-dihydrothymidine (thymidine glycol, TG). Both Peaks 3 and 4 at retention times of 4.2 and 4.6 min, respectively, showed UV spectra with λmax=213 nm and MS spectra with m/z=275 similar to those of Peak 2. HR-ESI-TOF/MS (negative) of the molecular ions of Peaks 3 and 4 agreed with the theoretical molecular mass for C10H15N2O7 composition within 2 ppm. Thus, the products in Peaks 3 and 4 were also identified as stereoisomers of TG. Under the reaction conditions, the concentrations of the products were 410±18 µM for HTP (Peak 1), 421±14 µM for TG (Peak 2), 47±1 µM for TG (Peak 3), and 15±1 µM for TG (Peak 4) with 33±5 µM of unreacted Thd.

A solution of 1 mM Thd and 1 mM HOBr were incubated in 100 mM potassium phosphate buffer at pH 7.2 and 37°C for 30 min. The HPLC system consisted of LC-10ADvp pumps and an SPD-M10Avp UV-Vis photodiode-array detector (Shimadzu). For the RP-HPLC, an Inertsil ODS-3 octadecylsilane column of 4.6×250 mm and particle size 5 µm (GL Sciences) was used. The eluent was 20 mM ammonium acetate (pH 7.0) containing 4% methanol. The column temperature was 40°C and the flow rate was 1 mL/min.

Figure 3A shows the HOBr dose-dependent changes in concentrations of HTP, TG, and Thd, when 1 mM Thd and 0–1 mM HOBr were incubated in 100 mM potassium phosphate buffer at pH 7.2 and 37°C for 30 min. The concentrations of HTP and TG increased with increasing HOBr dose with comparable concentration. Figure 3B shows the phosphate dose-dependent changes in concentrations of HTP, TG, and Thd, when 1 mM Thd and 1 mM HOBr were incubated in 5–100 mM potassium phosphate buffer at pH 7.2 and 37°C for 30 min. With decreasing phosphate concentration, the concentration of HTP decreased and the concentrations of TG increased. At 5 mM phosphate, about a half of HTP was still produced compared to at 100 mM phosphate. Figure 3C shows the time dependent changes in concentrations of HTP, TG, and Thd, when 1 mM Thd and 1 mM HOBr were incubated in 100 mM potassium phosphate buffer at pH 7.2 and 37°C up to 96 h. The concentration of HTP decreased with increasing incubation time and the concentration of TG increased. The half-life of HTP estimated by the time dependent decrease of the HTP concentration was 32 h.
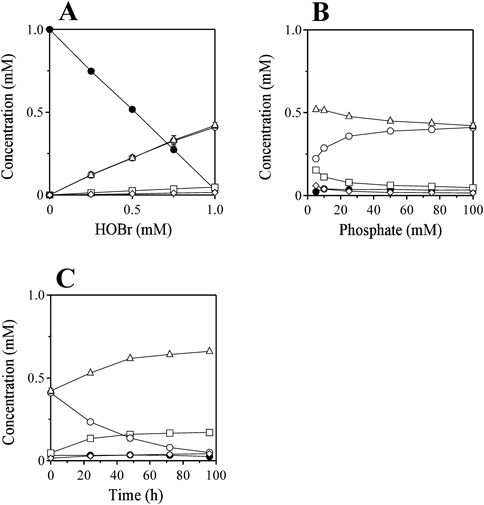
HTP (Peak 1) (open circle), TG (Peak 2) (open triangle), TG (Peak 3) (open rhombus), TG (Peak 4) (open square), and Thd (closed circle). The concentration was determined by RP-HPLC analysis detected at 230 nm. Data are the mean±S.D. (n=3) are presented.
It has been reported that HOBr reacts with Thd, resulting in TG. The reaction mechanism via bromohydrin and epoxide was proposed as follows: Thd generates trans-5R,6R- and trans-5S,6S-5-bromo-6-dihydroxy-5,6-dihydrothymidine (trans-thymidine bromohydrins) by addition of bromine to an aqueous solution of Thd.21) While the bromohydrins are stable under mildly acidic conditions, they are converted to TG in a neutral solution. In general, epoxide is generated from bromohydrin upon treatment with a base.23) It is also proposed that an epoxide is an intermediate in the formation of TG from thymidine bromohydrin.24,25) In the present study, the reaction would occur via bromohydrin and epoxide. The epoxide of Thd, which is generated from thymidine bromohydrin, would react with phosphate resulting in HTP, while the reaction of the epoxide with water forms TG. The possible reaction pathways are summarized in Chart 1.

dR denotes 2-deoxyribose.
The concentration of inorganic phosphate in human serum is relatively low and the reference interval is from 0.81 to 1.45 mM for adults.26) The intracellular concentration of inorganic phosphate is 100-fold greater than that in the plasma.27,28) In cells, most of phosphate is either complexed or bound to proteins and lipids. The concentration of intracellular inorganic phosphate of mammalian muscle is around 5 mM in resting periods. This concentration increases rapidly up to 30 mM during intense fatigue.29,30) The intracellular concentration of phosphate would be sufficient to generate HTP from Thd by HOBr (Fig. 2B). HTP was relatively stable under physiological conditions (Fig. 3C). If HTP were formed in nucleotides and DNA in cells, it would remain for a certain period as HTP before converted to TG. While TG in DNA can be repaired by several repair enzymes, mainly via the base excision repair pathway,31) there is no information for repair of HTP in DNA. The HTP formed in nucleotides and DNA may contribute to mutation.
The present results show that a relatively stable phosphate adduct of Thd is generated by HOBr in addition to TG in the presence of phosphate under neutral conditions. Further studies would be needed in order to elucidate the genotoxicity of the phosphate adduct.
Thd was purchased from Sigma-Aldrich (MO, U.S.A.). Bromide-free HOBr was prepared from bromine water as previously reported.4,13) The concentration of HOBr was determined spectrophotometrically at 331 nm in 10 mM NaOH using a molar extinction coefficient of 315 M−1 cm−1.13) Water was purified with a Millipore Milli-Q deionizer.
HPLC and MS ConditionsThe HPLC system consisted of LC-10ADvp pumps and an SPD-M10Avp UV-Vis photodiode-array detector (Shimadzu, Kyoto, Japan). For the RP-HPLC, an Inertsil ODS-3 octadecylsilane column of 4.6×250 mm and particle size 5 µm (GL Sciences, Tokyo, Japan) was used. The eluent was 20 mM ammonium acetate (pH 7.0) containing 4% methanol. The column temperature was 40°C and the flow rate was 1 mL/min. The RP-HPLC chromatogram was detected at 230 nm. The ESI-TOF/MS measurements were performed on a MicroTOF spectrometer (Bruker, Bremen, Germany) in negative mode. The sample isolated by RP-HPLC was directly infused into the MS system by a syringe pump without a column.
Spectrometric DataSpectrometric Data of HTP (Peak 1)ESI-TOF/MS (negative mode): m/z 355. HR-ESI-TOF/MS (negative mode): m/z 355.055257 obsd (calcd for C10H15N2O10P 355.054805). UV: λmax=215 nm (pH 7.0). Compound 1-1. 1H-NMR (500 MHz, DMSO-d6): δ (ppm/tetramethylsilane (TMS)) 6.07 (dd, 1H, H-1′), 5.19 (d, J=7 Hz, 1H, H-6), 4.12 (ddd, 1H, H-3′), 3.62 (ddd, 1H, H-4′), 3.52 (m, 1H, H-5′ or 5″), 3.32 (m, 1H, H-5′ or 5″), 2.56 (m, 1H, H-2′ or 2″), 1.82 (m, 1H, H-2′ or 2″), 1.86 (s, 3H, CH3). 13C-NMR (125 MHz, DMSO-d6): δ (ppm/TMS) 174.2 (C-4), 152.0 (C-2), 86.8 (C-4′), 83.1 (C-1′), 81.2 (C-6), 72.8 (C-5), 70.3 (C-3′), 61.2 (C-5′), 38.2 (C-2′), 22.8 (CH3). Compound 1-2. 1H-NMR (500 MHz, DMSO-d6): δ (ppm/TMS) 5.98 (dd, 1H, H-1′), 5.11 (d, J=7 Hz, 1H, H-6), 4.20 (ddd, 1H, H-3′), 3.62 (ddd, 1H, H-4′), 3.48 (m, 1H, H-5′ or 5″), 3.41 (m, 1H, H-5′ or 5″), 1.94 (m, 1H, H-2′ or 2″), 1.77 (m, 1H, H-2′ or 2″), 1.86 (s, 3H, CH3). 13C-NMR (125 MHz, DMSO-d6): δ (ppm/TMS) 173.3 (C-4), 151.4 (C-2), 85.9 (C-4′), 83.1 (C-1′), 80.6 (C-6), 72.5 (C-5), 70.7 (C-3′), 61.8 (C-5′), 35.4 (C-2′), 23.5 (CH3).
Spectrometric Data of TG (Peak 2)ESI-TOF/MS (negative mode): m/z 275. HR-ESI-TOF/MS (negative mode): m/z 275.088747 obsd (calcd for C10H15N2O7 275.088474). UV: λmax=214 nm (pH 7.0). Compound 2-1. 1H-NMR (500 MHz, DMSO-d6): δ (ppm/TMS) 6.03 (dd, 1H, H-1′), 4.71 (s, 1H, H-6), 4.18 (m, 1H, H-3′), 3.57 (ddd, 1H, H-4′), 3.50–3.41 (m, 2H, H-5′ and 5″), 2.05 (m, 1H, H-2′ or 2″), 1.96 (m, 1H, H-2′ or 2″), 1.86 (s, 3H, CH3). Compound 2-2. 1H-NMR (500 MHz, DMSO-d6): δ (ppm/TMS) 6.00 (dd, 1H, H-1′), 4.71 (s, 1H, H-6), 4.16 (m, 1H, H-3′), 3.59 (ddd, 1H, H-4′), 3.50–3.41 (m, 2H, H-5′ and 5″), 2.18 (m, 1H, H-2′ or 2″), 1.92 (m, 1H, H-2′ or 2″), 1.86 (s, 3H, CH3).
Spectrometric Data of TG (Peak 3)ESI-TOF/MS (negative mode): m/z 275. HR-ESI-TOF/MS (negative mode): m/z 275.088675 obsd (calcd for C10H15N2O7 275.088474). UV: λmax=213 nm (pH 7.0).
Spectrometric Data of TG (Peak 4)ESI-TOF/MS (negative mode): m/z 275. HR-ESI-TOF/MS (negative mode): m/z 275.088729 obsd (calcd for C10H15N2O7 275.088474). UV: λmax=213 nm (pH 7.0).
Quantitative ProceduresThe concentrations of the products were evaluated from integrated peak areas on RP-HPLC chromatograms detected at 230 nm and the molecular extinction coefficients at 230 nm (ε230 nm). The ε230 nm values of HTP (Peak 1) and TG (Peak 2) were determined from integration of the H-3′ proton signals of NMR and the HPLC peak area detected at 230 nm relative to those of Thd (ε230 nm=2650 M−1 cm−1) in the mixed solution. The estimated ε230 nm values were 1020 M−1 cm−1 for HTP (Peak 1) and 1150 M−1 cm−1 for TG (Peak 2). The ε230 nm value of 1150 M−1 cm−1 was also used for TG (Peak 3) and TG (Peak 4).
The authors declare no conflict of interest.