Abstract
A vaginal suppository containing ulinastatin (UTI) was developed as a hospital pharmacy product from UTI injection solution and Witepsol® S-55. After mixing at 50°C for 0–8 h, UTI suppositories were prepared, which had good UTI content uniformity. Because 2% surfactant was contained in S-55, the UTI injection solution formed a water-in-oil type emulsion as a suppository base. The measured residual moisture content (loss on drying (LOD)) in the prepared vaginal suppositories decreased as the mixing time increased, but their hardness (hardness test (HT)) increased. Near (N) IR spectra of UTI suppositories were measured after mixing for 0–8 h. The best calibration models to predict the HT and LOD of the suppositories were determined based on the NIR spectra by the leave-one-out method in a partial least-squares regression analysis (PLS). The validation result indicated that PLS models for HT and LOD were obtained based on the spectra treated by a combination of smoothing and normalized, respectively, and the model consisted of three latent variables. The plots between the predicted and measured pharmaceutical properties (HT and LOD) based on the calibration data were superimposed with those of the external validation data. The developed NIR spectroscopy method was applied to the preparation process monitoring for UTI vaginal suppositories. In the prepared vaginal suppositories, the predicted LOD decreased as the mixing time increased, and the measured LOD values superimposed well with the predicted values. In contrast, the predicted HT increased as the mixing time increased, and the measured values superimposed with the predicted values.
It is essential to supply a wide variety of medicines to respond to diverse medical needs in hospitals, but it is often difficult to do so with commercially available medicines in all situations. Hospital formulations, which are mainly supplied in the hospital department, have been prepared by pharmacists to respond to these diverse and individual medical needs, and they contribute to advance medical care.1–5) From the preparation and use of in-hospital preparations, subsequent development by pharmaceutical companies, followed by approval by the Pharmaceutical Affairs Law, has led to many formulations becoming commercial products, indicating why in-hospital formulations are spreading as clinical treatment methods. However, as manufacturing and quality control of pharmaceutical preparations have become more important in recent years, attention has also focused on the scientific rationale of quality control even of in-hospital formulations.6–8) To monitor and control product quality during manufacturing in the pharmaceutical industry, the real-time release concept has been encouraged by the Food and Drug Administration as a process analytical technology (PAT).9–11) Using near (N) IR spectroscopy, data can be collected efficiently from intact samples without sample preparation.12) Consequently, NIR spectroscopy involving multivariate analysis is rapidly becoming an important analytical technique for PAT in the pharmaceutical industry.13)
Ulinastatin (UTI) has been found to be effective and safe in the treatment of acute pancreatitis.14–16) In addition, it has been reported that UTI, as a component contained in amniotic fluid in large amounts, suppresses inflammation around the uterine cervix and also suppresses uterine contraction. The administration of UTI into the vagina using a suppository was effective for the treatment of threatened premature delivery.17–19) Therefore, in Japan, UTI vaginal suppositories have been used as an in-hospital formulation as part of the medical institution's responsibility, under the authority of medical law, and to administer it to patients.20–22) In a previous study, high-quality vaginal suppositories containing UTI could be obtained using UTI injection solution and Witepsol® S-55 as hospital pharmacy product. Because the hardness of vaginal suppositories including UTI was affected by the remaining moisture level, the quality of the suppository depended on it.23)
On the other hand, Otsuka et al.24) reported that a method of monitoring bulk drug content in suppositories was established to prepare high-quality suppositories using NIR spectroscopy. As part of a study to reduce the fluctuation in bioavailability of acetaminophen delivered via suppositories we applied NIR spectroscopy with chemometrics to measure total drug contents and particle size in bulk drug powder in a suppository. These results of the NIR analysis suggested the possibility of establishing a non-destructive, rapid, and efficient analytical method to guarantee the quality of suppositories as hospital preparations using this NIR method. Therefore, in the present study, NIR and chemometrics were applied for evaluating UTI suppositories whose formulation properties such as hardness (hardness test (HT)) fluctuated due to fluctuation in the water content of the product.
Experimental
ReagentsCommercially available UTI injection solution (100,000 units/mL, 2.0 mL, Miraclid®; Mochida Pharmaceutical Co., Ltd., Tokyo, Japan.) was used in this research. Witepsol® S-55 was purchased from IOI Oleo GmbH (Witten, Germany). Trypsin derived from bovine pancreas for biochemical tests and triethanolamine were purchased from Wako Pure Chemical Industries, Ltd. (Osaka, Japan). Benzoyl-L-arginine p-nitroanilide monohydrochloride was purchased from Peptide Institute, Inc. (Osaka, Japan).
Preparation of UTI-Containing Vaginal Suppositories Using UTI Injection SolutionWitepsol® (S-55, 133 g) was melted in a beaker on a hot stirrer and then sonicated and mixed at 50°C. Twenty milliliters of UTI injection solution (10 ampules of UTI injection, 2.0 mL) was added to the beaker containing S-55, and the mixture was sonicated at 50°C again. To extract water from the injection solution in Witepsol® mixtures, the mixtures were stirred for 0.5, 1.0, 2.0, 2.5, 4.0, 5.0, 6.0, and 8.0 h at 50°C in an ultrasonic wave cleaner. The resulting UTI and S-55 suspension was dispensed and solidified overnight. The melted mixture was poured into a plastic mold comprised of polyvinyl chloride (volume of the container, 1.4 mL, Nichiihousou Co., Ltd., Hyogo, Japan) and then cooled to room temperature, as shown in Fig. 1. The average weight of the UTI suppositories was 1.33 g. A total of 800 suppository samples (100 samples per each of the 8 heating times) were prepared.
Measurement of Moisture Content in Prepared Vaginal Suppositories by Loss on DryingThe moisture contents of various vaginal suppositories were measured by the loss on drying method.25) The various vaginal suppository samples (approximately 1.33 g) were transferred onto an aluminum paper-covered hotplate and then dried at 105°C until a constant weight was obtained (Fig. 2). The residual moisture content (loss on drying (LOD)) was determined as the ratio of weight of moisture loss to weight of each sample expressed as a percentage.
Hardness TestThe HT of five suppositories was determined using a modified load cell hardness tester (PC-30 Portable Checker, Okada Seiko. Co., Ltd., Tokyo, Japan). As shown in Fig. 1(D), a 5-mm diameter plastic cylinder was installed and fixed at 20-mm intervals in the load cell hardness tester. Plastic cylinder and suppository were installed at the same position and increasing the pressure were placed on it until it lost its structure and collapsed (Fig. 1(D)).
NIR MeasurementNIR spectra were collected using a diffused reflectance probe with an NIR spectrometer (MPA, Bruker Optics, Ettlingen, Germany), as follows: a total of 24 suppository samples (3 samples each for 8 drug concentrations) were selected at random as the calibration model sample set, and another 24 suppository samples, also selected at random, were used as a validation model sample set. NIR spectra of the suppository samples were measured from outside the plastic container using a fiber-optic probe, and 32 scans per sample were recorded in the spectral range 4250–8500 cm−1. NIR spectra were recorded six times with the site of the measurement changed each time. The suppositories contained 10000 units of UTI, but the spectra were not significantly different visibly from those of the samples without the drug. Next, the sample suppositories from the different heating times were measured directly using the probe in the same manner as the suppository samples.
NIR Data ProcessingA total of 288 suppository sample spectra were measured by NIR spectroscopy. From these spectra, 144 suppository sample spectra were selected and used to establish a calibration model by partial-least squares regression analysis (PLS). Several spectral pre-treatment methods12,13) were applied including smoothing (SM), area normalization (NOR), first derivative (1st), secondary derivative (2nd), multiplicative scatter correction (MSC), and standard normal variate (SNV). The other 144 spectra of the suppository sample sets were used as an external validation set to evaluate the calibration model. PLS analysis was performed using Pirouette software Ver. 4.5 (Infometrix Co., Woodenville WA, U.S.A.). The best calibration models were determined to minimize the standard error of cross-validation (SECV) by the leave-out-one method in the PLS software. When cross-validation was applied during PLS, a regression model for a validation sample xv was evaluated based on the k factor regression vector βk.12,13)
 | (1) |
and generates the prediction residual:
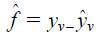 | (2) |
where
yv is the “true” value for the dependent variable of the validation sample. To keep the notation simple, hatted symbols (
e.g.) indicate a
k factor estimate of a quantity. For a set of
nv validation samples, a Prediction Residual Error Sum of Squares (PRESS) can be calculated for the
y block:
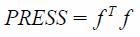 | (3) |
Related to the PRESS is the Standard Error of Prediction (SEP), which takes into account the number of samples and has the same units as the y variable.12,13) The SEP must be corrected for the number of factors k in the model:
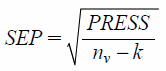 | (4) |
The results were expressed as mean±standard deviation. One-way ANOVA models were used to compare expression levels with Tukey’s multiple comparisons test as a post hoc analysis for HT. Differences were considered significant at * p<0.05. The effect of mixing time on LOD of vaginal suppositories using S-55 was compared using independent sample t-test with the significance level set at * p<0.05.
Results
Characterization of UTI Vaginal Suppositories as Hospital ProductsCharacterization of UTI vaginal suppositories as hospital products was performed with UTI suppositories prepared by pouring of a molten mixture containing UTI injection solution and Witepsol® S-55 into a plastic mold. The obtained UTI suppositories based on S-55 had a smooth appearance. Because 2% surfactant was contained in S-55, the UTI injection solution formed a water-in-oil type emulsion in the suppository base. The measured LOD in the prepared vaginal suppositories decreased as the mixing time increased. Therefore, the measured HT of the suppositories also increased as the mixing time increased. This HT result was affected by the decreasing porosity of the vaginal suppositories, as reported previously.23)
Effect of Mixing Time on NIR Spectra of UTI SuppositoriesFigure 3 shows NIR spectra of UTI suppositories obtained after mixing for 0–8 h. The peaks at 5000–5230 and 6700–7200 cm−1 decreased with increasing heat-mixing time, respectively. The peak assignments26) at 5000–5230 and 6700–7200 cm−1 were due to the stretching vibration of O–H and the first overtone of the stretching vibration of O–H of free water in the micelles, respectively. In contrast, the peaks at 4319, 5658, 5801, and 8202 cm−1 increased with increasing heat-mixing time during dehydration, and these baseline and absorption peaks shifted and increased with increasing mixing time. Therefore, these peaks were attributed to the suppository base, and it has been reported that the peak assignments26) at 4319, 5658, 5801, and 8202 cm−1 were the first overtone of the stretching vibration of CH2, the first overtone of the stretching vibration of CH3, the deformation of CH, and the first overtone of the stretching vibration of CH2, respectively. This absorption change in NIR spectra was in agreement with an earlier report that the LODs in the suppositories decreased with increasing mixing time.23)
Construction of Calibration Models to Evaluate LOD and HT Based on NIR Spectra of UTI SuppositoriesAfter the NIR spectra for the calibration data set were treated using various pretreatment functions, the best calibration models to predict the LOD and HT of the suppository were determined to minimize the SECV by the leave-one-out method in the PLS. The result of the cumulative percent variance (CPV), PRESS (PRESS Cal and PRESS Val), and r-values (r-Cal and r-Val) for the calibration and cross-validation to predict LOD-c and HT-c are summarized in Table 1. The PLS calibration models to predict LOD-c and HT-c were obtained based on the spectra treated with various pretreatments, and the r-Cal and the r-Val indicated the validity of the models, respectively.
Table 1. Chemometric Parameters of the PLS Calibration Models to Predict LOD and HT of the UTI-Containing Vaginal Suppositories
| LOD | LV | CV | SEV | Press Val | r-Val | SEC | Press Cal | r-Cal |
|---|
| MSC+NOR | 3 | 96.0 | 0.378 | 2.06E+01 | 0.994 | 0.369 | 1.91E+01 | 0.995 |
| SM+1st | 4 | 88.5 | 0.322 | 1.49E+01 | 0.996 | 0.300 | 1.25E+01 | 0.996 |
| SM+2nd | 2 | 50.2 | 0.314 | 1.42E+01 | 0.996 | 0.265 | 9.87E+00 | 0.997 |
| SM+MSC | 3 | 96.5 | 0.492 | 3.49E+01 | 0.990 | 0.480 | 3.22E+01 | 0.991 |
| SM+NOR | 3 | 94.3 | 0.500 | 3.60E+01 | 0.990 | 0.469 | 3.07E+01 | 0.991 |
| SM+SNV | 3 | 96.2 | 0.490 | 3.45E+01 | 0.990 | 0.476 | 3.18E+01 | 0.991 |
| HT | LV | CV | SEV | Press Val | r-Val | SEC | Press Cal | r-Cal |
|---|
| MSC+NOR | 3 | 95.3 | 2.938 | 1.24E+03 | 0.975 | 2.903 | 1.18E+03 | 0.977 |
| SM+1st | 4 | 85.9 | 2.211 | 7.04E+02 | 0.986 | 2.038 | 5.77E+02 | 0.989 |
| SM+2nd | 2 | 44.5 | 1.942 | 5.43E+02 | 0.989 | 1.810 | 4.62E+02 | 0.991 |
| SM+MSC | 3 | 95.8 | 3.614 | 1.88E+03 | 0.962 | 3.568 | 1.78E+03 | 0.964 |
| SM+NOR | 3 | 93.8 | 3.746 | 2.02E+03 | 0.960 | 3.626 | 1.84E+03 | 0.963 |
| SM+SNV | 3 | 95.4 | 3.692 | 1.96E+03 | 0.961 | 3.641 | 1.86E+03 | 0.963 |
In order to validate the calibration models to predict LOD-e and HT-e in the suppository, the external NIR spectra were evaluated in each calibration model, and the validation results are shown in Table 2. The chemometric parameters of the PLS calibration models based on external validation data sets indicated that the best calibration models to predict LOD-e and HT-e were based on SM+NOR treated NIR data, respectively.
Table 2. Validation Result of the PLS Calibration Models to Predict LOD and HT of the UTI-Containing Vaginal Suppositories
| LOD | MSC+NOR | SM+1st | SM+2nd | SM+MSC | SM+NOR | SM+SNV |
|---|
| SEP | 1.710 | 1.308 | 1.543 | 1.701 | 1.165 | 1.447 |
| PRESS | 4.21E+02 | 2.46E+02 | 3.43E+02 | 4.16E+02 | 1.95E+02 | 3.01E+02 |
| r | 0.9006 | 0.9304 | 0.9027 | 0.8986 | 0.9477 | 0.9235 |
| Factors | 3 | 4 | 2 | 3 | 3 | 3 |
| Slope | 1.005 | 0.911 | 0.886 | 0.986 | 0.965 | 0.980 |
| Intercept | 0.0755 | 0.3884 | 0.4291 | 0.1657 | 0.2827 | 0.2332 |
| ModelESS | 1.63E+01 | 1.70E−03 | 1.35E−04 | 5.60E−01 | 4.52E+01 | 1.84E+01 |
| HT | MSC+NOR | SM+1st | SM+2nd | SM+MSC | SM+NOR | SM+SNV |
|---|
| SEP | 9.035 | 7.655 | 7.471 | 7.920 | 5.913 | 6.747 |
| PRESS | 1.18E+04 | 8.44E+03 | 8.04E+02 | 9.03E+03 | 5.03E+03 | 6.55E+03 |
| r | 0.8592 | 0.8331 | 0.8330 | 0.8749 | 0.9106 | 0.8984 |
| Factors | 3 | 4 | 2 | 3 | 3 | 3 |
| Slope | 1.123 | 0.816 | 0.776 | 1.066 | 0.979 | 1.035 |
| Intercept | −5.381 | 7.030 | 9.828 | −2.250 | 0.859 | −1.285 |
| ModelESS | 1.72E+01 | 1.71E−03 | 1.35E−04 | 5.91E−01 | 4.40E+01 | 1.98E+01 |
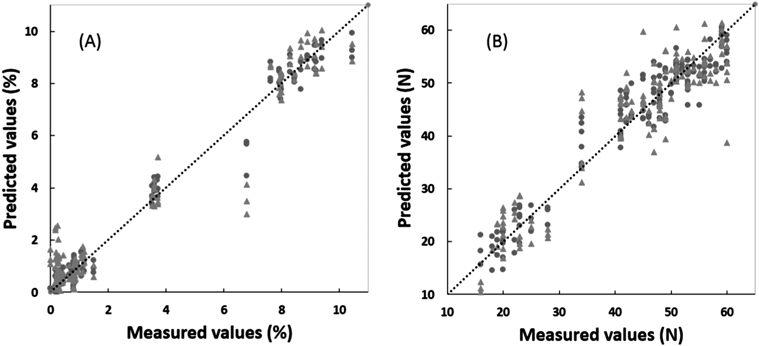
Figure 4 shows the relationships between the predicted and measured pharmaceutical properties (LOD and HT) of the suppositories in the best calibration models by the SM+NOR. The plots for the predicted and measured LOD data of the calibration and external validation data sets gave a straight line with r-Cal=0.9914 and r-Val=0.9477, respectively, with the slopes being close to 1, as shown in Table 2. The predicted LOD-c based on the calibration NIR data was superimposed with the LOD-e based on the external validated data. For HT, the calibration and external validation data sets gave straight lines with r-Cal=0.9631 and r-Val=0.9106, respectively. The predicted HT-e values based on calibration NIR data almost overlapped with the predicted values based on the external validation data, thereby demonstrating the scientific validity of this calibration model. The validation results indicated that the PLS models for HT and LOD were obtained based on the spectra treated by a combination of SM and NOR, respectively, and the model consisted of three latent variables (LVs).
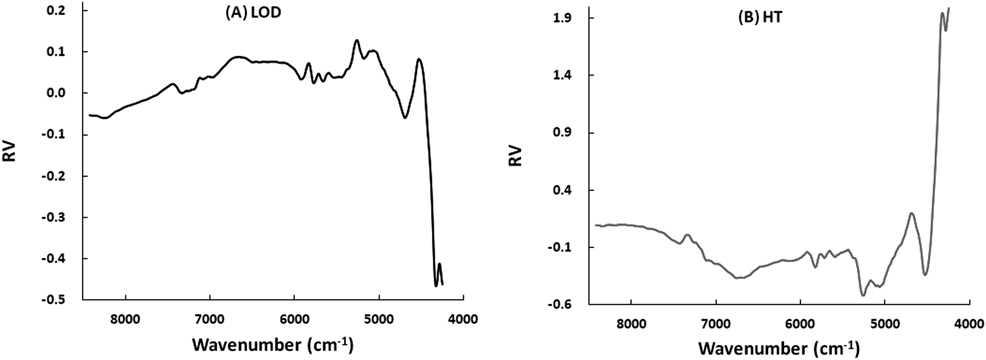
Scientific Evidence of the Calibration Models to Evaluate LOD and HT Based on NIR Spectra of UTI SuppositoriesFigure 5 shows the regression vectors (RVs) for the best fitted calibration models to predict LOD-c and HT-c of the suppositories. In the RVs for the models related to the LOD prediction: the positive broad peaks26) at 4516, 5033, and 5241 cm−1 were due to asymmetric stretching vibration of CH2, deformation of O–H, and the stretching vibration of O–H, respectively. There were negative peaks at 4323, 4697, and 8215 cm−1 due to the stretching vibration of CH2, the stretching vibration of HC=CH, and second overtone of the stretching vibration of CH2, respectively. In contrast, the RV of the calibration models to predict HT had positive peaks26) at 4323, 4697, and 8215 cm−1, and negative broad peaks at 4516, 5033, and 5241 cm−1. The RVs for the HT showed almost the same pattern as that of the LOD, but the top and bottom of the positive and negative peaks were opposite to each other.
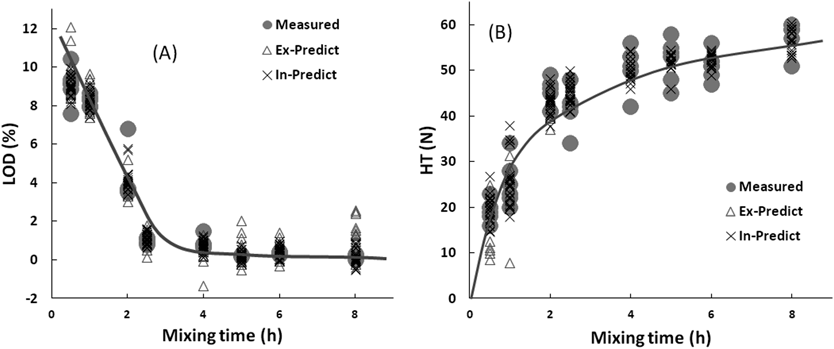
Effect of Heat-Mixing Time on LOD and HT of UTI SuppositoriesFigure 6 shows the predicted pharmaceutical properties (LOD and HT) time profiles of UTI suppositories from the fitted models. The predicted LOD (LOD-c and LOD-e) and HT (HT-c and HT-e) were evaluated based on the cross-validation data and the external-validation data sets, respectively. The predicted LOD-c and LOD-e in the prepared vaginal suppositories decreased with increasing mixing time, and the measured LOD values superimposed with the predicted values. As same as, the predicted HT (HT-c and HT-e) of the suppositories also increased with increasing mixing time, and the measured values were superimposed with the predicted values.
Discussion
Construction of the Calibration Models to Predict LOD and HT Based on NIR Spectra of UTI SuppositoriesSuppositories can be classified as brittle or elastic by evaluating the mechanical force required to break. HT are used that measure the mass (in N or kgf) that a suppository can bear without breaking. The purpose of the tests (LOD and HT) is to verify that the suppository can be transported under normal conditions, and administrated to the patient. According to the reference book,27) a good HT result is at least 17.7–19.6 N.
In order to establish the calibration models to predict various pharmaceutical properties (LOD and HT) of the UTI suppositories, NIR spectra non-destructively measured the UTI suppositories obtained from the suppository base mixtures prepared for various mixing times. The chemometric parameters of the best calibration models to predict LOD-c and HT-c of the suppositories were determined to minimize the SECV by the leave-one-out method in the PLS (Table 1). The chemometric parameters (Table 2) of the PLS calibration models based on external validation data sets indicated that the best calibration models (Fig. 4) to predict LOD-e and HT-e were evaluated based on both SM and NOR treated NIR data, respectively.
The RVs for the best-fitted calibration models (Fig. 5) to predict LOD of the suppository scientifically reflected with dehydration process as chemical evidence. The broad peaks attributable to water decreased with increasing mixing time, but the peaks attributable to the suppository base increased. In contrast (Fig. 5), the RVs for the HT followed almost the same pattern as that of the LOD, but the top and bottom of the positive and negative peaks were the opposite of each other.
Critical Quality Attributes of UTI Vaginal Suppositories during the Preparation Process as Hospital Pharmacy ProductsQuality assurance of products based on scientific evidence is extremely important in the pharmaceutical manufacturing process. However, there have been few reports evaluating the quality of small-scale preparation in hospitals.28) In a previous study, the drug content of vaginal suppositories prepared as hospital pharmacy products by conventional methods fluctuated significantly; therefore, the method of preparing UTI vaginal suppositories was changed to use Witepsol S-55 and UTI injection solution as aqueous active ingredients, and the pharmaceutical quality of the final products was evaluated. Because S-55 contains ethoxylated emulsifier as a surfactant, the UTI injection solution and the base formed a water-in-oil emulsion, and then the formability of the vaginal suppository was enhanced significantly. As reported previously,23) as the mixing time increased, the size of the droplets in the aqueous phase in the oil decreased due to the evaporation of the moisture, and then the porous material in the suppository became interconnected, which affected its mechanical properties. The mechanical strength of vaginal suppositories as porous materials increased with decreasing porosity. However, the LOD and HT of vaginal suppositories were significantly different depending on the mixing time; therefore, the pharmaceutical properties of all suppositories were examined using the developed non-destructive and non-conductive NIR methods. The LOD-c, LOD-e, and measured LOD profiles were superimposed during the heat-mixing process (Fig. 6). All residual LOD of vaginal suppositories using S-55 decreased as the mixing time increased. In contrast, HT-c, HT-e, and measured HT were superimposed in the heat-mixing process (Fig. 6), and HT increased as mixing time increased.
As shown in the present analytical results (Fig. 4), it was shown that the LOD of suppositories is an important critical quality attribute of their preparation process and critically affected product quality (HT of the suppository) of the final preparation. The LOD of suppositories decreased with increasing heating-time at 50°C, but HT increased. The result indicated that LOD and HT were critical quality attributes in the preparation process of UTI vaginal suppositories in a hospital pharmacy. Because the mechanical strength of the suppository was governed by its porosity (volume of water), measurements of LOD and HT were important for maintaining the quality of suppositories during the preparation process, as reported previously.23) Therefore, in this study, we developed a non-destructive, non-contact, and accurate method to evaluate the quality of UTI vaginal suppositories as a hospital pharmacy product using NIR spectroscopy.
Conclusion
We modified the procedure for preparing conventional UTI vaginal suppositories as a hospital pharmacy product and prepared an emulsion type, UTI-containing suppositories with good drug content uniformity in accordance with the Japanese Pharmacopoeia. The HT of the UTI vaginal suppositories changed depending on LOD during mixing. Therefore, in this study, in order to evaluate the quality (LOD and HT) of UTI vaginal suppositories as a hospital pharmacy preparation, a non-destruction and non-contact method was developed based on NIR spectroscopy by chemometrics. Pharmaceutical properties of all of the UTI-containing suppositories could be evaluated individually using the NIR method. It could be beneficial for patients to receive high-quality formulations, in which all products were measured individually using the developed NIR method.
Acknowledgment
This work was supported by Faculty of Pharmacy, Research Institute of Pharmaceutical Sciences, Musashino University, Japan.
Conflict of Interest
The authors declare no conflict of interest.
References
- 1) Japanese Society of Hospital Pharmacists, “Case Studies of Hospital Preparation—Guidelines of Hospital Preparation and Application.” Yakuji Nippo Limited., Japan: (2013): ‹https://books.google.co.jp/books?id=mH1WnwEACAAJ.›
- 2) Pedersen C. A., Schneider P. J., Scheckelhoff D. J., Am. J. Health Syst. Pharm., 63, 327–345 (2006).
- 3) Flynn E. A., Barker K. N., Carnahan B. J., J. Am. Pharm. Assoc., 43, 191–200 (2003).
- 4) Bond C. A., Raehl C. L., Franke T., Pharmacother. J. Hum. Pharmacol. Drug. Ther., 20, 609–621 (2000).
- 5) Myers C. E., History of sterile compounding in U.S. hospitals: Learning from the tragic lessons of the past. Am. J. Heal Pharm., 70(16) 1414 LP-1427 (2013). Available at: ‹http://www.ajhp.org/content/70/16/1414.abstract.›
- 6) Otsuka K., Uchino T., Otsuka M., Drug Dev. Ind. Pharm., 41, 15–21 (2015).
- 7) Kanayama N., Obstet. Gynecol., 4, 459–463 (1995)
- 8) Kanayama N., Chinarong L., Naruse H., Yamamoto N., Fujishiro S., Maehara K., Morita Y., Terao T., Acta Obstet. Gynaec. Jpn., 44, 477–482 (1992).
- 9) “Regulatory Leeway Sought for Process Analytical Technology. The Gold Sheet,” Vol. 36, ed. by Paulson W., Elsevier: Chevy Chase, MD, 2002.
- 10) U.S. Food and Drug Administration Center for Drug Evaluation and Research “Process Analytical Technology (PAT) Initiative.”: ‹http://www.fda.gov/cder/OPS/PAT.htm›
- 11) Higgins J. P., Arrivo S. M., Thurau G., Green R. L., Bowen W., Lange A., Templeton A. C., Thomas D. L., Reed R. A., Anal. Chem., 75, 1777–1785 (2003).
- 12) Siesler H. W., Ozaki Y., Kawano S., Heise H. M., “Near-Infrared Spectroscopy: Principles, Instruments, Applications”, Wiley-VCH, Germany, Weinheim, 2002.
- 13) Martens H., Naes T., “Multivariate Calibration,” John Wiley & Sons, New York, 1989.
- 14) Proksch G. J., Routh J. I., Transl. Res., 79, 491–499 (2017). doi:10.5555/uri:pii:0022214372901102.
- 15) Ohnishi H., Kosuzume H., Ashida Y., Kato K., Suzuki Y., Honjo I., Nihon Yakurigaku Zasshi, 81, 235–244 (1983).
- 16) Fujishiro H., Adachi K., Imaoka T., Hashimoto T., Kohge N., Moriyama N., Suetsugu H., Kawashima K., Komazawa Y., Ishimura N., Ishihara S., Amano Y., Kinoshita Y., J. Gastroenterol. Hepatol., 21, 1065–1069 (2006).
- 17) Kaga N., Katsuki Y., Futamura Y., Obata M., Shibutani Y., Obstet. Gynecol., 88, 872–882 (1996).
- 18) Kaga N., Katsuki Y., Obata M., Shibutani Y., Am. J. Obstet. Gynecol., 174, 754–759 (1996).
- 19) El Maradny E., Kanayama N., Halim A., Maehara K., Terao T., Gynecol. Obstet. Invest., 38, 169–172 (1994).
- 20) Suzuki S., Takaada K., U.S. Patent 5,783,555. 21 Jul. (1998).
- 21) Yarnykh T. G., Tolochko E. V., Chushenko V. N., Pharm. Chem. J., 44, 551–556 (2011).
- 22) Regdon G. Sr., Gombkötö S., Regdon G. Jr., Selmeczi B., Pharm. Acta Helv., 69, 141–148 (1994).
- 23) Kishino T., Inoue Y., Inoue K., Saito K., Kondo M., Otsuka K., Terukina T., Hattori Y., Otsuka M., Journal of Drug Delivery Science and Technology, 44, 1–7 (2008).
- 24) Otsuka E., Abe H., Aburada M., Otsuka M., Drug Dev. Ind. Pharm., 36, 839–844 (2010).
- 25) Ministry of Health and Welfare, “The Japanese pharmacopeia,” 16th ed., pp. 55, 60–61 (2011).
- 26) Iwamoto M., Kawano S., Uozumi J., Introduction of Near Infrared Spectroscopy, SachiSyobou Co, Tokyo, Japan (1994).
- 27) Allen Loyd V., Dennis B., Worthen, Bill Mink. “Suppositories,” Chap. 9 Pharmaceutical Press, London, 2008, p. 146.
- 28) Satake K., Nakajima T., Iwata M., Fujikake Y., Kimura M., Yakugaku Zasshi, 131, 1639–1644 (2011).