Abstract
Gliclazide (GLZ) is a second generation hypoglycemic drug used for the treatment of Type 2 diabetes mellitus. The low solubility of GLZ has been described as the rate limiting step for drug dissolution and absorption, thus a prediction of its in vivo behavior based on a discriminative dissolution test should lead to a relevant in vitro–in vivo correlation (IVIVC). The aim of this study was to develop a dissolution method for GLZ modified-release (MR) tablets using an United States Pharmacopeia (USP) apparatus 3 through its evaluation by an IVIVC analysis. Various dissolution parameters were evaluated to establish an in vitro method for GLZ tablets. The final dissolution conditions, referred to as method 3, utilized a 400 µm mesh and 30 dips per minute over a total period of 10 h that included 1h in HCl media (pH 1.2), 2h in acetate buffer solution (pH 4.5), 1 h in phosphate buffer solution (PBS; pH 5.8), 5h in PBS (pH 6.8) and finally 1h in PBS (pH 7.2). The calculated point-to-point IVIVC (R2=0.9970) was significantly greater than other methods. The robustness of method 3 suggests it could be applied to pharmaceutical equivalence studies and for quality control analyses of GLZ.
Gliclazide (GLZ) is a second-generation hypoglycemic drug widely used for the treatment of non-insulin-dependent diabetes mellitus.1) It acts by stimulating insulin secretion from pancreatic β-cells and increases the sensitivity of these cells to glucose.2,3) Some chemical properties of GLZ are presented in Table 1. The drug is a weakly acidic compound that is highly lipophilic and has been classified as a class II drug with low solubility and high permeability according to the Biopharmaceutical Classification System (BCS).4,5) The pH-dependent solubility of GLZ was suggested to be a relevant factor for its slow absorption in the gastrointestinal tract (GIT).6,7) To improve its availability, modified-release (MR) tablets of the drug were formulated with a hydrophilic matrix to obtain a more consistent and less pH-dependent release profile of the active pharmaceutical ingredient over a 24 h period.8,9) The formulation can be administered before, during or after meals.8,9)
Table 1. Chemical Properties of Gliclazide
45, 46)Dissolution is an important tool to evaluate the quality of dosage forms, to guide drug development and can also be applied to bioequivalence studies.10,11) During the development of a dissolution method, the in vitro parameters such as the presence of surfactants, pH, ionic strength and media volume should be evaluated.12–14) The selection of dissolution apparatus also plays a key role for the establishment of discriminatory dissolution methodologies.15,16) The United States Pharmacopeia (USP) Apparatus 3 (Reciprocating cylinder or BioDis) was specifically designed for dissolution evaluation of MR dosage forms because it can mimic physicochemical and mechanical changes experienced by a MR dosage form in the GIT.17–19) In addition, this apparatus demonstrates superior hydrodynamic controls in comparison to USP apparatuses 1 and 2 and provides numerous options in terms of instrumental parameters, such as composition of the media, pH and agitation rate.20,21)
To describe a relationship between in vitro characteristics of a dosage form and the in vivo response, a predictive mathematical model is used to define the in vitro–in vivo correlation (IVIVC) level.22–24) A level A IVIVC is the highest correlation level that can be achieved and represents a point-to-point relationship between in vitro dissolution and in vivo absorption.22,25,26) This correlation is considered more informative than the other levels of correlation and is useful from a regulatory point of view.24) Because it provides greater similarity to the conditions a particular MR dosage form is exposed to in vivo, the use of a USP apparatus 3 seems more appropriate and has been demonstrated to be promising for the development of biorelevant dissolution methodologies.20)
Considering that the low solubility of GLZ can be the rate limiting step for its dissolution and absorption, a prediction of its in vivo behavior based on a dissolution test using biorelevant media should lead to a more relevant IVIVC.17,27) The literature describes an IVIVC for GLZ-MR tablets using USP apparatus 228) and suggests the possible application of USP apparatus 3 to GLZ MR tablets.29) Here, we have utilized a USP apparatus 3 to evaluate different dissolution parameters to develop a methodology for GLZ MR tablets and, based on IVIVC, we report a dissolution method that demonstrates high correlation with a potential use in further studies on GLZ formulations and quality control. To the best of our knowledge, this is the first report describing a point-to-point IVIVC for GLZ MR tablets using USP apparatus 3.
Experimental
Chemicals and ReagentsA GLZ reference standard (purity 98%) was purchased from Sigma-Aldrich (São Paulo, Brazil). Hydrochloric acid, sodium chloride, sodium hydroxide, monobasic potassium phosphate and ammonium acetate were obtained from Tedia (Rio de Janeiro, Brazil). The GLZ-MR tablets containing 30 mg of GLZ were purchased at a local pharmacy and consisted of the brands Diamicron® MR (bacth no. 3002512, Servier Brazil, Rio de Janeiro, Brazil) and Azukon® MR (bacth no. BM202063, Torrent Pharma, Rio de Janeiro, Brazil). The excipients of Diamicron® MR are dibasic calcium phosphate, hypromellose, magnesium stearate, maltodextrin and silicon dioxide, while Azukon® MR is composed of dibasic calcium phosphate, hypromellose, povidone, magnesium stearate, lactose monohydrate and silicon dioxide. All filtration procedures utilized 0.45 µm polyvinylidene filters (Millex Millipore, São Paulo, Brazil). Water was processed by a Milli-Q water purification system (Millipore, Bedford, MA, U.S.A.). Buffer solutions were prepared as described in USP.19)
Solubility DeterminationSolubility was evaluated by adding an excess amount of GLZ powder (ca. 50 mg) to a beaker with 10 mL of different media using low speed magnetic stirring (50 rpm) for 24h at 37°C. The beaker tops were covered with a sealing film to prevent contamination and evaporation. Samples were filtered, diluted and the concentration determined by UV-Vis spectrophotometer (Vankel, 50, Varian Inc., Palo Alto, CA, U.S.A.) at 230 nm.30) The media evaluated were: HCl (pH 1.2); acetate buffer solution (ABS; pH 4.5); phosphate buffer solution (PBS) at pHs of 5.8, 6.8, 7.2 and 7.4. A five-level calibration curve was prepared for each condition using concentrations of 2.5, 5.0, 10.0, 12.5 and 15.0 µg/mL. All measurements were performed in triplicate.
Dissolution Studies Using USP Apparatuses 1 and 2 (Basket and Paddle)Dissolution studies of the reference product Diamicron® MR 30 mg were performed using a rotating basket (USP apparatus 1; USP1) and rotating paddle (USP apparatus 2; USP2) in a Hanson Research SR6 dissolution tester (Hanson Research Corp., Chatsworth, CA, U.S.A.). The dissolution conditions consisted of 900 mL of media (HCl pH 1.2; PBS pH 6.8 and 7.4) at 37±0.5°C with a rotational speed of 100 rpm over a 10h period. Aliquots of 5 mL were withdrawn using a 10 µm cannula filter at 1, 2, 4, 6 8 and 10 h, volumetrically diluted and assayed for GLZ by UV spectroptometry according to pharmacopoeia.30) A five-level curve was prepared at concentrations of 0.6, 2.5, 7.5, 12.5, 15.0 µg/mL. All measurements were performed in triplicate.
Dissolution Studies Using USP Apparatus 3 (Reciprocating Cylinder)Dissolutions tests of 30-mg GLZ MR tablets (Diamicron® MR, reference product; Azukon® MR) were performed using a reciprocating cylinder apparatus (USP apparatus 3 (USP3); BIODIS Varian, Varian Inc., CA, U.S.A.) at 37±0.5°C in 250 mL of media. Two mesh sizes, 841 µm and 400 µm, for the top and bottom screens were compared. Different agitation conditions of 20, 30 and 40 dips per minute (dpm) were also evaluated. Solutions and pH steps varied over the physiological range of pH 1.2–7.2. The series of buffers consisted of HCl (pH 1.2), ABS (pH 4.5) and PBS (pH 5.8, 6.8 or 7.2). The apparatus was programmed with drain time and hold dip time of 5 s. Aliquots of 5 mL were manually collected every hour over 10 h without media replacement. For sampling, the cylinders were positioned above the dissolution media for 30 s. After collection, samples were filtered (0.45 µm membrane), volumetrically diluted and the percentage of dissolved drug determined as detailed above. The cumulative percentage of GLZ was calculated based on the calibration curve. Experiments were carried out in six replicates and the final condition was applied to the similar formulation of GLZ.
In Vitro–in Vivo CorrelationBioavailability data of GLZ under fasting conditions was obtained from a previously reported pharmacokinetic study.9) The drug absorption was estimated using the numerical deconvolution method from Wagner–Nelson16,25,31) (Eq. 1). This distribution model, with first order absorption and elimination, was employed because it is the most suitable model for one-compartment drugs25) and has been shown to adequately describe the pharmacokinetic profile of gliclazide.3,28)
 | (1) |
Where
Ct is the plasma concentration at the specified time (
t),
Ke is the elimination rate constant.
AUC0→t is the area under the curve from 0 to time t and
AUC0→∞ is the area under the curve from 0 to infinity. The plasma concentration (ng/mL) and fraction absorbed (%) of GLZ MR tablets are presented in
Fig. 1(A). The percentage of drug dissolved
in vitro was obtained from the dissolution results. An IVIVC was performed based on a linear system analysis using Microsoft Office Excel
® 2010 (Microsoft Corporation, Redmond, WA, U.S.A.). The
in vivo and
in vitro data were compared using a point-to-point relationship (1 to 10 h) between the
in vitro dissolution rate and the
in vivo absorption of the drug. The point-to-point IVIVC (level A) was investigated according to published Food and Drug Administration (FDA) guidance.
22)Statistical AnalysisThe cumulative amount of GLZ dissolved in the apparatuses 1, 2 and 3 was calculated taking into account the non-replacement of the medium. The correlation coefficients (R2) were calculated using a mean of linear regression analysis (Microsoft Corporation, Redmond, WA, U.S.A.). Dissolution profiles of GLZ were compared using one-way ANOVA (GraphPad Prism 5.0 Software, GraphPad, La Jolla, CA, U.S.A.). Similarity and difference were evaluated according to p value where a p>0.05 indicated similarity and a p<0.05 represented a statistical difference. Data were further evaluated using difference (f1) and similarity (f2) factors, broadly adopted by regulatory agencies as an indication of the similarity between dissolution profiles.19,22,32) Values outside the specified range of f1=0 to 15 and f2=50 to 100 indicated differences between the dissolution profiles.
Results and Discussion
SolubilityGLZ is classified according to the BCS as a class II drug and its low solubility is considered the limiting step to drug dissolution and absorption.17,27) To define the solubility of GLZ into the range of media chosen to represent the GIT during the development of a dissolution method, the maximum capacity of the different buffers was determined by introducing powdered GLZ at above saturating quantities for 24 h with stirring. Equilibrium was reached under all conditions evaluated. The results (Fig. 2) confirmed the low solubility of the drug in acid media and its general pH-dependent solubility profile as expected from previous reports.5,7) Under the most acidic condition (pH 1.2), the solubility was slightly higher than pH 4.5–5.8 before increasing with the rise in alkalinity to a neutral pH. The range of pH 3.0–4.2 was previously reported as the main solubility-limited range for GLZ,7) from which the solubility gradually increases. In addition, the solubility of this drug is described as the limiting factor for absorption up to pH 6.9.7) The lower solubility in acid medium is generally considered a problem in the design of an immediate-release (IR) dosage form for GLZ because the entire dose should be rapidly released in the upper part of GIT.33) However, the MR tablets of the GLZ were formulated with a hydrophilic matrix to obtain a more consistent and less pH-dependent release.8,9)
Dissolution Studies Using USP Apparatuses 1 and 2To date, a single official dissolution method for GLZ is described for IR tablets in the British Pharmacopoeia.30) The method recommends the use of USP2 at 100 rpm and 900 mL of PBS (pH 7.4). These parameters were initially adapted for testing the MR formulation of GLZ tablets. In a comparison of USP1 and USP2 (Fig. 3A), the dissolution profile of GLZ MR tablets was measured over 10 h. A higher percentage of dissolved drug was consistently observed from the use of the USP2, compared to the USP1, which reached a final level of approximately 95%. The dissolution profile with the USP1 appeared to plateau around 77% (f1=20.93). The difference between apparatuses 1 and 2 is probably related to the interaction of the matrix tablets with basket apparatus. Previous reports on the use of the USP1 for the evaluation of pharmaceutical formulations containing hydrophilic matrices, such as the GLZ MR tablets studied here, indicated that hydration and swelling of the dosage matrix form can clog the retaining basket, which could disrupt the hydrodynamics of dissolution and, thereby, reduce the total percentage of dissolved drug.34,35)
Due to the greater dissolution of GLZ in a USP2 and the dependence of the drug release rate on media composition,5) dissolution profiles were determined in the USP2 for three different media maintaining the other variables (Fig. 3B). The media compositions reflected those most commonly used for discriminatory dissolution methods and represent a biorelevant simulation of the stomach and small intestine conditions, where the majority of absorption of GLZ occurs.17,36) At the initial sampling time point, 1h, the level of dissolution appeared equal for all three media that did not significantly differ through 2 h. It is worth mentioning that a statistically significant greater increase in the percent of dissolved drug was observed in HCl (pH 1.2; ca. 80%) by 4h compared to PBS at pH 6.8 (f1=48.29; f2=37.40) and PBS at pH 7.4 (f1=39.41; f2=39.85). The profiles of dissolved GLZ in PBS at the two different pHs displayed a similar pattern throughout the time course and reached a final percentage slightly less than HCl. Priya and Murthy5) observed the same behavior in their study with GLZ MR tablets and reported that there was no specific correlation between the solubility results and release rate of GLZ in the tested buffers. Thus, it suggests a possible excipient effect on the solubility and dissolution rate of GLZ MR tablets, especially in acidic media. In addition, this observation is in agreement with reports from Harrower8) and Delrat et al.9) that suggested that the dissolution of GLZ MR tablets is controlled by the formulation. This information was an important guide for the composition of the dissolution pH steps in our study.
USP apparatus 2 can present some disadvantages depending on the agitation rate and pharmaceutical formulation, such as the coning phenomenon,35) which was observed in this study. This phenomenon is characterized by a cone-shaped formation at the bottom of the dissolution vessel composed of visible particulates of the pharmaceutical under study caused by the weak agitation capacity of the system. These particles do not dissolve appropriately and may reduce the total percentage of the dosage form dissolution.34,35) Therefore, it was of interest to evaluate other dissolution apparatus for GLZ MR tablets, such as apparatus 3, which was specifically designed for MR dosage forms. Although USP1 and USP2 did not demonstrate the ideal hydrodynamic conditions to reflect in vivo conditions, their use in the evaluation of the different dissolution media was important to our study. It provided an understanding of the dissolution profile of GLZ MR dosage forms that guided our definition of the dissolution media composition, pH steps and time periods in each media to be employed utilizing the USP3 apparatus.
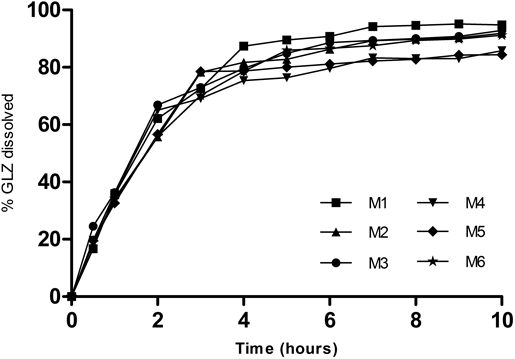
Dissolution Studies Using USP Apparatus 3The choice of dissolution media used in this study was based on the physiological pH range and gastrointestinal transit time.17,36) The goal was to present different gradients of dissolution media using buffered solutions at pH values of 1.2, 4.5, 5.8, 6.8 and 7.2. The time periods in each dissolution media were also varied during method development. As a result, six different time combinations of the dissolution media with different pH steps were evaluated in this study (Methods 1–6; Table 2). Considering the interference from the hydrophilic matrix in the MR tablet, the initial test was to evaluate the influence of the porosity on the mesh that formed the top and the bottom screens using two sizes, 841 and 400 µm. This comparison was conducted across a range of media for the times defined; HCl (pH 1.2; 1 h), ABS pH 4.5 (2 h), PBS pH 5.8 (1 h), PBS pH 6.8 (5 h), and PBS pH 7.2 (1 h). This condition, M1, was applied because it comprises most of the pH values from the physiological range and it was also based on other dissolution media compositions described in the literature.16,37,38) As can be seen in Fig. 4A, differences in the mesh size provided significantly different dissolution profiles (f1>15 and f2<50). The operation of USP3 involves the agitation, in dpm, of the inner tube within the outer tube. A higher total percentage of dissolved drug was obtained using a 400 µm mesh because the disintegrated fragments of the tablets remained within the inner tubes of the reciprocating cylinder and thus allowed their dissolution in the outer tubes of the subsequent rows during the test period. In contrast, the disintegrated fragments of the tablet passed through the 841 µm mesh and accumulated at the bottom of the outer tubes in the first rows. As a consequence, the drug was not completely dissolved during dissolution with 841 a mesh, resulting in a lower total percentage of dissolved drug. We concluded that the 400 µm mesh generated a more accurate reflection of the dissolution profile and was adopted throughout the rest of the dissolution method development.
Table 2. Dissolution Methods with Varied Buffers and Times in a USP Apparatus 3 at 37°C±0.5 with a 400 µm Mesh and 30 dpm
| Method | Time (h) |
|---|
| 1 | 2 | 3 | 4 | 5 | 6 | 7 | 8 | 9 | 10 |
|---|
| 1 | HCl pH 1.2 | AAB pH 4.5 | PBS pH 5.8 | PBS pH 6.8 | PBS pH 7.2 |
| 2 | HCl pH 1.2 | AAB pH 4.5 | PBS pH 5.8 | PBS pH 6.8 | PBS pH 7.2 |
| 3 | HCl pH 1.2 | AAB pH 4.5 | PBS pH 5.8 | PBS pH 6.8 | PBS pH 7.2 |
| 4 | HCl pH 1.2 | AAB pH 4.5 | PBS pH 5.8 | PBS pH 6.8 | PBS pH 7.2 |
| 5 | HCl pH 1.2 | PBS pH 6.8 |
| 6 | HCl pH 1.2 | PBS pH 6.8 |
* Abbreviations: AAB, ammonium acetate buffer; PBS, phosphate buffer solution.
Next, GLZ MR tablets were evaluated using different immersion rates (20, 30 and 40 dpm), as shown in Fig. 4(B). This evaluation was conducted for 1h of dissolution in HCl (pH 1.2) followed by 9h of dissolution at PBS (pH 6.8). This condition was applied according to FDA and USP recommendations for multistage dissolution systems,19,22) in which the dissolution is generally carried out with 1 or 2 h acid step with HCl followed by a basic step with phosphate buffered solution for up to 12 h. In addition, this condition is commonly cited in monographs of MR formulations.19) An increase in dissolved drug, according to the immersion rate, was observed. The immersion rate of 20 dpm presented a lower percentage of drug dissolved at the end of the dissolution and its plateau did not reach 80% of drug dissolved, representing an incomplete dissolution. In addition, the dissolution at 20 dpm was considered statistically different from 30 dpm (f1=20.82; f2=43.21; p>0.001) and 40 dpm (f1=28.90; f2=33.52; p>0.001). In turn, statistical analysis did not show a significant difference between 30 and 40 dpm (f1=10.21; f2=54.98; p>0.05). Both 30 and 40 dpm presented a total percentage of drug dissolved greater than 90%. Although the absolute levels after 2 h were greater for 40 dpm, an immersion rate of 30 dpm was selected for the evaluation of GLZ MR tablets dissolution in USP3 using different media/pHs to provide a milder agitation, which could be more discriminative.39,40)
After determining mesh size and agitation rate, six different time combinations of the dissolution media with different pH steps were evaluated (Methods 1–6; Table 2; (Fig. 5). As previously indicated, these media were selected to represent the physiological pH range and gastrointestinal transit time. The dissolution methods, including either one or two hours in HCl (pH 1.2), resulted in approximately 35% and 58% of GLZ dissolved, respectively. In general, it was observed that the time in HCl (pH 1.2) and AAB (pH 4.5) media determined the final percentage of GLZ dissolved. The consistent difference between these methods was the time duration of the acidic step. M1, M2, M3 and M6 were considered statistically similar (f1 <15; f2> 50; p<0.05). Both M4 and M5 presented a lower percentage of drug dissolved and their dissolution plateau also did not reach 85%. In addition, these two methods were statistically different in comparison to M1 and M3 (p<0.001 and p<0.01, respectively) and were not chosen for further studies. It is also interesting to note that the use of two hours in the acid step during M1 and M2 resulted in the dissolution of almost 80% of drug at the end of the third hour of dissolution. Overall, M1, M2, M3 and M6 appeared appropriate for the evaluation of GLZ MR tablets based on the final percent dissolved and the similarity in the shape of the dissolution curves. Further refinement of the ideal dissolution condition using USP3, however, required a correlation with bioavailability data.
In Vivo–in Vitro CorrelationThe data obtained from the different dissolution apparatuses, their settings, media composition and incubation times were further evaluated to establish an IVIVC for GLZ MR tablets. The fraction absorbed presented in Fig. 1B was compared to the dissolved percentages of GLZ in different media using USP1 (basket) and USP2 (paddle). Using the conventional dissolution apparatuses, the plots of the absorbed fraction showed an R2 <0.95 for both (Table 3). The highest R2 using USP 1 and 2 was observed in HCl (pH 1.2) media at 100 rpm (R2=0.8906), which agrees with previous studies for GLZ with USP2.5,28) All correlation coefficients obtained in our study using USP1 and USP2 were far below the recommended level according to FDA.22) In addition to the observed blockage in the baskets (USP1) and the coning effect with the paddles (USP2) during the dissolution tests, the use of a single dissolution media most likely is not appropriate for the dissolution of MR formulations in vitro when simulating the GIT.11,35) The use of different dissolution media and pH steps are generally more discriminative and better able to mimic in vivo conditions.34,35)
Table 3. IVIVC Values (
R2) of Dissolution Methods Using USP Apparatus 1–3
| USP apparatus | Dissolution media | R2 |
|---|
| 1 | PBS (pH 7.4) | 0.7993 |
| 2 | PBS (pH 7.4) | 0.8339 |
| 2 | HCl (pH 1.2) | 0.8906 |
| 2 | PBS (pH 6.8) | 0.8015 |
| 3 | M1 | 0.9944 |
| 3 | M2 | 0.9907 |
| 3 | M3 | 0.9970 |
| 3 | M4 | 0.9924 |
| 3 | M5 | 0.9907 |
| 3 | M6 | 0.9941 |
Methods 1–6 were presented in Table 2.
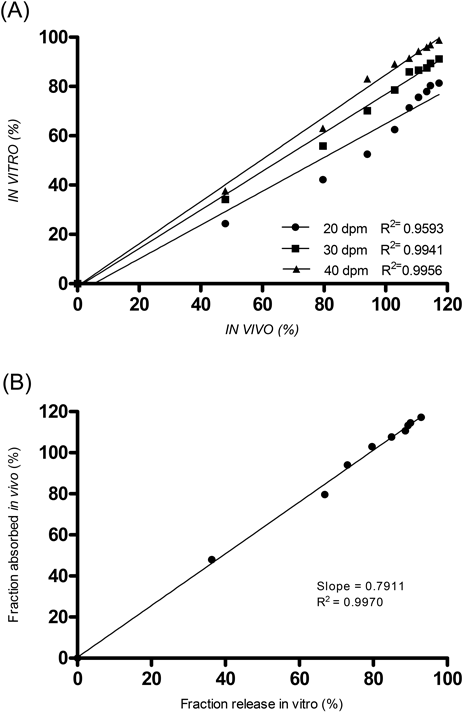
Our focus shifted to employing the USP3 and the effect of the immersion rate on the IVIVC, presented in Fig. 6A, which indicated a high correlation coefficient (R2>0.95) for each of the three rates. As stated previously, an immersion rate of 30 dpm was chosen for further studies to generate the minimum level of physical agitation and a mild dissolution condition. From the plots of the different dissolution methods 1–6 (Table 3), each also exhibited a high correlation for GLZ MR tablets. Ultimately, method 3 presented the highest correlation coefficient (R2=0.9970; Fig. 6B) among all dissolution tests conducted in our study and it was, therefore, selected as our best dissolution condition to establish an IVIVC for GLZ MR tablets.
MR gliclazide tablets has approximately 100% of bioavailability, linear pharmacokinetics and one compartment model,3,28) see Fig. 1A. An increase in plasma concentration is observed during the first 6 h after the oral administration, followed by a plateau from the 6th to the 12th hour.3,9) This same pattern was replicated by our in vitro dissolution studies. An overlap of the in vivo absorbed fraction and in vitro dissolved fraction curves was clearly observed and is reflected by the establishment of a point-to-point IVIVC (level A), indicating that the dissolution test conditions were able to simulate the in vivo performance.24,41–43) The results also demonstrate the ability of USP3 to mimic GIT conditions for MR dosage forms44) and the suitability of this apparatus for the development of in vitro dissolution assays for GLZ MR dosage forms.
Lastly, the dissolution method with the highest IVIVC, using USP3 (Method 3, 30 dpm, 400 µm mesh), was applied to Azukon® MR 30 mg, a similar formulation, to verify the potential of the method for applications in quality control and pharmaceutical equivalence analyses of GLZ MR dosage forms. The similarity seen between the dissolution profiles of the reference and similar MR tablets is shown in Fig. 7. The percent of GLZ dissolved from Azukon® MR tablets reached 95.45%±2.95 at the end of 10h (f1=6.26 and f2=65.74), confirming its pharmaceutical equivalence and the applicability of our dissolution method using a USP3 apparatus for MR dosage forms of GLZ.
Conclusion
USP 3 was the most appropriate apparatus for the establishment of an IVIVC for GLZ MR dosage forms. We observed a high level of dissolved drug (Q>85%) across all of the methodologies executed using this apparatus. Excellent performance was also indicated by the high correlation coefficients obtained (R2>0.95). The final dissolution condition was defined to employ the USP apparatus 3 equipped with a 400 µm mesh under an agitation rate of 30 dpm for a total period of 10 h across a series of media consisting of HCl (pH 1.2; 1 h), ABS (pH 4.5; 2 h), PBS (pH 5.8; 1 h), PBS (pH 6.8; 5 h) and PBS (pH 7.2; 1 h), which provided an in vitro equivalent of the pH steps in the GIT. This method showed the highest correlation coefficient (R2=0.9970) and provided a point-to-point IVIVC (level A). The development of a robust dissolution methodology for MR dosage forms of GLZ has potential applications in pharmaceutical equivalence studies and quality control.
Acknowledgments
This work was supported by Coordenação de Aperfeiçoamento de Pessoal de Nível Superior (CAPES), Fundação de Amparo à Pesquisa do Estado do Rio de Janeiro (FAPERJ) and Conselho Nacional de Desenvolvimento Científico e Tecnológico (CNPq). We are grateful to Dr. D. William Provance Jr. for his English review.
Conflict of Interest
The authors declare no conflict of interest.
References
- 1) Sarkar A., Tiwari A., Bhasin P. S., Mitra M., J. App. Pharm. Sci., 1, 11–19 (2001).
- 2) Campbell D. B., Lavielle R., Nathan C., Diabetes Res. Clin. Pract., 14 (Suppl. 2), S21–S36 (1991).
- 3) Rojanasthien N., Autsavakitipong T., Kumsorn B., Manorot M., Teekachunhatean S., ISRN Pharmacol., 375134, 1–6 (2012).
- 4) Wei H., Löbenberg R., Eur. J. Pharm. Sci., 29, 45–52 (2006).
- 5) Priya M. B. V., Murthy T. E. G. K., Dissolution Technol., 19, 38–42 (2012).
- 6) Khattab I. S., Nada A., Zaghloul A. A., Drug Dev. Ind. Pharm., 36, 893–902 (2010).
- 7) Grbic S., Parojcic J., Ibric S., Djuric Z., AAPS PharmSciTech, 12, 165–171 (2011).
- 8) Harrower A., Metabolism, 49 (Suppl. 2), 7–11 (2000).
- 9) Delrat P., Paraire M., Jochemsen R., Biopharm. Drug Dispos., 23, 151–157 (2002).
- 10) Gray V., Kelly G., Xia M., Butler C., Thomas S., Mayock S., Pharm. Res., 26, 1289–1302 (2009).
- 11) Culen M., Dohnal J., Drug Dev. Ind. Pharm., 40, 1277–1282 (2014).
- 12) Galia E., Nicolaides E., Hörter D., Löbenberg R., Reppas C., Dressman J. B., Pharm. Res., 15, 698–705 (1998).
- 13) Rossi R. C., Dias C. L., Bajerski L., Bergold A. M., Fröehlich P. E., J. Pharm. Biomed. Anal., 54, 439–444 (2011).
- 14) Pinto E. C., Cabral L. M., Sousa V. P., Dissolution Technol., 21, 31–40 (2014).
- 15) Brown C. K., Chokshi H. P., Nickerson B., Reed R. A., Rohrs B. R., Shah P. A., Pharm. Technol., 28, 56–65 (2004).
- 16) Silva M. G. R., Volpato N. M., Pinto E. C., Cabral L. M., Sousa V. P., Dissolution Technol., 22, 24–33 (2015).
- 17) Klein S., AAPS J., 12, 397–406 (2010).
- 18) Anand O., Yu L. X., Conner D. P., Davit B. M., AAPS J., 13, 328–335 (2011).
- 19) United States Pharmacopeia (USP), 40ª Ed. Rockville: U.S.P. Convention, 2017.
- 20) Pezzini B. R., Ferraz H. G., AAPS PharmSciTech, 10, 763–771 (2009).
- 21) Asare-Addo K., Levina M., Rajabi-Siahboomi A., Nokhodchi A., Carbohydr. Polym., 86, 85–93 (2011).
- 22) “Guidance for industry, Extended release oral dosage forms: Development, evaluation and aplication of in vitro/in vivo correlations. U.S.” Department of Health and Human Services, Food and Drug Administration, Center for Drug Evaluation and Research (CDER), U.S. Government Printing Office, Rockville, MD, 1997.
- 23) Cardot J.-M., Beyssac E., Alric M., Dissolution Technol., 14, 15–19 (2007).
- 24) González-García I., Mangas-Sanjuán V., Merino-Sanjuán M., Bermejo M., Drug Dev. Ind. Pharm., 41, 1935–1947 (2015).
- 25) Emami J., J. Pharm. Sci., 9, 169–189 (2006).
- 26) Lu Y., Kim S., Park K., Int. J. Pharm., 418, 142–148 (2011).
- 27) Amidon G. L., Lennernäs H., Shah V. P., Crison J. R., Pharm. Res., 12, 413–420 (1995).
- 28) Mandal U., Ray K. K., Gowda V., Ghosh A., Pal T. K., J. Pharm. Pharmacol., 59, 971–976 (2007).
- 29) Skripnik K. K. S., Riekes M. K., Pezzini B. R., Cardoso S. G., Stulzer H. K., AAPS PharmSciTech, 18, 1785–1794 (2017).
- 30) “British Pharmacopeia.” Her Majesty’s Stationery Office, London, 2011.
- 31) Shah H. J., Subbaiah G., Patel D. M., Patel C. N., Biopharm. Drug Dispos., 30, 524–531 (2009).
- 32) Shah V. P., Tsong Y., Sathe P., Sathe P., Liu J., Pharm. Res., 15, 889–896 (1998).
- 33) Maggi L., Canobbio A., Bruni G., Musitelli G., Conte U., J. Drug Del. Sci. Tech., 26, 17–23 (2015).
- 34) Borst I., Ugwu S., Beckett A. H., Dissolution Technol., 4, 11–15 (1997).
- 35) Pezzini B. R., Issa M., Duque M. D., Ferraz H. G., Braz. J. Pharm. Sci., 51, 265–272 (2015).
- 36) Fotaki N., Brown W., Kochling J., Chokshi H., Miao H., Tang K., Gray V., Dissolution Technol., 20, 6–14 (2013).
- 37) Jantratida E., De Maio V., Ronda E., Mattavelli V., Vertzoni M., Dressman J., Eur. J. Pharm. Sci., 37, 434–441 (2009).
- 38) Mwila C., Khamanga S. M. M., Walker R. B., Dissolution Technol., 23, 22–30 (2016).
- 39) Lozano R., Joseph J. M., Kline B., J. Pharm. Biomed. Anal., 12, 173–177 (1994).
- 40) Costa P., Lobo J. M. S., Drug Dev. Ind. Pharm., 27, 811–817 (2001).
- 41) Klein S., Rudolph M. W., Skalsky B., Petereit H. U., Dressmnan J. B., J. Control. Release, 130, 216–219 (2008).
- 42) Fotaki N., Aivaliotis A., Butler J., Dressman J., Fischbach M., Hempenstall J., Klein S., Reppas C., Eur. J. Pharm. Biopharm., 73, 115–120 (2009).
- 43) Honorio T. S., Pinto E. C., Rocha H. V. A., Esteves V. S., Santos T. C., Castro H. C., Rodrigues C. R., Sousa V. P., Cabral L. M., AAPS PharmSciTech, 14, 1244–1254 (2013).
- 44) Klein S., Rudolph M. W., Dressman J. B., Dissolution Technol., 9, 6–12 (2002).
- 45) Ambrogi V., Perioli L., Ciarnelli V., Nocchetti M., Rossi C., Eur. J. Pharm. Biopharm., 73, 285–291 (2009).
- 46) National Center for Biotechnology Information, “PubChem Compound Database; CID=3475.”: ‹https://pubchem.ncbi.nlm.nih.gov/compound/3475›, accessed July, 2017.