Abstract
Melt adsorption is a manufacturing method that offers precise control of particle size distribution of granules and circumvents the disadvantages of conventional melt granulation. However, drug release from particles adsorbed with hydrophobic materials has not been fully investigated, and there are missing details as to whether particles manufactured by this technique can be applied to orally disintegrating tablets (ODT). In this report, we aimed to optimize process parameters and formulation to manufacture ODT containing melt adsorption-particles with the specific characteristic of sustained release. Melt adsorption particles containing Neusilin US2 as the adsorbent were prepared by using various waxes to determine the most suitable material for controlled release formulation. Glycerol fatty acid ester (Poem TR-FB: TR-FB) was the optimal wax examined because of its drug release pattern and tabletability. We then optimized manufacturing conditions by examining granulation time, disintegrant amount per tablet and compression force on the tablet for ODT that meet the criteria of controlled drug release, tensile strength and disintegration of the tablet. Multiple regression analysis revealed the effect of process parameters on tablet properties and drug release with increasing the granulation time affording sustained release of the drug. The analysis also showed that a high compression force crushed the granules coated by TR-FB, which impaired sustained drug release. From the regression model the optimal manufacturing conditions were determined, and the tablet prepared under these conditions concurred with the predicted values and met all criteria. This new technique should contribute to the development of ODT to improve medication adherence.
Introduction
The design of functional particles that control drug release for taste-masking, sustained release or enteric release is required for developing orally disintegrating tablets (ODT) to improve medication adherence. The conventional method for preparing functional particles applied to ODT is the coating technique; however, a disadvantage of this approach is the use of organic solvents to dissolve polymers. Such organic solvents are associated with a high risk of toxicity and environmental pollution. Moreover, waste solvent costs created during this manufacturing process are high. For aqueous-based coating systems, i.e., polymers are dispersed in aqueous solution, removal of the aqueous solvent during the drying process takes a considerable period of time because of the low volatility of the solvent used.1) Thus, based on these disadvantages, the development of new alternative techniques for coatings are required.
As a system that requires neither solvents nor drying processes, melt granulation is a candidate process that utilizes a binding material with a low melting or softening point; after melting the material acts as a binding liquid and the binder congeals at room temperature to yield a solid dosage form.2) Particles can be obtained through a simple, low cost procedure that eliminates toxicity and environmental pollution caused by using organic solvents.3,4) Moreover, the particles manufactured by melt granulation using a hydrophobic wax are available as controlled-release dosage forms.5) However, a drawback of melt granulation is the difficulty in ensuring that the particle size is adequately controlled, because agglomerate formation depends on the physical properties of the molten binders.6,7) For the development of ODTs, the particle size should be less than approx. 200 µm without any rough mouthfeel.8,9) To avoid these issues, melt adsorption-particles have been developed.10) In this process, an adsorbent is used to adsorb molten drugs, surfactants or waxes to its surface and the particle size of the prepared granules is dependent on the adsorbent used, thereby affording precise control of the particle size distribution of the granules prepared. Although melt adsorption can be possibly used as a novel method for the design of functional particles, drug release from particles adsorbed with hydrophobic materials has not been fully investigated because hydrophobic materials used for melt adsorption are only glyceryl monostearate (GM) and stearic acid (SA). In addition, there are no reports describing that particles manufactured by this technique can be applied to ODT. Thus, investigating the drug release pattern and tabletability using this particle are clearly essential for the development of ODT with good usability.
The first purpose of the present study is to evaluate drug release from melt adsorption-particles using various hydrophobic materials with a low melting point and determine which material is suitable for sustained release formulation. In this report, five hydrophobic materials, GM, SA, glycerol fatty acid ester (Poem TR-FB: TR-FB), microcrystalline wax (MW) and hydrogenated castor oil (Lubriwax 101: LW), were selected and evaluated. The selected materials have melting points below 80°C and have been used for melt granulation to develop sustained release formulations.11–13) The second purpose is to investigate the tabletability of melt adsorption-particles and reveal the effect of process parameters on tablet properties and drug release using the Design of Experiment (DoE) and Multiple regression analysis. Here, we aimed to optimize process parameters and formulation to manufacture ODT containing melt adsorption-particles with specific characteristics of sustained release as the final goal of this report.
Experimental
MaterialsN-Acetyl-p-aminophenol (APAP, acetaminophen) was purchased from Iwaki Pharmaceutical Co. Ltd. (Tokyo, Japan). GM (Sunsoft 8000 V) was kindly provided by Taiyo Chemical Ind. Ltd. (Saitama, Japan). TR-FB was kindly provided by Riken Vitamin Co., Ltd. (Tokyo, Japan). SA was purchased from NOF Corp. (Osaka, Japan). MW (LUVAX-2191) was kindly provided by Nippon Seiro Co., Ltd. (Tokyo, Japan). LW was purchased from Freund Corp. (Tokyo, Japan). Crospovidone (Kollidon CL-SF: CL-SF) was purchased from BASF Japan Ltd. (Tokyo, Japan). Magnesium aluminometasilicate (Neusilin US2: US2) was purchased from Fuji Chemical Industries Co., Ltd. (Toyama, Japan).
Screening for Optimal Wax to Prepare Granules with Controlled-Drug ReleaseThermal AnalysisThermal analysis of wax materials was carried out using a differential scanning calorimeter (XSTAR DSC7020, Hitachi High-Tech Science Corp., Tokyo, Japan). The analyses were carried out over the temperature range 30–100°C at a heating rate of 2°C/min under a nitrogen flow (40 mL/min).
Preparation of GranulesMelt adsorption was conducted with a vertical granulator (VG-01, Powrex Corp., Hyogo, Japan). Twenty grams of APAP, 126 g of various waxes (GM, TR-FB, SA, MW and LW) and 54 g US2 were mixed in plastic bags. The mixtures were placed into the VG-01, heated by a hot water circulator and mixed at an impeller speed of 150 rpm until the product temperature reached 70–80°C. While maintaining the product temperature at 70–80°C, the powders and melting wax were mixed for 10–20 min at an impeller speed of 150 rpm and cross screw of 1000 rpm for adsorption of melting wax to US2. The granules was placed onto a tray and cooled to ambient temperature. After the cooling process, the granules were passed through a 32 mesh sieve (sieve pore: 500 µm).
Preparation of TabletsAfter mixing sieved granules with 10% (w/w) CL-SF, 10% (w/w) US2 and 1% (w/w) Mg-St, the obtained mixtures were compressed to a tablet weight of 252.5 mg with a tablet diameter of 9 mm using a rotary type full-automatic tablet press (HT-AP15SSII, Hata Iron Works Co., Ltd., Kyoto, Japan) at a tableting pressure of 120 kgf.
Optimization of Manufacturing Conditions for Orally Disintegrating TabletsDesign of ExperimentsThe factors (granulation time (X1), CL-SF amount per tablet (X2) and compression force on the tablet (X3)) influencing drug release, tablet tensile strength and disintegration time were set as critical process parameters using a three-factor, three-level Box–Behnken design as summarized in Table 1. Each parameter level was set from the results of preliminary examination.
Table 1. Experimental Design of Box–Behnken
| No. | Parameter |
|---|
| X1 (min) | X2 (mg) | X3 (kgf) |
|---|
| 1 | 12 | 15 | 200 |
| 2 | 28 | 15 | 200 |
| 3 | 12 | 25 | 200 |
| 4 | 28 | 25 | 200 |
| 5 | 12 | 20 | 180 |
| 6 | 28 | 20 | 180 |
| 7 | 12 | 20 | 220 |
| 8 | 28 | 20 | 220 |
| 9 | 20 | 15 | 180 |
| 10 | 20 | 25 | 180 |
| 11 | 20 | 15 | 220 |
| 12 | 20 | 25 | 220 |
| 13 | 20 | 20 | 200 |
| 14 | 20 | 20 | 200 |
| 15 | 20 | 20 | 200 |
X1: Granulation time, X2: Disintegrant amount per tablet, X3: Compression force on tablet.
Twenty grams APAP, 126 g TR-FB and 54 g US2 were mixed in a plastic bag, and melt adsorption was conducted using the same method as described in Screening for Optimal Wax to Prepare Granules with Controlled-Drug Release with three different mixing times used (X1): 12, 20 and 28 min, in accordance with DoE (Table 1).
Preparation of TabletsAfter mixing the granules with CL-SF, these obtained mixtures were compressed in tablet form with a tablet diameter of 9 mm using the rotary type full-automatic tablet press (HT-AP15SSII). CL-SF amount per tablet (X2) and compression force on the tablet (X3) were in accordance with DoE (Table 1).
Evaluation of Physicochemical Characteristics of the GranulesParticle Size DistributionThe size distribution of granules with a 500-µm sieve pass was measured using a laser diffraction apparatus (LDSA-1500 A, MicrotracBEL Corp., Osaka, Japan). Uniformity of the size distribution was calculated using the equation:
 | (1) |
where d10, d50 and d90 are 10%, 50% and 90% of the accumulated particle size, respectively.
Scanning Electron MicroscopyThe surface morphology of granules was assessed by scanning electron microscopy (SEM; JSM-6390LA, JEOL, Tokyo, Japan). Samples were placed on double-sided adhesive tape, one side of which had been applied to an aluminum stub. Excess granules were removed and the samples were sputter-coated with gold under reduced pressure (< 26.6 Pa) before imaging. The imaging was carried out at an accelerating voltage of 20 kV.
Angle of Repose and Loose Bulk DensityThe angle of repose and loose bulk density of granules were evaluated as a standard procedure using a Powder Characteristics Analyzer Multi Tester (MT-1001, Seishin Enterprise Co., Ltd., Tokyo, Japan).
Characterization of the TabletsMeasurement of Tablet Tensile StrengthThe tablet crushing load, which is the force required to break a tablet into half by compression in the diametral direction, was measured using a tablet hardness tester (hardness tester, Kiya Corp., Tokyo, Japan). Tensile strength for crushing (T) was calculated using the equation:
 | (2) |
where F is the crushing load, and d and h denote the diameter and thickness of the tablet, respectively.
Disintegration TestThe disintegration time of the tablets was measured using a tablet disintegration tester (NV-2F, Toyama Sangyo, Osaka, Japan) by the disintegration test method of the Japanese Pharmacopoeia (17th edition). The test was performed using water at 37°C as the test fluid without auxiliary discs.
Dissolution TestingThe release behavior of APAP from tablets in each formulation was examined in accordance with the paddle method listed in the Japanese Pharmacopoeia (17th edition). The test medium was 900 mL of water, and the medium was heated to 37°C. The paddle rotation speed was 50 rpm. At 2, 6, 10, 15, 20, 30, 45, 60 and 120 min, 15 mL aliquots of the test solutions were withdrawn and replaced with an equal volume of water, and the samples were passed through a membrane filter (0.45 µm). The amount of APAP released into the medium was quantitatively determined by UV spectroscopy (U-3310, Hitachi High-Tech Science Corp., Tokyo, Japan) at 243 nm.
StatisticsMultiple Regression AnalysisMultiple regression analysis was performed and the response surfaces were constructed using the computer programs JMP8 (SAS Institute Japan Ltd., Tokyo, Japan). The relationships linking main factors and interactions with the response were determined and presented as quadratic equations of the general form in the following equation:
 | (3) |
The disintegration time was converted to the logarithm (Box–Cox transformation) before analysis because the data showed non-normal distributions.
OptimizationThe optimization of manufacturing conditions (X1, X2 and X3) for ODT with controlled-release was calculated from the regression model using JMP8. In the present study, the following criteria were established from the references related with ODT14) and controlled-release15) and U.S. Food and Drug Administration guidance.
-
(1) The release amount of APAP from tablets at 30 min is within the range of 30 to 50%.
-
(2) Tensile strength is more than 0.5 MPa.
-
(3) The disintegration time of tablets is less than 30 s.
Results and Discussion
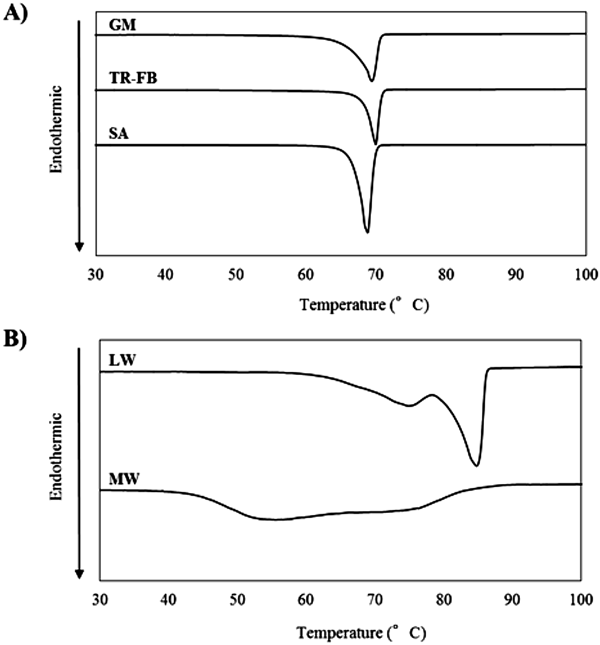
Screening for Optimal Hydrophobic Wax to Control Drug Release from GranulesThermal Analysis of Various WaxesThe DSC thermograms of GM, TR-FB, SA, LW and MW are shown in Fig. 1. For GM, TR-FB and SA, the endothermic peaks corresponding to each melting point were observed at 69.4, 69.9 and 68.8°C, respectively. In contrast, the DSC thermograms of LW and MW showed binomial and broad peaks. LW and MW are mixtures of different natural products. Thus, these materials do not give rise to a single peak.
Size Distribution of GranulesTable 2 shows the results of the particle size: d10, d50 and d90, of each granule prepared using various waxes. We abbreviate these granules to GM-granules, TR-FB-granules, SA-granules, LW-granules and MW-granules. The size distribution of GM-granules, TR-FB-granules and SA-granules are highly uniform, which indicates the success of the melt adsorption process. US2 adsorbed the melting wax to yield a uniform size distribution. However, LW-granules and MW-granules gave broad size distributions because of a large amount of fine powder. These differences in size distribution correlate with the results of thermal analysis, in which the DSC thermograms of LW and MW show binomial and broad peaks. Due to these thermal characteristics, LW and MW did not melt completely because the heating temperature in the vertical granulator was insufficient, and thus the complete adsorption of melting wax was not successful.
Table 2. Particle Size of Granules Prepared Using Various Waxes
| Formulation | d10 (µm) | d50 (µm) | d90 (µm) | Uniformity |
|---|
| GM-granules | 74.9 | 134.2 | 209.2 | 1.0007 |
| TR-FB-granules | 90.9 | 176.7 | 277.2 | 1.0543 |
| SA-granules | 53.0 | 103.4 | 161.2 | 1.0464 |
| MW-granules | 24.0 | 79.5 | 166.7 | 1.7950 |
| LW-granules | 16.7 | 54.6 | 115.1 | 1.8022 |
| US2 | 27.9 | 95.2 | 172.5 | 1.5189 |
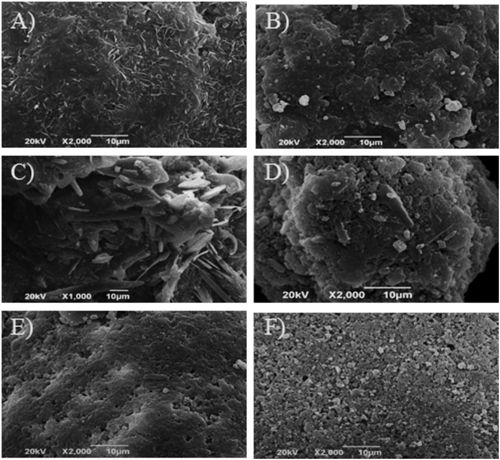
Figure 2 shows SEM images of granules. The surface of GM-granules and TR-FB-granules were smooth and formed by extending each wax. In contrast, needle-like crystals were observed on the surface of SA-granules. This crystallization was derived from SA, which is known to form needle-like crystals.16,17) While the above three granules show the presence of wax on each surface, LW-granules and MW-granules had rough and porous surfaces caused by insufficient adsorption of wax to US2. The angle of repose and the loose bulk density of the granules are summarized in Table 3. Carr suggested that powders with an angle of repose of less than 41° are useful for avoiding cross-linking during storage18); therefore, the reference value of the angle of repose for good flowability should be less than 41°. The low angle of repose and high loose bulk density of GM-granules and TR-FB-granules indicated that flowability and compaction of granules were improved by the melt adsorption process. According to the angle of repose, SA-granules also show good flowability, but the loose bulk density is substantially lower when compared with the values for GM-granules and TR-FB-granules. This difference is because of the increase in distance between the particles affected by the needle-like crystals. LW-granules and MW granules showed relatively high angles of repose, which indicated insufficient adsorption of wax to US2, as indicated in the size distribution and SEM results. Taken together, we concluded that LW and MW are not suitable materials for the melt adsorption process.
Table 3. Angle of Repose and Loose Bulk Density of Granules Prepared Using Various Waxes
| Formulation | Angle of repose (°) | Loose bulk density (g/mL) |
|---|
| GM-granules | 33.7 ± 1.2 | 0.54 ± 0.00 |
| TR-FB-granules | 35.8 ± 0.8 | 0.59 ± 0.00 |
| SA-granules | 35.7 ± 1.6 | 0.36 ± 0.00 |
| LW-granules | 39.7 ± 0.6 | 0.45 ± 0.00 |
| MW-granules | 43.3 ± 1.3 | 0.45 ± 0.01 |
Each value represents the mean ± standard deviation (S.D.) (n = 3).
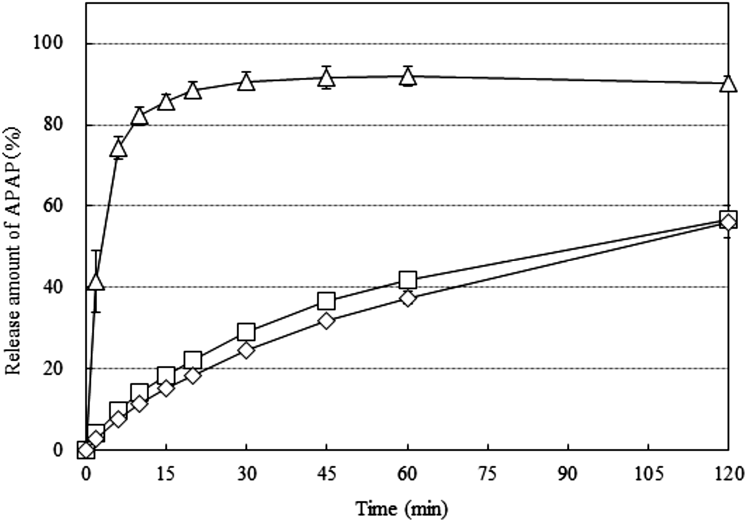
Figure 3 shows the results of the release of APAP from the tablets prepared using GM-granules, TR-FB-granules and SA-granules. We abbreviate these tablets to GM-Tablet, TR-FB-Tablet and SA-Tablet. Eighty-five percent of APAP was released in 30 min for the GM-Tablet, whereas the TR-FB-Tablet showed that the release amount of APAP at 120 min was less than 60%. This difference in release patterns is attributed to the intrinsic solubility of each wax because the GM-granules and TR-FB-granules show similar physical properties; size distribution, SEM images, angle of repose and loose bulk density. The Hydrophilic–Lipophilic Balance (HLB) of GM and TR-FB are 4.0 and 2.1, respectively, which indicates that GM has higher hydrophilicity than TR-FB.11) The SA-Tablet also showed a similar release pattern to the TR-FB-Tablet; however, the disintegration of the SA-Tablet observed during dissolution testing was slower than that of the TR-FB-Tablet. The disintegration time in the dissolution test media of the TR-FB-Tablet was less than 1 min, whereas that of SA-Tablet was more than 30 min. The particles released from the SA-tablet did not disperse well into the media because of poor disintegration. Thus, we concluded that SA was not suitable for ODT. From the above results, TR-FB was determined to be the optimal wax to manufacture ODT with controlled-drug release using melt adsorption.
Results of Evaluation of the Granules and the Tablets Prepared in Accordance with DoEThe screening tests revealed that TR-FB is the optimal wax, and we therefore investigated correlations between three manufacturing conditions (X1: mixing time; X2: CL-SF amount per tablet; and X3: compression force on tablet) that influence the properties of the granules and the tablets prepared in accordance with DoE.
Size Distribution of GranulesTable 4 shows the particle size, d10, d50 and d90, of each granule prepared for 12, 20 and 28 min of granulation time in accordance with DoE (Table 1). All granules showed a uniform size distribution and 100–200 µm of d50, which was assumed to have a good mouth-feel. The particle size of granules increased when the granulation time increased to 28 min. This was presumably because the longer granulation time enabled more particles to bind to each other. This result indicated that the upper limit of the granulation time in DoE was 28 min.
Table 4. Particle Size of Granules Prepared under Various Granulation Times
| Granulation time | d10 (µm) | d50 (µm) | d90 (µm) |
|---|
| 12 min | 59.5 | 134.2 | 231.2 |
| 20 min | 55.4 | 126.1 | 233.6 |
| 28 min | 85.0 | 179.0 | 339.7 |
Figure 4 shows SEM images of granules. As the granulation time increased the surface of granules became smooth caused by extension of TR-FB. The angle of repose and the loose bulk density of the granules are summarized in Table 5. Regardless of the granulation time, all granules showed that the angle of repose was less than 41°, which means good flowability. With increasing granulation time, the loose bulk density increased, which indicated that the granules became dense. The obtained loose bulk density values and SEM images of granules are in good agreement.
Table 5. Angle of Repose and Loose Bulk Density of Granules Prepared over the Various Granulation Time
| Granulation time | Angle of repose (°) | Loose bulk density (g/mL) |
|---|
| 12 min | 37.8 ± 1.2 | 0.47 ± 0.01 |
| 20 min | 37.0 ± 1.0 | 0.51 ± 0.01 * |
| 28 min | 37.0 ± 0.5 | 0.54 ± 0.01 ** |
Each value represents the mean ± S.D. (n = 3). * p < 0.05 as compared with the granulation time of 12 min. ** p < 0.05 as compared with the granulation time of 20 min.
The tensile strength, the disintegration time and the release amount of APAP in 30 min for the tablets prepared in accordance with DoE are summarized in Table 6. The tensile strength of all tablets met the criterion, which was more than 0.5 MPa. The disintegration time of No. 2, 4, 6 and 8 tablets using granules prepared using 28 min of granulation time met the criterion, which was less than 30 s. This result indicated that the granulation time influenced the disintegration. The release amount of APAP of No. 1, 5, 6, 9, 10 and 11 tablets met the criterion, which was within the range of 30 to 50%. Some tablets showed different release rates even in the case of the same granulation time, which indicated the possibility that the tableting conditions influenced the release rate of APAP. In addition, tablets (No. 2, 4, 6 and 8) using granules prepared by 28 min of granulation time did not show definite differences in the release rate of APAP when compared with that of other tablets. This is most likely because the release pattern of APAP from the tablets using granules with long granulation times was less likely to be affected by the tableting conditions.
Table 6. Evaluation of Tablets Prepared in Accordance with DoE
| No. | Parameter | Tensile strength (MPa) | Disintegration time (s) | Release amount of APAP at 30 min (%) |
|---|
| X1 (min) | X2 (mg) | X3 (kgf) |
|---|
| 1 | 12 | 15 | 200 | 0.94 ± 0.03a) | 266 ± 17 | 33.8 ± 0.7c) |
| 2 | 28 | 15 | 200 | 0.87 ± 0.08a) | 26 ± 4b) | 57.2 ± 1.3 |
| 3 | 12 | 25 | 200 | 0.91 ± 0.03a) | 63 ± 19 | 74.4 ± 2.7 |
| 4 | 28 | 25 | 200 | 0.72 ± 0.04a) | 20 ± 3b) | 59.9 ± 2.9 |
| 5 | 12 | 20 | 180 | 0.80 ± 0.07a) | 316 ± 108 | 41.4 ± 5.0c) |
| 6 | 28 | 20 | 180 | 0.60 ± 0.08a) | 21 ± 1b) | 43.2 ± 7.0c) |
| 7 | 12 | 20 | 220 | 1.01 ± 0.09a) | 547 ± 173 | 64.6 ± 11.8 |
| 8 | 28 | 20 | 220 | 0.92 ± 0.03a) | 29 ± 7b) | 55.0 ± 7.6 |
| 9 | 20 | 15 | 180 | 0.74 ± 0.08a) | 121 ± 6 | 37.7 ± 5.7c) |
| 10 | 20 | 25 | 180 | 0.70 ± 0.08a) | 72 ± 39 | 48.8 ± 4.4c) |
| 11 | 20 | 15 | 220 | 0.98 ± 0.01a) | 147 ± 58 | 49.0 ± 6.7c) |
| 12 | 20 | 25 | 220 | 1.05 ± 0.15a) | 42 ± 13 | 73.1 ± 7.8 |
| 13 | 20 | 20 | 200 | 0.85 ± 0.10a) | 62 ± 11 | 59.8 ± 5.1 |
| 14 | 20 | 20 | 200 | 0.91 ± 0.05a) | 86 ± 29 | 55.0 ± 5.1 |
| 15 | 20 | 20 | 200 | 0.78 ± 0.02a) | 79 ± 19 | 58.5 ± 6.1 |
Each value represents the mean ± S.D. (n = 3). a) Tensile strength meets the criterion (> 0.5 MPa). b) Disintegration time meets the criterion (< 30 s). c) Release amount of APAP from tablets at 30 min meets the criterion (30–50%).
The optimization of manufacturing conditions to meet each criteria of ODT with controlled-release was determined from the regression model. The significance of each factor and its effect on the tablet properties was determined and the results are presented in Table 7. The coefficients, the p-value obtained by the t-test to assess the significance of each term, and the R2 value, which is an indicator of the fit of each linear regression equation are summarized.
Table 7. Results of Multiple Regression Analysis of Tablet Properties
| Term | Tensile strength | Disintegration time | Release amount of APAP at 30 min |
|---|
| Coefficient | p-Value | Coefficient | p-Value | Coefficient | p-Value |
|---|
| X1: Granulation time | −0.0089 | 0.0151 | −0.1425 | 0.0037 | 0.0172 | 0.9116 |
| X2: Disintegrant amount per a tablet | −0.0038 | 0.3838 | −0.0868 | 0.0005 | 1.9625 | 0.0004 |
| X3: Compression force on tablet | 0.0070 | 0.0008 | 0.0033 | 0.0299 | 0.4413 | 0.0007 |
| X12 | −0.0002 | 0.6450 | −0.0012 | 0.6686 | −0.0199 | 0.4962 |
| X22 | 0.0008 | 0.5036 | −0.0098 | 0.7322 | −0.0068 | 0.9253 |
| X32 | 0.0000 | 0.8268 | 0.0009 | 0.3018 | −0.0136 | 0.0256 |
| X1X2 | −0.0006 | 0.4095 | 0.0074 | 0.1353 | −0.2369 | 0.0023 |
| X2X3 | 0.0002 | 0.4549 | −0.0018 | 0.2090 | 0.0325 | 0.1084 |
| X3X1 | 0.0002 | 0.2949 | −0.0004 | 0.4108 | −0.0178 | 0.1476 |
| Constant | −0.2935 | 0.2389 | 8.2469 | 0.0037 | −70.0771 | 0.0031 |
| R2 = 0.932 | R2 = 0.941 | R2 = 0.972 |
As shown in Table 7, the tensile strength increased when the compression force on the tablet (X3; p = 0.0008) increased, whereas the tensile strength decreased when the granulation time (X1; p = 0.0151) increased. The effect of the granulation time (X1) was caused by a reduction in the density of the granules (see Powder Properties). US2, the core particle of all granules, has good compactability because this particle is porous.19,20) However, increasing the granulation time caused complete adsorption of TR-FB and the consequent loss of compactability of US2, leading to a decrease in tensile strength. In addition, any significant two-factor interactions were not observed.
The disintegration time decreased when the granulation time (X1; p = 0.0037) and the disintegrant amount (X2; p = 0.0005) increased. In addition, the disintegration time increased when the compression force on the tablet (X3; p = 0.0299) increased. In contrast to the tensile strength, the density of granules, which increased as the granulation time increased, may cause a decrease of binding with each particle inside the tablet.
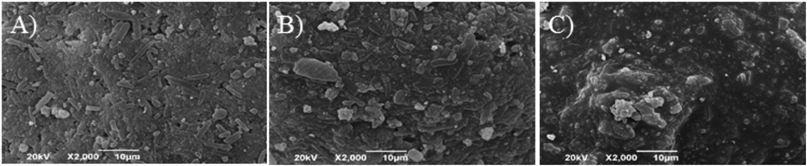
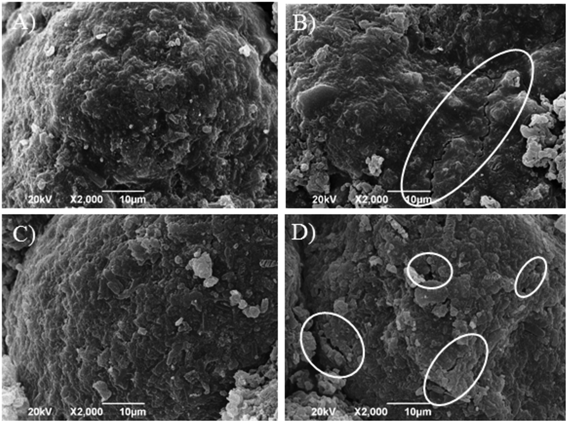
A reduction in the amount of released APAP was observed when the disintegrant amount (X2; p = 0.0004) decreased. This trend of release patterns is associated with the disintegration of the tablet. The release of APAP was enhanced when the compression force on the tablet increased (X3; p = 0.0007) increased, which cannot be explained by the disintegration of the tablet. This observation suggests that the high compression force crushed the surface of the granules coated by TR-FB, resulting in the loss of sustained release of APAP. Figure 5 shows the morphology of granules after tableting. At a low compression force (180 kgf) on tablets No. 6 and No. 9 no change in the surface of granules was observed when compared with that before tableting (Fig. 4). In contrast, at the high compression force (220 kgf) on tablets No. 8 and No. 12 cracks on the surface of granules were observed, which clearly shows that the increase in the release rate of APAP was caused by crushing the surface of granules.
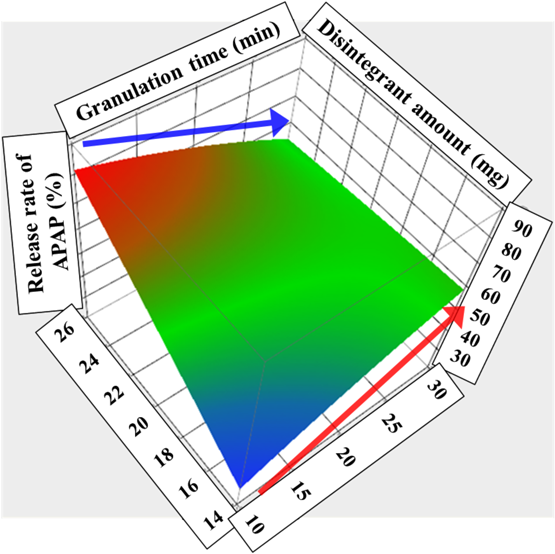
A negative interaction between granulation time and disintegrant amount (X1X2; p = 0.0023) was observed. The response surface plot showing the release amount of APAP (Fig. 6) explains the effect of this interaction. In the case of a low disintegrant amount, an accompanying increase in granulation time leads to an increase in the release amount of APAP. However, in the case of a high disintegrant amount, the granulation time shows the opposite effect, which depresses the release of APAP. This difference is responsible for the abovementioned observation that the delay of disintegration of a tablet leads to a decrease in the release rate of APAP. In other words, increasing the granulation time results in faster disintegration of a tablet with low disintegrant amount, and hence an increase in the amount of APAP released. In contrast, a tablet with high disintegrant amount showed fast disintegration without being affected by the granulation time, so the release pattern of APAP, which depends on granules coated by TR-FB, was evaluated. Thus, an increase in the granulation time resulted in a complete coat of TR-FB on the surface of the granules and hence sustained release of APAP.
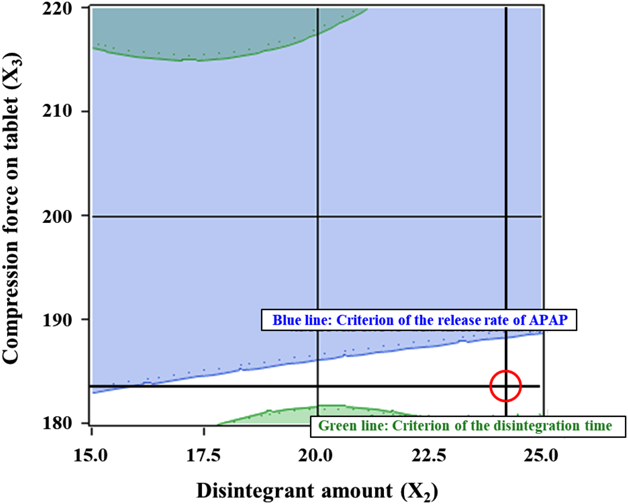
Optimization of ODT FormulationDesign space for preparing tablets that meet all criteria was defined from the regression model as the white area in Fig. 7. The x and y axes show the disintegrant amount and the compression force on the tablet, respectively, and the granulation time is fixed at 28 min, which shows the largest area of design space. On the basis of this area, we determined that the optimal manufacturing conditions for granulation time, disintegrant amount and compression force on a tablet were 28 min, 24 mg and 184 kgf, respectively, which is indicated by the red circle in Fig. 7. Evaluation of tablets prepared using the optimal manufacturing conditions was carried out, and these results are summarized along with the prediction calculated by the regression model in Table 8. All experimental values agree well with the predicted values, indicating that an appropriate regression model was obtained. In addition, the goal of this report has been achieved because tablets prepared by the optimal manufacturing conditions meet all criteria. Thus, we have a method to prepare controlled release of fine particles prepared by melt adsorption for orally disintegrating tablets.
Table 8. Optimization and Statistical Model Validation
| Predicted value | Experimental value |
|---|
| Tensile strength (MPa) | 0.59 | 0.61 ± 0.09 |
| Disintegration time (s) | 24.0 | 23.0 ± 3.0 |
| Release rate of APAP from tablet at 30 min (%) | 46.4 | 41.7 ± 6.4 |
Each value represents the mean ± S.D. (n = 3). The optimal parameters: X1 = 28 min, X2 = 24 mg, X3 = 184 kgf.
Conclusion
In the present study, we focused on melt adsorption as a manufacturing method for controlled-release microparticles that can be used for ODT. Firstly, we conducted screening tests to determine the optimal wax to control drug release from the granules manufactured using melt adsorption. The screening results showed that LW and MW were not suitable as material for melt adsorption because they did not completely melt due to an insufficient heating temperature in the vertical granulator, and the adsorption of the melting wax was incomplete. In addition, the dissolution study of APAP from each tablet using GM, TR-FB and SA showed that TR-FB was the optimal wax to manufacture ODT with control drug release using melt adsorption.
We then optimized manufacturing conditions for ODT that meet the criteria of controlled release of APAP, tensile strength and the disintegration of the tablet. The result of multiple regression analysis revealed the effects of process parameters on tablet properties and drug release, and indicated that increasing granulation time ensured sustained release of APAP. This effect was caused by a complete coat of TR-FB on the surface of granules, as observed by SEM. SEM analysis of the granules also showed that a high compression force crushed the surface of granules coated by TR-FB, which impaired the sustained release of APAP. Based on the design space defined from the regression model we determined the optimal granulation time, disintegrant amount and compression force on tablets as 28 min, 24 mg and 184 kgf, respectively. We then evaluated tablet preparation using the optimal manufacturing conditions, and these results agreed well with the predicted values and met all criteria.
The present study demonstrated that melt adsorption is a superior manufacturing method for the controlled-release of microparticles. Specifically, we showed that ODT with adequate strength and disintegration could be prepared by using TR-FB granules without losing sustained-release. Although the present study showed that melt adsorption was useful for designing ODT when APAP was incorporated, we have reported previously that melt adsorption is also an efficient technique for manufacturing particles containing ibuprofen, which has different physical properties to that of APAP without any agglomerates.10) Therefore, this technique is expected to be suitable for controlled release formulation of various drugs. In addition, there are many other materials besides US2 that may be suitable for use as adsorbents in melt adsorption. Microporous calcium silicate (Florite) and silicon dioxide (Sylysia) are adsorptive porous materials that have various grades with different particle sizes, adsorbing capacities and specific surface areas. Thus, melt adsorption using these materials may enable the design and tailoring of particles for each drug formulation. In conclusion, this technique should contribute to the development of ODT to improve medication adherence.
Conflict of Interest
The authors declare no conflict of interest.
References
- 1) Cerea M., Zheng W., Young C. R., McGinity J. W., Int. J. Pharm., 279, 127–139 (2004).
- 2) Schæfer T., Powder Technol., 117, 68–82 (2001).
- 3) Thomsen L. J., Schæfer T., Kristensen H. G., Drug Dev. Ind. Pharm., 20, 1179–1197 (1994).
- 4) Voinovich D., Moneghini M., Perissutti B., Filipovic-Grcic J., Grabnar I., Int. J. Pharm., 203, 235–244 (2000).
- 5) Shiino K., Iwao Y., Fujinami Y., Itai S., Int. J. Pharm., 431, 70–77 (2012).
- 6) Schæfer T., Holm P., Kristensen H. G., Drug Dev. Ind. Pharm., 16, 1249–1277 (1990).
- 7) Schæfer T., Mathiesen C., Int. J. Pharm., 139, 139–148 (1996).
- 8) Mizumoto T., Tamura T., Kawai H., Kajiyama A., Itai S., Chem. Pharm. Bull., 56, 530–535 (2008).
- 9) Kimura S., Uchida S., Kanada K., Namiki N., Int. J. Pharm., 484, 156–162 (2015).
- 10) Shiino K., Fujinami Y., Kimura S., Iwao Y., Noguchi S., Itai S., Chem. Pharm. Bull., 65, 726–731 (2017).
- 11) Aoki H., Iwao Y., Uchimoto T., Noguchi S., Kajihara R., Takahashi K., Ishida M., Terada Y., Suzuki Y., Itai S., Int. J. Pharm., 478, 530–539 (2015).
- 12) Matsumoto K., Kimura S., Iwao Y., Itai S., Int. J. Pharm., 532, 528–536 (2017).
- 13) Kowalski J., Kalb O., Joshi Y. M., Serajuddin T. M., Int. J. Pharm., 381, 56–61 (2009).
- 14) Bi Y., Yonezawa Y., Sunada H., J. Pharm. Sci., 88, 1004–1010 (1999).
- 15) Maeda A., Shinoda T., Ito N., Baba K., Oku N., Mizumoto T., Int. J. Pharm., 408, 84–90 (2011).
- 16) Blach C., Gravelle A. J., Peyronel F., Weiss J., Barbut S., Marangoni A. G., RSC Adv., 6, 81151–81163 (2016).
- 17) Gravelle A. J., Davidovich-Pinhas M., Barbut S., Marangoni A. G., Food Res. Int., 91, 1–10 (2017).
- 18) Carr R. L., Chem. Eng., 72, 163–168 (1965).
- 19) Sun W., Aburub A., Sun C. C., Int. J. Pharm., 106, 1772–1777 (2017).
- 20) Li Z., Zhao L., Lin X., Shen L., Feng Y., Int. J. Pharm., 529, 543–556 (2017).