Abstract
Granules prepared by a continuous twin screw granulator (TSG) were analyzed by X-ray micro-computed tomography (X-ray μCT) and the relationships between porosity of granules and granule properties were investigated. A model formulation containing ibuprofen, lactose monohydrate, microcrystalline cellulose, and hydroxypropyl cellulose was used. The porosity of granules was measured by X-ray μCT and mercury porosimetry. The data sets obtained by both methods showed linear correlation despite different values, which were attributed to the resolution of X-ray μCT and a low-signal-to-noise ratio of the original cross-sectional images. The porosity of granules measured by X-ray μCT decreased from 11–14 to 6–7% as liquid-to-solid ratio (L/S) increased, while the standard deviation (S.D.) of the porosity of individual granules decreased from 4–5 to 2%. L/S affected the porosity of granules. By contrast, the effect of screw speed was not significant. Pressure transmission, G, which indicates the liquid dispersion in wet kneaded masses, increased as the porosity of granules and the S.D. decreased. The cross-sectional images showed that granules were densified as L/S increased. Based on these results, the effect of L/S on the porosity of granules can be explained by liquid dispersion and densification of the wet granules. The porosity of granules measured by X-ray μCT showed good linear correlation with friability and drug dissolution rate (R2 = 0.9107 and 0.8834, respectively). This study revealed that the drug dissolution rate was regulated by a disintegration step in which the porosity of granules plays an important role.
Introduction
Continuous manufacturing (CM) has recently drawn much attention in the pharmaceutical industry. The U.S. Food and Drug Administration has presented that they support the implementation of CM using science- and risk-based approaches.1) One of the advantages of CM is the flexibility of batch definition. Contrary to batch manufacturing, the batch size in CM can be changeable by varying the processing time. Due to the flexibility of batch size, a twin screw extruder has become popular as a continuous wet granulator. Recently, a continuous twin screw granulator (TSG), which was a modification of a twin screw extruder, has been developed to achieve robust granulation process and to obtain the granules for subsequent compression process.2)
Studies regarding the TSG have been conducted by many researchers. Thompson and Sun3) and Sayin et al.4) investigated the effects of screw configuration and screw design on the granule properties. Kumar et al.5) and Vercruysee et al.6) investigated the effect of residence time and solid-liquid mixing on the granule properties. Li et al.7) investigated the relationship between binder delivery methods and the granulation progress along the barrel length of the TSG. Dhenge et al.8) studied binder viscosity on the granules properties. Vercruysee et al.9) and Liu et al.10) investigated the relationships between the process parameters of the TSG and the granule/tablet properties using design of experiments (DoE). El Hagrasy et al.11) investigated the effects of raw material properties on the granule properties and the granulation behavior. Lute et al.12) and Verstraeten et al.13) experimentally clarified the mechanism of granule formation along the barrel length. Most of the previous studies focused on the investigation of granule properties prepared by the TSG under various operational conditions, and not many researchers have studied the tablet properties prepared from the TSG.9,10)
Regarding tablet properties, the tablet strength has been studied; however, drug dissolution from tablets, a major factor in the determination of the efficacy and safety of oral dosage forms, has not been well studied. Since tablets are the most commonly used oral dosage forms, research on the tablet properties prepared by the TSG is crucial for developing the pharmaceutical products. In our previous study, properties of granules and tablets prepared by the TSG were compared with those prepared by a fluidized-bed granulator (FBG) and a high shear granulator (HSG).14) Our previous study demonstrated that the tablet strength and the drug dissolution from tablets were similar with those of the FBG. It also revealed that the granules prepared by the TSG also had porous structure as those prepared by the FBG, while the granules prepared by the HSG showed dense structure with weaker tablet strength and slower drug dissolution from tablet. These results suggest that the porous structure of the granules affects the tablet strength and the drug dissolution from tablets. However, the internal structure was not well characterized in our previous study. Therefore, in the present study, we focused on the effect of granule porosity on the granule properties such as drug dissolution. So far, some researchers have studied the porosity of granules prepared by the TSG. Sayin et al.4) showed the effect of liquid-to-solid ratio (L/S) and the shape of screw elements on the porosity of granules. Dhenge et al.8) showed the effect of the L/S and binder amount on the porosity of granules. El Hagrasy et al.11) revealed the effect of the L/S and raw material properties on the porosity of granules. Verstraeten et al.13) indicated the distribution of porosity obtained in the different TSG compartments for granules, including hydrophobic and hydrophilic composition under low and high L/S conditions. Lee et al.15) showed the porosity of granules prepared with different L/S and screw speed. These researchers focused on the investigation of the effect of process parameters on the porosity of granules. By contrast, we focused on the investigation of the effect of the porosity of granules on the granule properties. Since the Quality by Design approach has become the norm in pharmaceutical development, a systematic and mechanistic understanding of critical quality attributes (CQAs) and critical process parameters (CPPs) is required. It is well known that the porosity affects the performance of solid dosage form. Thus, the investigation of the effect of the porosity on the granule properties can help us to deeply understand the CQAs and the CPPs for the granules prepared by the TSG.
To investigate the porosity of granules, the granules prepared by the TSG were analyzed using X-ray micro-computed tomography (X-ray μCT), a non-destructive analytical technique using X-ray shadow images to reconstruct cross-sectional images of objects. Although mercury porosimetry is often used to analyze the microstructure of solid dosage form, a hazardous heavy metal is used for the analysis, and it is suggested that the internal microstructure of weak materials may be deformed by high pressure during an analysis.15) The advantages of X-ray μCT are that it is safe because no hazardous material is used, and that microstructure is directly observed in a non-destructive manner with very small quantity of sample. In addition, X-ray μCT can analyze an individual sample, while mercury porosimetry measures properties of bulk sample. Some examples of the application of X-ray μCT to the analysis of internal microstructure of granules have been reported. For example, Farber et al.16) studied porosity, pore size distribution, and geometric structure of pores in granules produced using different conditions and materials. Crean et al.17) elucidated the internal physical and chemical microstructure of pharmaceutical granules in conjunction with spectroscopic methods. Bouwman et al.18) investigated the effect of the amount of binder liquid on the granulation mechanisms and structure of granules prepared by high shear granulation. Smřcka et al.19) analyzed the inter- and intra-batch variation of granule properties. These previous studies showed that X-ray μCT enabled visualization of the internal microstructure of granules and could provide useful information leading to insight on the internal microstructure and the granule properties.
The objective of the present study was to analyze the porosity of granules prepared by the TSG using X-ray μCT and to investigate the relationship between the porosity of granules and granule properties. The effects of the process parameters of the TSG on the porosity of granules were also investigated, to gain a deeper understanding of the relationship between the process parameters of the TSG and the granules properties.
Experimental
MaterialsThe model formulation used in this study is listed in Table 1. Ibuprofen (Ibuprofen 25, BASF SE, Ludwigshafen, Germany), lactose monohydrate (Pharmatose® 200M, DFE Pharma, Goch, Germany), microcrystalline cellulose (Ceolus® PH-101, Asahi Kasei Corporation, Tokyo, Japan), and hydroxypropyl cellulose (HPC-L FP, Nippon Soda Co., Ltd., Tokyo, Japan) were blended uniformly before granulation process. Particle size distribution of raw materials was characterized by a laser diffraction-type particle size analyzer (HELOS & RODOS, Sympatec GmbH, Clausthal-Zellerfeld, Germany).
Table 1. Formulation of Granules
| Sample | Function | Contents (% (w/w)) | Particle size (µm) |
|---|
| D10 | D50 | D90 |
|---|
| Ibuprofen | Active ingredient | 20.2 | 8.9 | 26.3 | 58.8 |
| Lactose monohydrate | Filter | 56.6 | 5.7 | 42.4 | 121.1 |
| Microcrystalline cellulose | Filler/disintegrant | 20.2 | 22.1 | 63.2 | 128.5 |
| Hydroxypropyl cellulose | Binder | 3.0 | 20.8 | 67.7 | 125.3 |
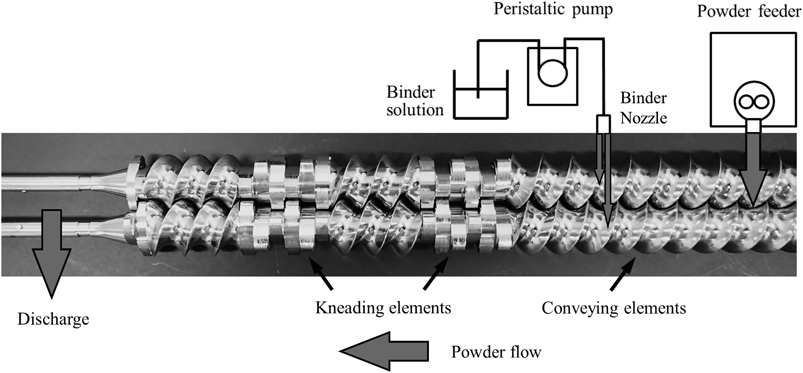
ConsiGma®-1 (GEA Pharma Systems n.v., Collette®, Wommelgem, Belgium), a continuous twin screw granulation and drying system for R&D, was used in this study. Figure 1 shows a photograph with schematic description of the TSG. The ConsiGma®-1 consists of a co-rotating screw with length-to-diameter ratio of 20 : 1, a peristaltic pump, a loss-in-weight feeder, a temperature control unit, and a fluidized-bed dryer. The raw materials were blended by use of a diffusion blender (110 L) at a rotation speed of 20 rpm for 30 min. The blended powder was fed into the granulation zone by the loss-in-weight feeder. The blended powder was carried ahead by the conveying compartments followed by an addition of purified water with the peristaltic pump via 0.8-mm nozzles. There were two binder-addition ports on the granulator barrel. Wetted powder was then granulated by the kneading elements, which consisted of total 12 oval-shape kneading discs. The kneading discs were oriented at an angle of 60° and placed separately in two zones (6 kneading discs in each zone) having the conveying elements between them. There was no die plate attached to the exit of the granulation zone. Table 2 shows the granulation conditions. The granulation experiments were conducted under 12 different sets of the manufacturing conditions by varying the screw speed and L/S. The wet granules were dried in the fluidized-bed drier.
Table 2. Granulation Conditions
| Manufacturing parameters | Setting values |
|---|
| Screw speed (rpm) | 500, 700, 900 |
| Powder feed rate (g/min) | 333 |
| Barrel temperature (°C) | 20 |
| Water adding rate (g/min) | 50 (L/S 15%) |
| 67 (L/S 20%) |
| 83 (L/S 25%) |
| 100 (L/S 30%) |
Approximately 4 g of granules was sieved by use of an automated sonic sieving particle size analyzer (Robot Shifter RPS-205, Seishin Enterprise Co., Ltd., Tokyo, Japan). Particle size distribution was measured three times per sample. Sieve mesh sizes were 2000, 1400, 710, 500, 250, 150, 106, and 75 µm.
X-Ray μCTA tabletop X-ray μCT system (Skyscan 1172, Bruker microCT n.v., Kontich, Belgium) was used in this study. Ten individual sieved granules were analyzed per sample. Three individual granules were mounted on a 4-mm round-shaped sample holder at a time, and X-ray shadow images were acquired with an X-ray source at 59 kV (100 µA) using a 0.70° scan step over 180° total rotation. The resolution of the charge-coupled device (CCD) camera was 1000 × 668 pixels, and the pixel size was approximately 6 µm. The X-ray shadow images were reconstituted into cross-sectional images using NRecon® (Bruker microCT n.v., Kontich, Belgium) software. Analysis of the cross-sectional images was then conducted using CTAn (Bruker microCT n.v., Kontich, Belgium) software. The procedure for image processing using NRecon® and CTAn software was earlier described by Crean et al.17)
In the present study, the intragranular region was analyzed as the “region of interest (ROI),” and the boundary region was excluded from the analysis. Thus, the definition of “porosity of granules” in this study means the porosity of intra-granules. The integrated ROIs across the selected cross-sectional images were defined as “volume of interest (VOI).” The selected cross-sectional images were processed by use of a technique called “binarization.” The threshold index was determined to distinguish pores and solids inside the ROIs. Then, the total VOI volume and the Object volume (pores) within the VOI were computed from the binary images using 3D analysis command of the software. The porosity of granules was defined as the ratio of the Object volume to the total VOI volume.
Mercury PorosimetryIn addition to X-ray μCT, porosity of granules was measured by use of a mercury porosimeter (AutoPore IV 9520, Micromeritics Instrument Corporation, Norcross, GA, U.S.A.). Approximately 0.3 g of sieved granules was placed in a 5-cm3 cell for powder measurement and degassed to 50 μmHg before mercury was forced into the cell. The pressure was increased from 2.6 kPa (0.38 psia) up to 414 MPa (60000 psia). The values of 130° and 485 mN/m were used for the contact angle and surface tension of mercury.17) The pressure and mercury volume intruded were recorded to determine the pore size distribution. Mercury porosimetry measurement was performed one time per sample. The porosity of granules was calculated based on the pore volume and the volume of bulk granules.
Compression Test of Wet GranulesIn this study, a compression tester, which has been used to evaluate the kneading conditions of wet kneaded masses,20–22) was used to evaluate the kneading conditions of the wet granules prepared by the TSG.
Figure 2 shows a schematic diagram of a compression tester (PCM-200, Dalton Co., Ltd., Tokyo, Japan). Sieved wet granules (2 g) were placed in the cylinder (i.d. 11.3 mm). The wet granules were compressed at the constant rate of 0.167 mm/s. During the compression, the loads of the lower and upper punches were recorded at intervals of 0.1 s. When the load of the upper punch reached 1950 N, the analysis was stopped. Compression test was performed three times per sample. The pressure transmission, G, was calculated using the Eq. 120–22) as shown below.
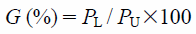 | (1) |
where PL and PU indicate the loads of the lower and upper punches, respectively. In this study, the pressure transmission, G, was calculated when the upper punch load reached 1005 N.
Granule Strength (Friability)Friability was measured using an in-house granule friability tester, consisting of a motor drive and a vertically attached plastic tube (i.d. 50 × 350 mm length). Sieved granules (10 g) were placed in the plastic tube with 15 stainless balls (ϕ11 mm, 5.4 g/ball). The plastic tube was rotated horizontally in the longitudinal direction at 25 rpm for 8 min (200 times). The ground sample was then collected and sieved through a 180-µm sieve. Friability was measured one time per sample. Friability was calculated as the ratio of the sample through the 180-µm sieve to the total sample for analysis.
Drug DissolutionSieved granules (200 mg) were tested using a dissolution apparatus (paddle method) indicated in the Japanese Pharmacopoeia, Seventeenth Edition (JP17). Dissolution test was performed using three vessels per sample. Paddle speed was kept at 50 rpm. The test medium was McIlvaine buffer (pH 5.5). Test medium (10 mL) was collected at 5, 10, 15, 30, 45, and 60 min. The collected test medium was then filtered through a 0.45-µm polyvinylidene difluoride (PVDF) filter. The determination of ibuprofen content was conducted using an HPLC system (Prominence UFLC, Shimadzu Corporation, Kyoto, Japan) connecting a C18 column (YMC-Pack Pro C18 RS, i.d. 4.6 × 150 mm length, 5 µm particle size, YMC Co., Ltd., Kyoto, Japan). The mobile phase consisted of 0.05 M sodium dihydrogen phosphate solution (pH 2.6) and acetonitrile (40 : 60, v/v). Ibuprofen was detected at wavelength 264 nm. The drug dissolution rate at each sampling point was corrected by the drug content of sieved granules measured by the method as described in “Drug Content.”
Drug ContentSieved granules (1000 mg) were dissolved in 200 mL of 2nd fluid for dissolution test indicated in the JP17 to extract ibuprofen. The fluid was centrifuged to obtain clear solution containing ibuprofen. The clear solution was diluted in 25 times using the 2nd fluid for dissolution test to prepare test solution for HPLC analysis. Drug content was measured one time per sample. The contents of ibuprofen were determined by the HPLC method as described in “Drug Dissolution.”
Statistical AnalysisStatistical analysis was conducted using JMP®13 (SAS Institute Inc., Cary, NC, U.S.A.) with a significance level of p < 0.05. Differences among groups were analyzed using one-way ANOVA followed by the Tukey–Kramer test.
Results and Discussion
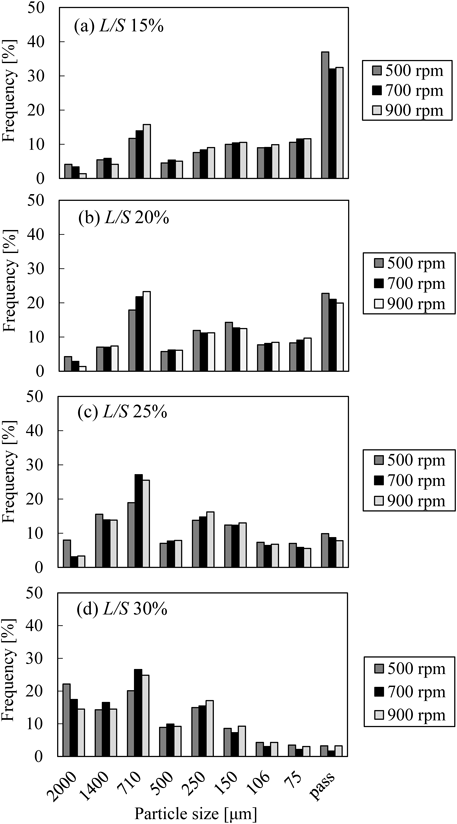
Selection of Representative Sample for AnalysisFigure 3 illustrates the particle size distribution of granules prepared under various manufacturing conditions. The peaks shifted to the larger side with an increase in L/S, and the effect of the screw speed on the particle size distribution was not significant. The immersion type nucleation is considered to occur in the TSG because liquid is added by use of a peristaltic pump.13) Since binder liquid was not distributed to the whole powder with low L/S, small and/or un-granulated fines (<75 µm) still remained. By contrast, the proportion of large granules increased and that of small particles decreased with high L/S, due to more interaction between powder and binder liquid.13)
As seen in Fig. 3, the frequency of particle sizes ranging from 710 to 1400 µm was the highest among almost all of the manufacturing conditions. The drug content of the 12 samples within this particle size fraction ranged from 101.3 to 107.8%. The mean value and coefficient of variation of the samples were 103.0 and 2.0%, respectively. The variation of the samples was considered to be small. Consequently, granules that were sieved through 1400-µm sieve and left on 710-µm sieve were chosen as representative samples.
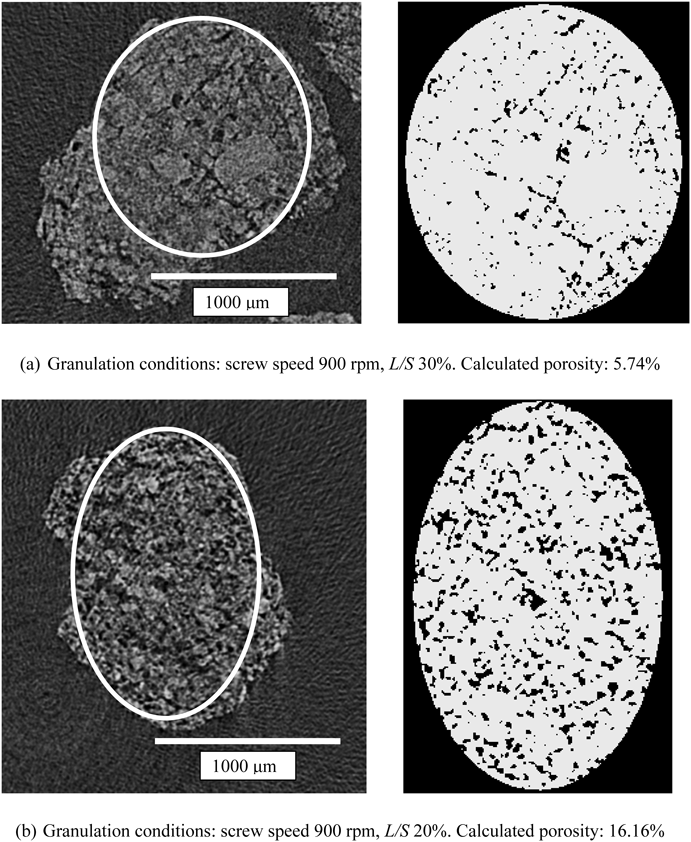
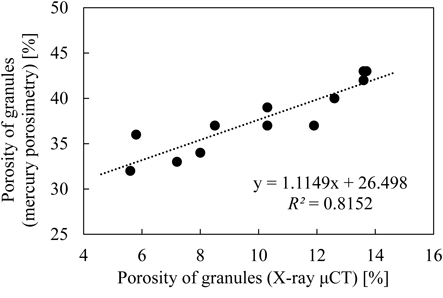
Comparison of the Porosity of Granules Measured by X-Ray μCT with That Measured by a Mercury PorosimeterFigure 4 shows typical cross-sectional images of granules and the corresponding binary images having high and low calculated porosity values. In the binary images, the white regions indicate the matrix of a granule and the black regions are defined as pores (i.e., air regions). To calculate porosity using X-ray μCT, the appropriate threshold index should be determined by visually comparing the cross-sectional images with the corresponding binary images. These figures show that an appropriate threshold index was chosen for the determination of the porosity of granules.
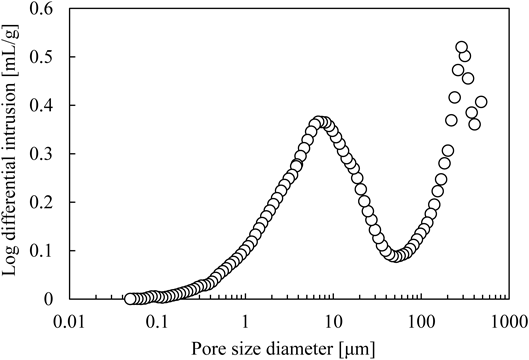
Figure 5 shows an example of pore size distributions measured by mercury porosimetry. Granules which were produced under the condition of screw speed 900 rpm and L/S 15% were measured. It can be seen that the distribution is bimodal. As the pressure was increased, mercury was intruded into the void space between granules. After the void space was filled with mercury, mercury was then intruded into the pores with an increase in the pressure. Both the void space between granules and the pores were considered to be measured by mercury porosimetry. Therefore, the pore volume and the volume of bulk granules were calculated by the manual data manipulation to exclude the estimated void space between granules. In Fig. 5, the pores larger than the minimum turning point (approximately 50 µm) were estimated to be the void space between granules. Thus, the pore volume was calculated by the pores ranging from 0.05 to 50 µm. The volume of bulk granules was computed by the pores ranging from 480 µm, which corresponded to pore size at the initial pressure, to 50 µm. Likewise, the porosity of all samples was determined.
Figure 6 depicts the relationship between the porosity of granules measured by X-ray μCT and that measured by mercury porosimetry, showing linear correlation but different values. By use of X-ray μCT, pores smaller than the resolution of the measurement (approximately 6 µm in this study) could not be detected. In addition, Farber et al.16) mentioned in their report that in samples with high porosity, the original cross-sectional images have relatively low signal-to-noise ratio, which results in an uncertainty of up to 10% in porosity calculation. Since bulk sample is measured using mercury porosimetry, it is said that it cannot distinguish inter-granule voids from inner-granule voids.17) In this study, the void space between granules within the bulk sample was separated by the manual data manipulation. However, all of the void space may not be excluded. By contrast, only inner-granule voids were analyzed by X-ray μCT. Due to these reasons, the data sets obtained by the two methods showed the different values.
In the present study, the porosity of granules measured by X-ray μCT was used for further analysis, because of the linear correlation with the results obtained by mercury porosimetry and the advantage of ability to evaluate the porosity of an individual granule.
Porosity Analysis of Granules Prepared by TSGFigure 7 indicates the porosity of granules measured by X-ray μCT as a function of L/S. The porosity of granules decreased from 11–14 to 6–7% with an increase in L/S, while the standard deviation (S.D.) of the porosity of an individual granule decreased from 4–5 to 2%. As a result of statistical analysis, significant difference was not detected among the samples prepared with different screw speeds at a certain L/S. This was due to the very short residence time of the TSG.5) By contrast, significant difference was detected among the samples prepared with different L/S at a certain screw speed (p < 0.05; significance is shown by an asterisk in Fig. 7). These results indicated that L/S significantly affected the porosity of granules prepared by the TSG. The effect of the L/S on the porosity of granules was further investigated.
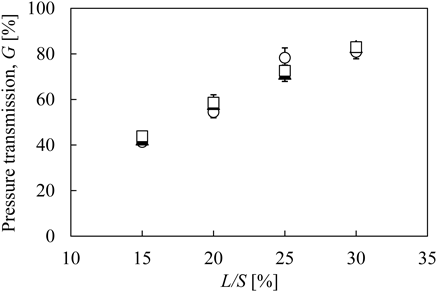
Figure 8 shows the relationship between L/S and pressure transmission, G. This figure shows that G increases with an increase in L/S. Watano et al.20–22) mentioned the relationship between G and liquid dispersion in wet kneaded masses. In their reports, they showed that G increased as the kneading time extended, which was correlated to an increase in liquid dispersion with elapsed time.20–22) They also showed that G increased linearly as moisture content increased.23) They mentioned that the liquid dispersion directly affects G for both kneading time and moisture content change.23) Therefore, increasing G value indicated that the liquid dispersion in the wet granules progressed with an increase in L/S. Using a near-infrared chemical imaging technique, Vercruysse et al.6) demonstrated that the liquid distribution in the TSG became more homogeneous when L/S increased. This result agreed with our observation that G increased with an increase in L/S.
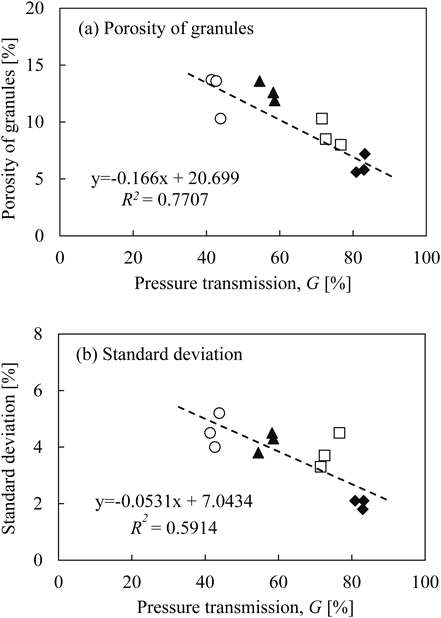
Figure 9 illustrates the relationship between the porosity of granules and G, measured by the compression tester. The porosity of granules and the S.D. decreased with an increase in G. As discussed in regard to Fig. 8, these results indicate that the porosity of granules was related to the liquid dispersion in the wet granules.
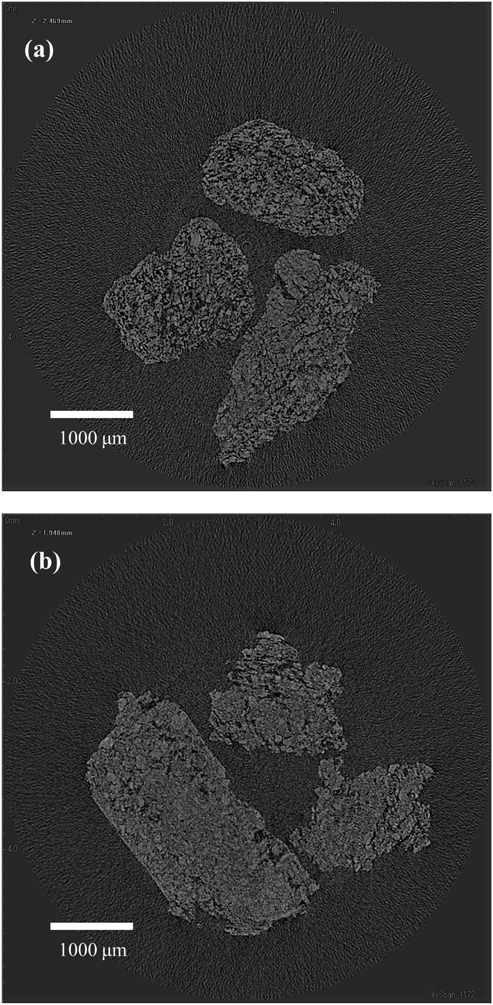
Figure 10 shows cross-sectional images of granules prepared with low L/S (15%) and high L/S (30%). Screw speed was 700 rpm. Many pores can be seen in the granules prepared with low L/S. By contrast, small number of pores and relatively large matrix regions can be seen in the granules prepared with high L/S. These figures obviously indicate that the granules were highly densified with an increase in L/S.
Based on these results, the relationship between L/S and the porosity of granules can be explained as follows: when L/S was low, since the powder was excess to the liquid, the liquid in the wet granules was locally isolated or non-uniformly distributed, which was expressed by low G value. Because the deformability of the wet granules was low due to the low liquid content, the porosity of granules become high.11,24) The high S.D. of individual granules with low L/S can be explained by non-uniform distribution of liquid, indicated by low G value. When L/S was high, the liquid in the wet granules was distributed more uniformly due to more interaction between powder and liquid, which was expressed by high G value. In contrast to low L/S, both the porosity of granules and the S.D. were low with high L/S due to the high deformability and high pore saturation condition of the wet granules.11,24)
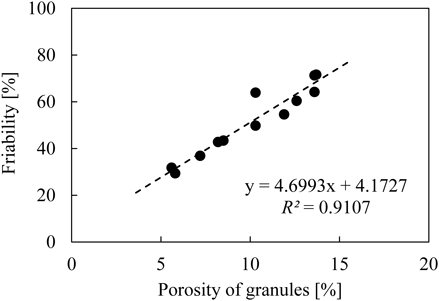
Relationships between Porosity of Granules and Granule PropertiesFigure 11 illustrates the relationship between porosity of granules (X-ray μCT) and granule strength (friability). Good linear correlation was observed between the porosity of granules measured by X-ray μCT and the friability (R2 = 0.9107). As shown in Fig. 10, the granules were more densified with high L/S than with low L/S. The densification process progressed as L/S increased, which can be explained by the increased deformability of wet granules. The densification process allowed the particles to bind each other together. Thus, friability decreased with an increase in L/S, since powder particles bonded more strongly with high L/S than with low L/S.
Figure 12 reveals the drug dissolution profile of the granules prepared under various manufacturing conditions. During the drug dissolution test, the disintegration behavior of the granules was observed (data not shown). The disintegration of granules prepared with low L/S in the test medium was so fast that the original large granules disintegrated to small particles within 15 min. By contrast, granules prepared with high L/S did not disintegrate to small particles, and the large granules remained in the test medium after 15 min. Figure 12 indicates that the drug dissolution was fast from the granules that disintegrated in a short time in the test medium (low L/S), and that the drug dissolution was slow from the granules that disintegrated slowly in the test medium (high L/S). Therefore, the drug dissolution rate in this system was considered to be regulated by a disintegration or breakup step.25,26)
Figure 13 illustrates the relationship between the porosity of granules and the percent dissolution at 15 min. The 15 min time point was selected since we considered that the effect of the porosity of granules on the dissolution rate can be recognized based on the disintegration behavior and the dissolution profile shown in Fig. 12. Good linear correlation between the porosity of granules and the percent dissolution at 15 min was observed (R2 = 0.8834). As shown before, the drug dissolution from the granules was affected by the disintegration behavior of the granules. The correlation between the percent dissolution at 15 min and the porosity of granules can be explained as follows27,28): the granules that show high porosity swell in the test medium at a high rate. As shown in Fig. 10, numerous pores can be seen in the granules that show high porosity. The structure having numerous pores would promote the introduction of the test medium into the granules. A disintegrant in the granules would then swell in the test medium and create inner pressure as its volume is multiplied. The inner pressure would break the granules immediately due to their weak granule strength which was associated with the high porosity value as shown in Fig. 11. The surrounding test medium would then have contacted drug particles, and the drug dissolution rate was high because drug molecules were solvated at the solid/liquid surface. By contrast, the regions of the pores were small in the granules that show low porosity (Fig. 10). The granules that show low porosity would swell in the test medium at a slow rate, and the decreasing contact between the disintegrant and the test medium as well as the high granule strength which was associated with the low porosity value would reduce the inner pressure that breaks up the granules into fragments. That would prevent the surrounding test medium from contacting the drug particles. Thus, the drug dissolution rate was low because the drug molecules were slowly solvated at the solid–liquid surface.
Conclusion
X-Ray μCT was used to analyze granules prepared by a TSG, and the relationships between the porosity of granules and the granule properties were investigated. The porosity of granules measured by X-ray μCT and mercury porosimetry showed linear correlation despite different values, which were attributed to the resolution of X-ray μCT and a low-signal-to-noise ratio of the original cross-sectional images. The porosity of granules was affected by L/S, but not significantly affected by screw speed. Based on the compression test of wet granules and the cross-sectional images, the significant effect of L/S on the porosity of granules can be explained in terms of liquid dispersion and densification of the wet granules. Good linear correlations between the porosity of granules measured by X-ray μCT and granule properties were demonstrated. This result indicates that the drug dissolution rate was regulated by a disintegration (breakup) step in which the porosity of granules plays an important role.
Conflict of Interest
The authors declare no conflict of interest.
References
- 1) Lee S. L., O’Connor T. F., Yang X., Cruz C. N., Chatterjee S., Madurawe R. D., Moore C. M. V., Yu L. X., Woodcock J., J. Pharm. Innov., 10, 191–199 (2015).
- 2) Keleb E. I., Vermeire A., Vervaet C., Remon J. P., Int. J. Pharm., 273, 183–194 (2004).
- 3) Thompson M. R., Sun J., J. Pharm. Sci., 99, 2090–2103 (2010).
- 4) Sayin R., Martinez-Marcos L., Osorio J. G., Cruise P., Jones I., Halbert G. W., Lamprou D. A., Litster J. D., Int. J. Pharm., 496, 24–32 (2015).
- 5) Kumar A., Alakarjula M., Vanhoorne V., Toiviainen M., Leersnyder F. D., Vercruysse J., Juuti M., Ketolainen J., Vervaet C., Remon J. P., Gernaey K. V., De Beer T., Nopens I., Eur. J. Pharm. Sci., 90, 25–37 (2016).
- 6) Vercruysse J., Toiviainen M., Fonteyne M., Helkimo N., Ketolainen J., Juuti M., Delaet U., Van Assche I., Remon J. P., Vervaet C., De Beer T., Eur. J. Pharm. Biopharm., 86, 383–392 (2014).
- 7) Li H., Thompson M. R., O’Donnell K. P., AIChE J., 61, 780–791 (2015).
- 8) Dhenge R. M., Cartwright J. J., Hounslow M. J., Salman A. D., Powder Technol., 229, 126–136 (2012).
- 9) Vercruysse J., Cordoba Diaz D., Peeters E., Fonteyne M., Delaet U., Van Assche I., De Beer T., Remon J. P., Vervaet C., Eur. J. Pharm. Biopharm., 82, 205–211 (2012).
- 10) Liu H., Galbraith S. C., Ricart B., Stanton C., Smith-Goettler B., Verdi L., O’Connor T., Lee S., Yoon S., Int. J. Pharm., 525, 249–263 (2017).
- 11) El Hagrasy A. S., Hennenkamp J. R., Burke M. D., Cartwright J. J., Litster J. D., Powder Technol., 238, 108–115 (2013).
- 12) Lute S. V., Dhenge R. M., Hounslow M. J., Salman A. D., Chem. Eng. Res. Des., 110, 43–53 (2016).
- 13) Verstraeten M., Van Hauwermeiren D., Lee K., Turnbull N., Wilsdon D., Am Ende M., Doshi P., Vervaet C., Brouckaert D., Mortier S. T. F. C., Nopens I., De Beer T., Int. J. Pharm., 529, 678–693 (2017).
- 14) Matsui Y., Watano S., J. Soc. Powder Technol. Japan, 55, 86–94 (2018).
- 15) Lee K. T., Ingram A., Rowson N. A., Powder Technol., 238, 91–98 (2013).
- 16) Farber L., Tardos G., Michaels J. N., Powder Technol., 132, 57–63 (2003).
- 17) Crean B., Parker A., Le Roux D., Perkins M., Luk S. Y., Banks S. R., Melia C. D., Roberts C. J., Eur. J. Pharm. Biopharm., 76, 498–506 (2010).
- 18) Bouwman A. M., Henstra M. J., Westerman D., Chung J. T., Zhang Z., Ingram A., Seville J. P. K., Frijlink H. W., Int. J. Pharm., 290, 129–136 (2005).
- 19) Smřcka D., Lesáková V., Dohnal J., Grof Z., Štěpánek F., Chem. Eng. Res. Des., 132, 1131–1142 (2018).
- 20) Watano S., Furukawa J., Miyanami K., Osako Y., Advanced Powder Technol., 12, 427–441 (2001).
- 21) Watano S., Furukawa J., Osako Y., Yasutomo T., Chem. Pharm. Bull., 49, 64–68 (2001).
- 22) Watano S., Okamoto T., Tsuhari M., Koizumi I., Osako Y., Chem. Pharm. Bull., 50, 341–345 (2002).
- 23) Watano S., Yoshikawa T., Osako Y., Tsuhari M., Chem. Pharm. Bull., 51, 751–753 (2003).
- 24) Iveson S. M., Litster J. D., Hapgood K., Ennis B. J., Powder Technol., 117, 3–39 (2001).
- 25) Smrčka D., Dohnal J., Štěpánek F., Eur. J. Pharm. Biopharm., 106, 107–116 (2016).
- 26) Uchimoto T., Iwao Y., Takahashi K., Tanaka S., Agata Y., Iwamura T., Miyagishima A., Itai S., Eur. J. Pharm. Biopharm., 78, 492–498 (2011).
- 27) Melia C. D., Davis S. S., Aliment. Pharmacol. Ther., 3, 223–232 (1989).
- 28) Melia C. D., Davis S. S., Aliment. Pharmacol. Ther., 3, 513–525 (1989).