Current Topics: Regular Articles
A New Method for Classification of Salts and Cocrystals Using Solid-State UV Spectrophotometry
2019 年 67 巻 9 号 p. 945-952
詳細
2019 年 67 巻 9 号 p. 945-952
Salt and cocrystal formulations are widely used as techniques to improve physicochemical properties of compounds. Some spectrometric techniques to distinguish cocrystals from salts have been reported; however, it has not been possible to adapt these formulations with many compounds, because of limitations, high difficulty, and exceptions. Therefore, we focused on the possibility of UV spectrometry, which had not been reported as a classification technique for salts and cocrystals. The integration values of solid-state UV/visible (Vis) spectra of indomethacin salts were larger than those of physical mixtures of indomethacin and counter molecules, while that of indomethacin cocrystal was not large compared with that of the physical mixture. From these results, differences between a salt and a cocrystal were observed in their solid-state UV/Vis absorption spectra for indomethacin complexes. Therefore, it is suggested that solid-state UV/Vis absorption spectra can be used as a new technique to classify salts and cocrystals.
It is often necessary to improve physicochemical properties of a compound, such as the solubility, since the number of drug candidates categorized in the Biopharmaceutics Classification System (BCS) as class 2 and class 4 has been increasing recently.1) Development of a salt formulation is one of the most popular techniques to improve physicochemical properties of a compound, and many drugs having a salt formulation as drug substance are approved.2–7) However, salt forms are not adopted to neutral compounds, since they require that the compound has some dissociative group.8) In addition, the number of counter molecules that can be used to form salts is small, because their safety information and approval records as salts are considered in use as pharmaceutical salts.9) Thus, the adaptation of salts to compounds has been limited.
Recently, cocrystal formulation was reported as a technique to improve physicochemical properties such as solubility, stability, and bioavailability, as with salt form.10–17) Cocrystals are advantageous in that they do not require that compounds have dissociative group, and there are many candidates for use as cocrystal formers considered as safe.18–21) Therefore, cocrystals can be used widely, and have recently become one of the most noteworthy techniques to improve physicochemical properties.
The U.S. Food and Drug Administration (FDA) issued a guidance regarding cocrystals in 2013,22) and a reflection paper was issued by the European Medicines Agency (EMA) in 2014.23) Thus, an environment for development of cocrystals as an active pharmaceutical ingredient (API) is being prepared. In accordance with the FDA guidance and EMA reflection paper, it is necessary to ensure that an API is a cocrystal. In particular, the FDA guidance requires that cocrystals be discerned from salts. Cocrystals are defined as crystalline materials composed of two or more molecules within the same crystal lattice, as is the case with salts.24–26) However, the interaction of components is different between salts and cocrystals.27,28) In salts, the components are arranged in the crystal lattice predominantly based on ion pairing,8) while in cocrystals, the components are assembled via weak interactions such as hydrogen bond, π–π stacking, or van der Waals interaction.18–21) Therefore, it is possible to distinguish salts from cocrystals using techniques that obtain the differences.
Some kinds of techniques to classify salts and cocrystals have been reported, for example the pKa difference, ΔpKa (pKa (base)-pKa (acid)). Generally speaking, a compound for which ΔpKa >3 is a salt and one for which ΔpKa <1 is a cocrystal.29–31) Furthermore, the occurrence of proton transfer, which means salt, is avoidable under low ΔpKa.32,33) This method is very useful, and need not use any sample. However, with this technique it is difficult to ensure the salt/cocrystal nature of some compounds such as neutral compounds. Single-crystal X-ray diffraction is the most effective method to distinguish salts from cocrystals.34) However, this method requires a single crystal, which is often difficult to obtain. Therefore, techniques that do not require a single crystal were studied. Solid NMR spectrometry was reported as a technique for the classification of salts and cocrystals, and gives information of the location of non-ionic interaction.35) However, this method is based on experience rather than rationale. Raman spectrometry and IR spectrometry are also used, but require that the compound has a carbonyl group.36) Thus, spectroscopic techniques are used widely to classify salts and cocrystals, but there are restrictions in their adaptation.
The use of UV/visible (Vis) spectrometry has not been reported as a classification method of salts and cocrystals. UV spectroscopy provides information on the excitation wavelength of compounds and on difference of chemical structure of compounds. In addition, changes of energy levels of electrons, which are characteristically related to ionizing properties, can be detected by UV spectroscopy. In this study, we focused on UV/Vis spectrometry for use in the classification of salts and cocrystals.
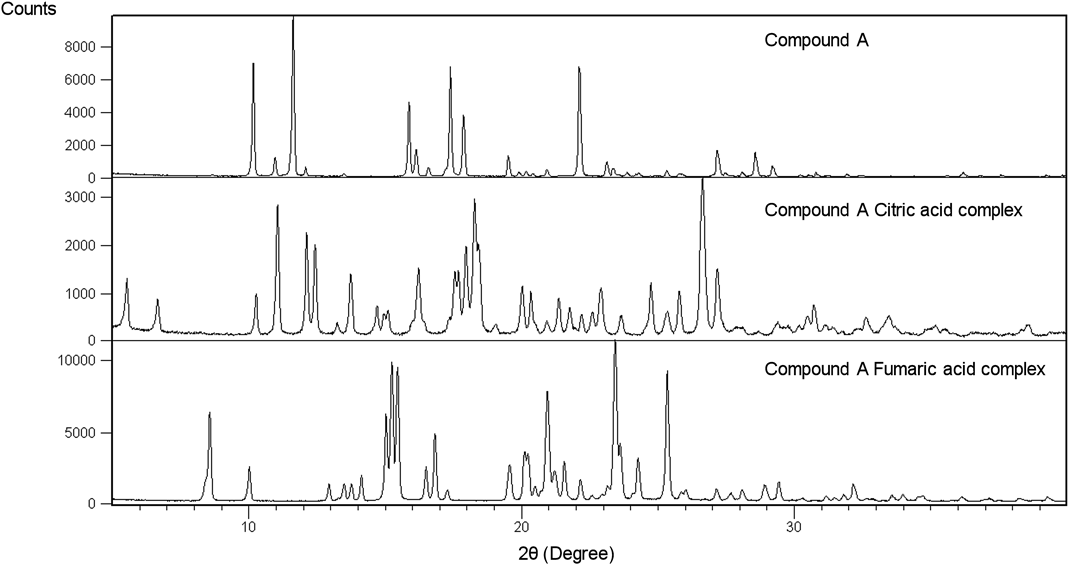
Indomethacin, saccharin, L-arginine, meglumine citric acid, fumaric acid, and barium sulfate were purchased from FUJIFILM Wako Pure Chemical Corporation (Osaka, Japan). L-Lysine and tromethamine (TRIS) were purchased from Tokyo Chemical Industry Co., Ltd. (Tokyo, Japan). Compound A (Fig. 4) and its complexes were synthesized at Sumitomo Dainippon Pharma Co., Ltd. Methanol and toluene were purchased from Nacalai Tesque (Osaka, Japan). Dimethylsulfoxide-d6 with 0.03% tetramethylsilane (TMS) for NMR was purchased from Cambridge Isotope Laboratories, Inc. (MA, U.S.A.). The other solvents and reagents used were purchased from FUJIFILM Wako Pure Chemical Corporation. Water was obtained from a Milli-Q gradient system (Merck, NJ, U.S.A.).
Preparation of ComplexesIndomethacin and stoichiometric (1 : 1) counter molecules were dispensed into separate vials, and solvents were added and mixed. The following solvents were selected used for each complex, based on the literature37): 2-propanol/water (9 : 1) was used for indomethacin arginine complex; ethanol for indomethacin saccharin complex and indomethacin lysine complex; toluene for indomethacin meglumine complex; and acetonitrile for indomethacin TRIS complex. These solutions were heated at 80°C, stirred for 10–30 min, and then shaken with a shaking incubator for 24 h at 25°C. Solvents were removed from the vials by gradually opening the cap of the vial, and collected powders were filtered.
Compound A and stoichiometric (1 : 1) counter molecules were dispensed into separate vials, and ethylacetate was added and mixed. These solutions were shaken with a shaking incubator for 4 h at 40°C. Solvents were removed from the vials by gradually opening the cap of the vial, and collected powders were filtered.
Powder X-Ray Diffraction (PXRD) MeasurementPXRD patterns were obtained with a D8 ADVANCE X-ray diffractometer (Bruker, MA, U.S.A.) at room temperature. X-rays were generated with Cu-Kα radiation at 40 kV and 40 mA. IMC samples were placed on reflection-free sample plates. Data were collected from 5 to 40° (2θ) with a step size of 0.015° and time per step of 0.25 s.
1H-NMR Spectrometry1H-NMR spectra were obtained with an AV400M NMR system (Bruker) equipped with a 5-mm spinner at room temperature. Approximately 1 to 5 mg of each indomethacin complex was dissolved to 0.75 mL of dimethylsulfoxide-d6 with 0.03% TMS or methanol-d4, and the solution was inserted to an NMR tube separately. The number of accumulations was 16 to 256. Phase correction was performed manually for each spectrum, and baseline correction was applied over the entire spectral range. All spectra were referenced to the TMS resonance at 0 ppm and methyl proton of methanol at 3.3 ppm.
Solid-State 15N-NMR SpectrometrySolid-state 15N-NMR spectra were obtained with a 400 MR DD2 system (Agilent, CA, U.S.A.) equipped with a 4-mm spinner at room temperature. The NMR tubes were tightly filled with powder samples. This experiment was run with MAS rotation speed of 12 kHz, and cross-polarization contact time of 10 ms. To optimize the signal sensitivity, delay time was adjusted to 5 or 10 s. Data were collected for 46 or 92 h. Phase correction was performed manually for each spectrum, and baseline correction was applied over the entire spectral range. All spectra were referenced to the 15N-glycine resonance at −347.5 ppm.
UV SpectrometrySolid-state UV/Vis absorption spectra were obtained with a UV-2450 system (Shimadzu, Kyoto, Japan) equipped with an integrating sphere unit (ISR-240, Shimadzu) at room temperature. The samples were placed in sample cells. Barium sulfate was used as the reference standard. The spectra were acquired with a 0.5-nm sampling pitch in the wavelength range from 200 to 800 nm. The obtained reflection data were converted to absorption data using the Kubelka–Munk function.
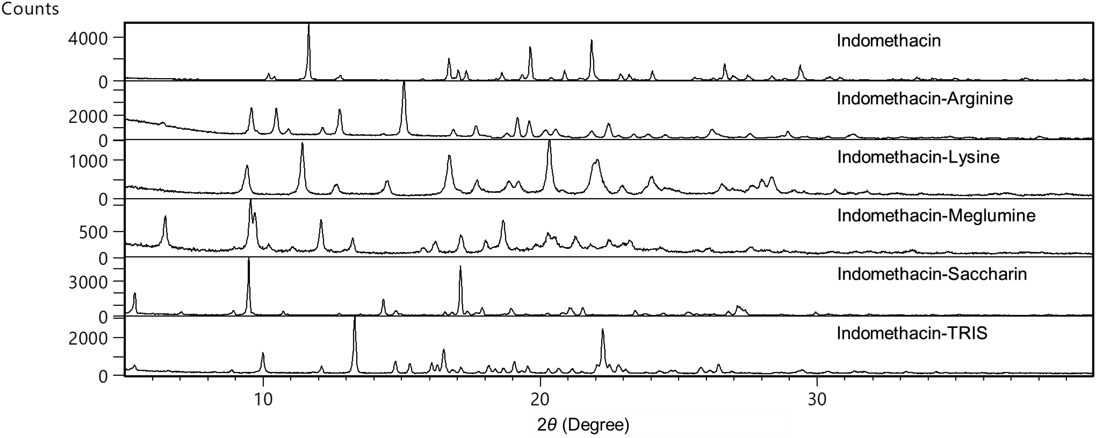
The PXRD patterns obtained for indomethacin complexes are shown in Fig. 1. The pattern for each complex and each counter molecule was different from that of indomethacin gamma form, which was the initial crystal form. These patterns were also not in correspondence with that of indomethacin alpha form. In addition, no diffraction peaks derived from residual indomethacin free form and counter molecules were observed. The PXRD pattern of indomethacin saccharin complex was the same as that of a previous report.38) For the other complexes, except for indomethacin TRIS complex, only one crystal form of each was reported.36,37) Therefore, each complex was not just a physical mixture of indomethacin and each counter molecule, but a salt or a cocrystal. These complexes were not solvates, since residual solvents that were used in preparing the complexes were not detected in 1H-NMR spectrum of any complex.
The stoichiometry of these complexes, based on their 1H-NMR spectra, is shown in Table 1. Indomethacin saccharin complex was demonstrated as a cocrystal and indomethacin meglumine complex was categorized as a salt in previous reports.37,38) The pKa difference (ΔpKa) is used as one of the classification methods between salts and cocrystals. Generally, complexes with ΔpKa >3 are salts.39) Regarding indomethacin arginine complex, the ΔpKa between indomethacin and arginine is 9.0, as shown in Table 2. This suggests that indomethacin arginine complex is a salt. Indomethacin lysine complex and indomethacin TRIS complex are also salts, because their ΔpKa values are >3.
| Sample | Stoichiometry (Freebase : Counter molecule) |
|---|---|
| Indomethacin–Saccharin | 1 : 1 |
| Indomethacin–Meglumine | 1 : 1 |
| Indomethacin–Arginine | 1 : 1 |
| Indomethacin–Lysine | 1 : 1 |
| Indomethacin–TRIS | 1 : 1 |
| Compound A–Citric acid | 2 : 3 |
| Compound A–Fumaric acid | 2 : 1 |
| Sample | pKa | ΔpKa ((pKa(base)-pKa(acid)) |
|---|---|---|
| Saccharin | 1.3a) | −2.9 |
| Meglumine | 8.03b) | 3.8 |
| L-Arginine | 13.2b) | 9.0 |
| L-Lysine | 10.93b) | 6.7 |
| TRIS | 8.02b) | 3.8 |
| Indomethacin | 4.2a) | — |
| Citric acid | 3.128b) | 0.9 |
| Fumaric acid | 3.03b) | 1.0 |
| Compound A | 4.05c) | — |
a) Alhalaweh A., Roy L., Rodriguez-Homedo N., Velaga S. P., Mol. Pharmaceutics, 9, 2605–2612 (2012). b) Handbook of Pharmaceutical Salts, 334 and 342. c) Calculated by ADMET Predictor ver. 7.2
The solid-state 15N-NMR spectra of each compound and each indomethacin complex, including saccharin, meglumine, and arginine, are shown in Fig. 2. The spectra in Fig. 2, except for 2C and 2F, have a somewhat high degree of noise because of difference of relaxation time for the compounds. The chemical shift of a signal derived from indomethacin was observed around −207 ppm in each indomethacin complex. In indomethacin saccharin complex, the signal derived from saccharin was shifted from −226 to −230 ppm, as seen in Figs. 2A and 2B. Based on this, the interaction site between indomethacin and saccharin was identified as carboxyl group of indomethacin and nitrogen of isothiazole of saccharin. In indomethacin meglumine complex, the signal derived from meglumine was shifted from −358 to −348 ppm, as seen in Figs. 2C and 2D. Based on this, the interaction site between indomethacin and meglumine was identified as carboxyl group of indomethacin and amine of meglumine. In indomethacin arginine complex, the signal derived from arginine was shifted from −349 to −341 ppm, as seen in in Figs. 2E and 2F from which the interaction site between indomethacin and arginine was identified as carboxyl group of indomethacin and α amine of arginine. The value of the chemical shift difference between each complex and each counter molecular related to interaction is shown in Table 3. In addition, the chemical shift difference of each 15N-NMR spectra was not larger than 60 ppm. Based on this, all indomethacin complexes were classified as cocrystals.35)

| Sample | Chemical shift difference (ppm) |
|---|---|
| Indomethacin–Saccharin | 3.9 |
| Indomethacin–Meglumine | 4.0 |
| Indomethacin–Arginine | 9.7 |
| Compound A–Citric acid | 72.2 |
| Compound A–Fumaric acid | 26.4 |
Regarding compound A fumaric acid complex (Fig. 3), the signal derived from N of imine was shifted from −132.3 to −158.8 ppm, as seen in Fig. 4. On the other hand, in the case of compound A citric acid complex (Fig. 3), the signal derived from N of imine was shifted from −132.3 to −202.8 ppm (Fig. 4). Based on this, compound A fumaric acid complex and compound A citric acid complex were classified as a cocrystal and a salt, respectively.35)

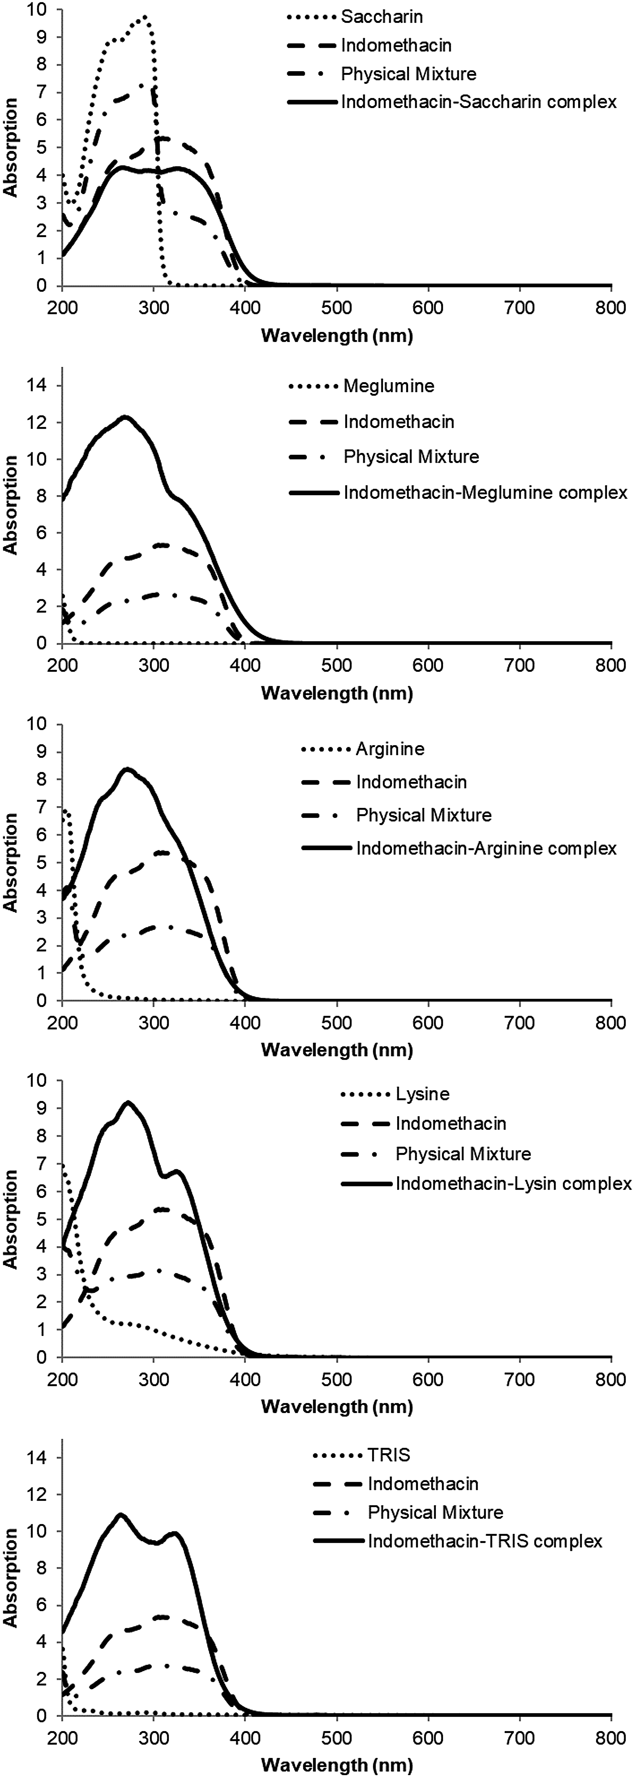
The solid-state UV/Vis absorption spectra of each complex and each physical mixture of freebase and a counter molecule are shown in Fig. 5. The solid-state UV/Vis spectra of physical mixtures was calculated from the spectra of freebase and a counter molecule, based on the stoichiometry of freebase and a counter molecule for a complex. The calculated spectra for physical mixtures were obtained because the solid-state UV/Vis spectra were obtained by a reflection method and it was difficult to create a uniform sample surface for physical mixtures. The solid-state UV/Vis absorption spectrum of a complex was different from that of a physical mixture for all complexes. In addition, the solid-state UV/Vis absorption spectrum of a complex was different from that of freebase and a counter molecule for all complexes. The integrated UV absorption of indomethacin saccharin complex was smaller than that of the physical mixture in the range from 200 to 306 nm, but was larger than that of the physical mixture in the range over 306 nm. Indomethacin meglumine complex and indomethacin arginine complex had larger absorption than their physical mixture in the range over 200 nm, as shown in Fig. 5. In addition, UV spectra of compound A complexes were changed from the respective physical mixtures, as shown in Fig. 6. Therefore, it is also possible to ensure the formulation of complex based on the solid-state UV/Vis absorption spectra. The difference between complexes and physical mixtures in solid-state UV/Vis absorption spectra indicates the conformation change of freebase and counter molecules and the formation of interaction between freebase and counter molecule such as hydrogen bond and ionic bond.

The integral value of UV spectra of each complex and each physical mixture is shown in Table 4. The integral value of solid-state UV/Vis absorption spectrum for indomethacin saccharin complex and compound A fumaric acid complex were not larger than that of physical mixture of freebase and each counter molecule. On the other hand, with regard to the other indomethacin complexes and compound A citric acid complex, the integral value of solid-state UV/Vis absorption spectrum for each complex was larger than that of physical mixture of freebase and each counter molecule.
| Sample | Integral value of UV spectrum (200–800 nm) | |
|---|---|---|
| Complex | Physical mixture | |
| Indomethacin–Saccharin | 1328.2 | 1557.6 |
| Indomethacin–Meglumine | 2098.6 | 899.2 |
| Indomethacin–Arginine | 3384.5 | 796.0 |
| Indomethacin–Lysine | 2352.2 | 1066.6 |
| Indomethacin–TRIS | 2904.0 | 849.1 |
| Compound A–Citric acid | 175.6 | 149.0 |
| Compound A–Fumaric acid | 163.4 | 430.9 |
In the solid-state UV/Vis absorption spectra of indomethacin complexes with saccharin, meglumine, arginine, lysine, and TRIS, and compound A complexes with fumaric acid and citric acid, differences from the initial, which was a physical mixture of freebase and a counter molecule, were observed in the intensity and the shape. Specifically, the integral value of solid-state UV/Vis absorption spectrum for indomethacin saccharin complex was similar to that of physical mixture of indomethacin and saccharin, and that of compound A fumaric acid complex was smaller than that of physical mixture of freebase and fumaric acid. On the other hand, the integral values of solid-state UV/Vis absorption spectra for the other indomethacin complexes and compound A citric acid complex were larger than those of physical mixture of freebase and each counter molecule. Based on these results, indomethacin saccharin complex was determined as a cocrystal, and indomethacin meglumine complex was reported as a salt. Compound A fumaric acid complex and compound A citric acid were demonstrated as a cocrystal and a salt, respectively, based on the solid-state 15N-NMR spectra. This suggested that the difference was related to whether a complex was a salt or a cocrystal. The structural difference between salts and cocrystals lies in the interaction style between an active ingredient and a counter molecule. Salts have ionic interaction in the compounds, while cocrystals have nonionic interaction such as hydrogen bond, van der Waals force, and π–π stacking in the compound. Considering the difference between ionic interaction and nonionic interaction, it may be suggested that this phenomenon is caused by strength of interaction or charge transfer. Regarding indomethacin arginine complex, indomethacin lysine complex, and indomethacin TRIS complex, as shown in Table 2, the pKa difference between indomethacin and counter molecules are 9.0, 6.7, and 3.8, implying they are salts, generally. In the solid-state UV/Vis absorption spectra, the integral value for the complex was larger than the value for the physical mixture of indomethacin and each counter molecule. This result indicated that indomethacin arginine complex, indomethacin lysine complex, and indomethacin TRIS complex were salts, and corresponded to the result based on pKa and the results of Raman spectra.
From the results of solid-state 15N-NMR spectra, three indomethacin complexes were classified as cocrystals. Indomethacin saccharin complex was reported as a cocrystal, and this also corresponded with the result of solid-state UV/Vis absorption method. On the other hand, indomethacin meglumine complex was classified as a salt based on ΔpKa between indomethacin and the counter molecule, and on the result of Raman spectrum.36) This suggested that it was difficult to adapt the classification method by solid-state 15N-NMR spectra to all of the indomethacin complexes. On the other hand, as we mentioned above, the classification result of solid-state UV/Vis absorption method corresponded with the results of the other methods. Therefore, the method using solid-state UV/Vis absorption spectra is more useful for classifying a complex as a salt or a cocrystal compared to solid-state 15N-NMR spectra, at least in the case of indomethacin complexes.
The classification method by solid-state UV/Vis absorption spectra requires that samples are solids, because the evaluation is carried out with solid-state UV/Vis spectra of an active agent, a counter molecule, and a complex. Thus, it is not possible to adopt complexes that have a counter molecule such as hydrochloric acid, nitric acid, and acetic acid. However, this classification method does not require the sample to be a single crystal. Therefore, in the case of a complex for which a single crystal was not obtained, this method offers a suitable means in addition to other spectrometric techniques such as solid-state NMR, IR, and Raman spectrometry. In addition, this method can be adopted to complexes regardless of their specific chemical structure. Therefore, this solid-state UV/Vis classification method can provide key information on complexes without a single crystal, and is not limited to specific chemical structures.
In indomethacin complexes, differences between salts and cocrystals were observed in solid-state UV/Vis absorption spectra. The same tendency was observed in compound A complexes. Classification results obtained using this method corresponded to the results obtained using other techniques, such as ΔpKa and single-crystal X-ray diffraction. This classification method requires that a free form, a counter molecule, and a complex are solid, but it is not necessary to obtain a single crystal of a complex. Moreover, this method can be adapted to various compounds, irrespective of their chemical structures. Therefore, this method may provide key information to classify salts and cocrystals in the case of compounds without a single crystal or specific type of chemical bond.
We thank Mr. Yoshimizu of Sumitomo Dainippon Pharma Co., Ltd. for helpful discussions during the preparation of this manuscript, and Mr. Ueda of Sumitomo Dainippon Pharma Co., Ltd. for collecting the solid-state 15N-NMR spectra reported in this paper.
The authors declare no conflict of interest.