Abstract
We investigated the water contents in commercial semi-solid preparations used for pressure ulcer (PU) treatment using near-IR spectroscopy (NIRS) and compared the results with those measured using the Karl Fischer (KF) method. The aim of this study was to determine a standard method and select the appropriate topical preparation with the optimal moisture for PU treatment. The water absorption properties of bases and formulations were evaluated with a time-dependent factor using Transwell as the model membrane. KF and NIRS were applicable as measurement methods of the water content in semi-solid formulations. NIRS was shown to be a useful, simple, nondestructive tool that is more advantageous than the KF method. The water absorption characteristics tested using Transwell revealed that the rate of and capacity for water absorption are determined not only by the absorption ability of the polymer base but also by other factors, such as the osmotic pressure exerted by additives. KF and NIR measurements can be used to choose external skin preparations to control the amount of water in PU treatment.
Introduction
Pressure ulcer (PU) is a type of chronic wound caused by continuous pressure and compression of soft tissue anywhere on the body. This complicated wound has varying degrees of severity depending on wound depth, inflammation, granulation, and epithelial tissue transformation and can cause pain and significant expenses for patients and healthcare systems, thus lowering patients’ QOL. PU is prevalent among long-term bedridden patients, the elderly, those who have sustained spinal cord injuries, and the acutely ill. PU can be managed by a range of approaches from adjusting basic positioning surfaces, nutrition, and infection control; to conventional treatment using dressings, wound-bed preparation, topical therapy, and establishment of a moist wound-healing environment; to advanced debridement and surgery.1,2)
The primary purpose of conventional treatment is to prevent infection and allow the affected tissue to regenerate using external preparations that can be well controlled by the wet environment of the tissue in the wound during healing. Appropriate selection of an external skin preparation to treat PU with consideration of the moisture content in the ointment and cream formulations and the amount of exudate greatly affects treatment outcome. A moist wound environment can reduce pain, promote new tissue growth along with autolytic debridement, and facilitate collagen production to accelerate wound healing. In addition, a good balance of moisture can also inhibit matrix-destroying enzymes, which helps the wound matrix healing process.3,4)
Topical preparations, such as polyethylene glycol, povidone iodine-sugar ointment, cadexomer iodine ointment, and iodine ointment, which contain a water absorbent/water-soluble base, are used for wounds with large amounts of exudate. For wounds with small amounts of exudate, tretinoin tocopheryl ointment and a cream formulation containing sulfadiazine silver are used. These products contain various amounts of water in their formulations and can exhibit different water-absorbing properties, thus affecting the PU healing process. The moisture content and water absorption capability of the formulations have been evaluated by various methods,5–8) such as using a Franz diffusion cell and agarose gel with calculations based on the weight change of whole samples. However, the test methods are not standardized; thus, the values obtained are not comparable among preparations. In addition, no methods for the direct measurement of the water content in semi-solid formulations have been developed and reported.
The water content is generally determined by the Karl Fischer (KF) and near-IR (NIR) spectroscopy (NIRS) method. The KF method directly quantifies the moisture content in pharmaceuticals as listed in the Japanese Pharmacopoeia.9,10) It involves a titration technique utilizing the chemical reaction between water and iodine at a constant molar ratio under certain conditions and assessing the absolute value of the water content in the sample. It is difficult to use KF as an analytical method to analyze the time-dependent characteristics of water absorption since the analytic procedure is not simple and is destructive. On the other hand, NIRS has recently been used quantitatively in the quality control of pharmaceutical preparations,9–17) quantification of active pharmaceutical ingredients or excipients,12,15,16) and measurement of the water content in food, pharmaceutical, and industrial products.9,10,18–20,22) NIRS is more advantageous and user-friendly than KF as it is a simple, rapid, nondestructive analytical method.
NIRS irradiates a substance with near-IR light and yields the absorption peak derived from a bond of chemical structures in the substance. NIRS can analyze samples without the need for pre-preparation because it uses weaker absorption peaks from the overtone and combinations caused by stretching or deformation of C–H, N–H, and O–H bonds in the NIR region. The peaks near 5200 and 6900 cm−1 are derived from water molecules and are assigned to the combination of the O–H stretching vibration and deformation and the first overtone of O–H stretching, respectively.21) Using these peaks, the water content in the substance can be determined. In some cases, since the NIR spectrum is full of absorption bands, mathematical treatment may be required to extract key information from the spectrum.11,21)
The methods mentioned have been widely applied to solid formulations; however, to the best of our knowledge, there are few reports on utilizing NIRS in semi-solid formulations such as ointments and creams. Inoue et al. reported an evaluation of the water content in semi-solid formulations using NIRS and KF.23,24) However, investigations based solely on quantitative analysis could be insufficient. Many additives are generally contained in commercial preparations, which may affect water measurement. In this study, we attempted to measure the water content in commercial semi-solid preparations for PU treatment using NIRS and compared the results with those measured using the KF method to investigate the utility of the two methods. Furthermore, the water absorption characteristics of bases and formulations may affect the healing process, and therefore the water absorption properties were evaluated with a time-dependent factor using Transwell as the model membrane. We aimed to determine a standard method and select the appropriate topical preparation with optimal moisture for PU treatment.
Experimental
MaterialsMacrogol ointment (MGL, Nikko Pharmaceutical Co., Ltd., Gifu, Japan), Actosin ointment (ACT, Maruho Co., Ltd., Osaka, Japan), U-Pasta Kowa ointment (UPT, Kowa Co., Ltd., Tokyo, Japan), Iodocoat ointment (IOD, Maruho Co., Ltd.), Cadex ointment (CDX, Smith & Nephew Co., Ltd., London, U.K.), Olcenon ointment (OLC, Mitsubishi Tanabe Pharma Co., Ltd., Osaka Japan), and Geben cream (GBN, Pola-Pharma Co., Ltd., Tokyo, Japan) were used as semi-solid formulations. Transwell (Corning Co., Ltd., New York, U.S.A.) was used for the water absorption study.
Sample PreparationWater was added to each sample at various ratios up to 85% and adjusted based on the total weight of 5 g. Then, water was added and used for a water addition recovery examination. Samples that did not become uniform when mixed were mixed further using an NRJ-250 rotation/revolution mixer (Thinky Co., Ltd., Tokyo, Japan) at 2000 rpm for 30 s.
Measurement of Water Content Using the KF MethodThis experiment was conducted via the coulometric titration method at room temperature. A sample (3–5 mg) was weighed on a parafilm cut to 1 cm2 and inserted into the reactor chamber of a KF aquameter (Aquacounter AQ-7, Hiranuma Sangyo Co., Ltd., Ibaraki, Japan) filled with KF reagent, generator electrolyte (Aqualyte RO, Hiranuma Sangyo Co., Ltd.), and counterelectrolyte (Aqualyte CN, Hiranuma Sangyo Co., Ltd.) at a titration rate of 0.6 mg H2O/min. Measurements were performed in triplicate. The average values were used to plot against the adjusted water content in each sample.
Measurement of Water Content Using NIRSNIR transmission spectra were acquired using a Spectrum One NTS spectrometer with an optical path length of 0.2 mm (PerkinElmer, Inc., Waltham, MA, U.S.A.) equipped with an Omni Cell system used for mulls (Specac, Inc., Cranston, RI, U.S.A.). A wavenumber resolution of 8 cm−1 was employed, and 32 scans across a wavelength range of 4000–12000 cm−1 were collected. The spectrum of an empty cell was used as the background. Each sample was measured in triplicate. The height of the peak at 5200 cm−1 was plotted against the adjusted water content after second derivative treatment.
For samples showing poor linearity in transmission mode, the NIR diffusion reflection mode was applied using the same unit. A wavenumber resolution of 8 cm−1 was employed, and 32 scans in the range of 4000–12000 cm−1 were collected under ambient conditions. The spectrum of an empty cell was used as the background. Each sample was measured in triplicate. Kubelka-Munk transformation was applied to the spectra obtained before plotting the height of the peak at 5200 cm−1 against the adjusted water content.
Effects of Glycerin on the NIR SpectrumTen grams of each hydrophilic cream with various amounts of glycerin (GLY) were prepared (Table S-1). Each sample consisted of 2.5 g of white petrolatum, 2.0 g of stearyl alcohol, 0.4 g of polyoxyethylene hydrogenated castor oil, and 0.1 g of GLY monostearate and was mixed in a hot bath at 70°C. (mixture A). Water and GLY were mixed at the ratio shown in Table S-1 and added to mixture A. Then, the mixture was stirred until it cooled to room temperature. Instead of GLY, polyethylene glycol (PEG400) was used to prepare a hydrophilic cream as the control group. The water content in the samples was measured by KF titration and the NIR method. The NIR diffusion reflection mode was used under the same conditions as described in the previous section.
Evaluation of Water Absorption CharacteristicsThe water absorption characteristics with a time-dependent factor were evaluated using Transwell, which has a thin polyester membrane. The membrane diameter was 24 mm and its pore size was 0.4 µm. Two grams of the sample were spread in the cell, and 1000–2000 mL was added to the acceptor cell. The cell was then left in contact with water for 0 to 180 min. The sampling points were at 15, 30, 45, 60, 90, 120, 150, and 180 min. Each sample was evaluated in triplicate and analyzed by KF and NIRS using previously described methods.
Results and Discussion
Measurement of Water Content Using the KF MethodFigure 1 shows the regression lines of the plot between the measurement values against the adjusted water content. The slope of the regression line is an index of the recovery rate (RR) of added water. If the measurement value and adjusted water content are relatively similar, the RR value will be close to 1. The RR and R2 values of all commercial topical preparations are shown in Table 1. All samples showed good linearity, as indicated by the R2 value. However, a low RR value (approximately 0.7) was found for MGL and ACT, which contain PEG. It is possible that PEG can inhibit the KF reaction constantly, and therefore the R2 value remained high in the range of 5–20%.
Table 1. Recovery Rate and
R2 Values Measured Using the KF Method and NIR Spectroscopy
| Sample | KF method | NIR spectroscopy |
|---|
| Recovery rate (RR) | R2 | R2 Transmission | R2 Diffusion reflection |
|---|
| A Macrogol ointment (MGL) | 0.7029 | 0.9792 | 0.9943 | — |
| B Actosin ointment (ACT) | 0.7960 | 0.9907 | 0.9994 | — |
| C U-Pasta Kowa ointment (UPT) | 1.0174 | 0.9950 | 0.9743 | — |
| D Cadex ointment (CDX) | 0.9064 | 0.9909 | 0.9509 | — |
| E Iodocoat ointment (IOD) | 0.9248 | 0.9791 | 0.9978 | — |
| F Geben cream (GBN) | 0.9231 | 0.9967 | 0.0840 | 0.9521 |
| G Olcenon ointment (OLC) | 0.9374 | 0.9965 | 0.0364 | 0.6423 |
This good linearity of MGL and ACT illustrated that we can estimate the water content in their formulations using the calibration curve. In contrast, CDX had a low RR value, presumably caused by the water absorption polymer (Cadexomer150) in its formulation. This polymer may not dissolve well in the KF solution, causing the mechanism of water extraction from the polymer structure to be a rate-limiting step during measurement. Changing the measurement conditions can ameliorate this dissolution issue. From these results, the KF titration method is considered to be applicable to the measurement of the water content in semi-solid formulations. Notably, choosing a suitable generator electrolyte to undergo complete dissolution and additional reactions by additives should be taken into account when measuring the water content in commercial formulations.
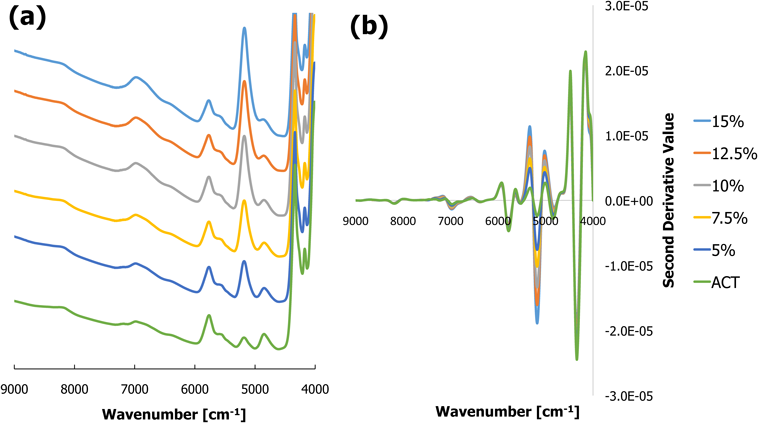
Measurement of Water Content Using NIRSThe NIR spectrum provides full information on the absorption peaks derived from the combination of stretching and deformation of water molecules. Consequently, it is possible to measure the water content using the height of NIR peaks. In terms of transmission mode measurement, the peak at 5200 cm−1 of MGL, ACT, UPT, IOD, and CDX became clearer as the water content increased. For example, the spectra of ACT are shown in Fig. 2a. The spectra of other formulations are shown in Fig. S-1. By applying the second derivative process, the absorption peaks at 5200 cm−1 decreased. The peak height thus becomes lower as the water content increases (Fig. 2b).
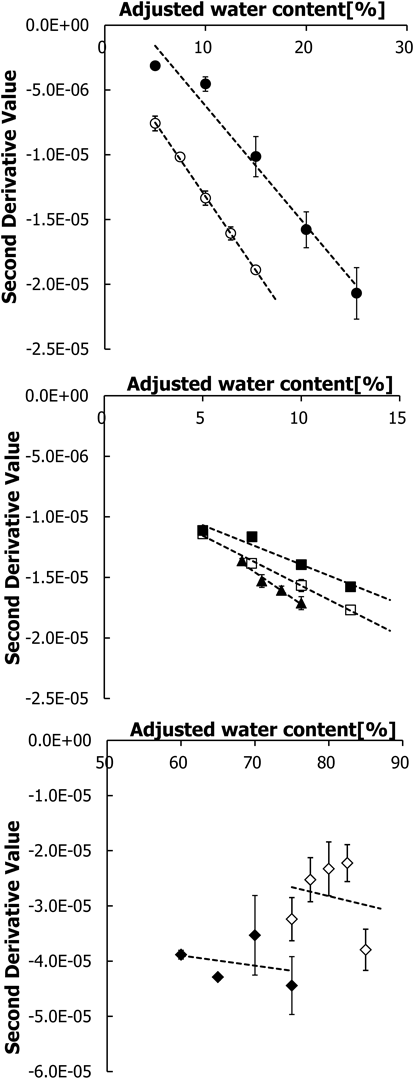
Plots of the peak height of the second derivative spectrum (second derivative value) against the adjusted water content demonstrated good linearity for all 5 samples (Fig. 3). Table 1 shows the R2 value for each formulation. However, OLC and GBN showed poor linearity, possibly due to their cream formulation being composed of an o/w emulsion. An emulsion may scatter the incident beam, decreasing the strength of the beam that reaches the detector, which causes poor measurement in transmission mode. This problem can be solved by changing the measurement to the diffusion reflection mode.
Plots of the second derivative value measured in the diffusion reflection mode vs. the adjusted water content are shown in Fig. 4 and Table 1. Both OLC and GBN showed good linearity and an improved R2 value in the plots of the second derivative value vs. the adjusted water content. In particular, the R2 value of GBN significantly improved and became close to the R2 value of the other formulations that showed good linearity in transmission mode. The correlation of OLC is lower than that of GBN owing to the GLY contained in OLC.
We previously reported that GLY affects the molecular state of water and shifts the peaks derived from water molecules.25) Figures S-2 and S-3 show the effects of GLY on the NIR spectrum shift in hydrophilic creams (model formulation). The absorption peaks originating from water molecules in the spectra of the GLY group were obviously shifted to a lower wavenumber than the control (CTL) group. Additionally, plotting the wavenumber of the peaks against the GLY concentration clearly shows that the peak shifts at 6900 cm−1 were more evident than those at 5200 cm−1 (Fig. S-4, Table S-2). On the other hand, the R2 value of the regression line of the plot of peak heights (second derivative value) against the water content at 6900 cm−1 was lower than that at 5200 cm−1 (Fig. S-5, Table S-2). GLY addition has a direct impact on the peak shift intensity and hence the measurement of the water content at a certain wavenumber. This problem might be solved by using other methods for NIR measurement or using other mathematical treatments to remove the GLY perturbance.
These results indicate that NIRS can be applied to measure the water content in semi-solid formulations. Interestingly, in the case of samples with a high water content of over 85%, it is possible that the peak at 5200 cm−1 is saturated. Therefore, in this case, the peak at 6900 cm−1, which originated from the first overtone of O–H stretching by water molecules, can better represent the amount of water as a weaker absorption than that at 5200 cm−1. Additionally, the exudate component could affect the NIR spectra and thus peak height. These factors are currently under investigation in our laboratory.
Evaluation of Water Absorption CharacteristicsThe water absorption profiles evaluated by the KF method are shown in Fig. 5. The measurement values of MGL, ACT, UPT, IOD, and CDX showed an increase in the water content, suggesting a high absorption rate over the first 60 min. However, OLC and GBN did not show clear absorption. It is possible that OLC and GBN originally had high contents of water. These two formulations were excluded from the following evaluation. Table 2 shows the water absorption rate (slope) in the first 60 min of treatment and the maximum amount of water absorption at the end of the test (MAX). A larger value of the slope can imply a higher rate of absorption. Differences in the rates and capacities of water absorption among the samples were clearly observed. ACT had a 2-fold higher rate and capacity than MGL, even though the same base is used in their formulation. These results indicate that not only the absorption ability of the base but also the osmotic pressure of additives in the formulations play an important role in controlling the water absorption property.
Table 2. Slope of the Rise from the Start of the Test to the Lapse at 60 min and Maximum Amount of Water Absorption at the End of the Test (MAX)
| Samples | Slope | MAX |
|---|
| MGL | 0.2937 | 28.6 |
| ACT | 0.6666 | 52.1 |
| UPT | 0.4629 | 51.5 |
| CDX | 0.3351 | 37.3 |
| IOD | 0.5506 | 53.1 |
Meanwhile, the water characteristics of semi-solid formulations used for PU treatment have been evaluated using various methods. For example, UPT was evaluated by measuring the mass increase in a controlled environment under 97%. with a saturated potassium sulfate aqueous solution atmosphere.7) CDX was evaluated by immersing a sample (placed in a net) in a test solution for 24 h and then measuring the volume of the precipitate.5) IOD is commonly evaluated by applying a sample to gauze, placing it in a centrifuge tube, and adding purified water at room temperature for 24 h before determining the amount of water absorption from the remaining amount of liquid (water).8) However, there are no established standard methods for evaluating water absorption characteristics.
Additionally, the values obtained from thoe various methods are not comparable with those of other samples. Noda et al.6) reported evaluation methods using a Franz diffusion cell and agarose gel. In that investigation, the water absorption capacity of UPT, CDX, and MGL was calculated as the percentage change in weight to be 26 ± 2, 76 ± 5, and 57 ± 5%, respectively.6) Although we can evaluate and compare water absorption properties with this method, we cannot obtain the true water content in such samples since it is calculated indirectly using the absorption weight of PBS. Therefore, a method that can measure the actual water content in formulations directly and allow easier evaluation of formulations is needed. Using the method we developed, the water absorption capacity of MGL, ACT, UPT, IOD, and CDX was found to be 28.6, 52.1, 51.5, 53.1, and 37.3%, respectively. Although we are unable to compare these values with previous ones obtained using other methods, they are still useful and reliable since the two methods allow direct measurement of the water content in samples.
Figure 6 shows the water absorption behaviors measured by NIRS in 5 samples, which exhibited clear absorption in a time-dependent manner. All of the samples had a decrease in the second derivative value with the absorption time (Fig. S-6). These second derivative values were then converted using the regression line, as shown in Fig. 4. The water absorption plots correlated well with those from the KF method. Thus, we are able to evaluate and compare the water absorption characteristics of formulations using Transwell combined with the KF or NIRS method even though the latter analyzes such samples more rapidly than the former method.
Conclusion
This study demonstrated the utility of the KF and NIRS methods in measuring the water content of semi-solid formulations and rapidly evaluating water absorption properties. NIRS was shown to be a useful, simple, nondestructive tool that is more advantageous than the KF method. The water absorption characteristics tested using Transwell revealed that the rate and capacity of water absorption are determined not only by the absorption ability of the polymer base but also by other factors, such as the osmotic pressure exerted by additives. From all of the results, it is concluded that KF and NIR measurements can be used to choose external skin preparations to control the amount of water in PU treatment.
Conflict of Interest
The authors declare no conflict of interest.
Supplementary Materials
The online version of this article contains supplementary materials.
References
- 1) Sanada H., Iizaka S., Matsui Y., Furue M., Tachibana T., Nakayama T., Sugama J., Furuta K., Tachi M., Tokunaga K., Miyachi Y., Wound Repair Regen., 19, 559–567 (2011).
- 2) Whitney J., Phillips L., Aslam R., Barbul A., Gottrup F., Gould L., Robson M. C., Rodeheaver G., Thomas D., Stotts N., Wound Repair Regen., 14, 663–679 (2006).
- 3) Okan D., Woo K., Ayello E. A., Sibbald G., Adv. Skin Wound Care, 20, 39–53, quiz, 53–55 (2007).
- 4) Brem H., Lyder C., Am. J. Surg., 188 (Suppl. 1), 9–17 (2004).
- 5) Kaneko T., Matsumoto K., Furuya Y., Satake M., Ishikura F., Jpn. Pharmacol. Ther., 29, 603–610 (2001).
- 6) Noda Y., Fujii K., Fujii S., Int. J. Pharm., 372, 85–90 (2009).
- 7) Takayama K., Jpn. J. Med. Pharm. Sci., 43, 91–96 (2000).
- 8) Hikake S., J. Pharm. Sci. Technol., 67, 260–265 (2007).
- 9) Kauppinen A., Toiviainen M., Korhonen O., Aaltonen J., Järvinen K., Paaso J., Juuti M., Ketolainen J., Anal. Chem., 85, 2377–2384 (2013).
- 10) Rantanen J., Lehtola S., Rämet P., Mannermaa J.-P., Yliruusi J., Powder Technol., 99, 163–170 (1998).
- 11) Rantanen J., Räsänen E., Tenhunen J., Känsäkoski M., Mannermaa J., Yliruusi J., Eur. J. Pharm. Biopharm., 50, 271–276 (2000).
- 12) Xie Y., Song Y., Zhang Y., Zhao B., Mol. Biomol. Spectrosc., 75, 1535–1539 (2010).
- 13) Miwa A., Makado K., Int. J. Pharm., 376, 41–45 (2009).
- 14) Shikata F., Kimura S., Hattori Y., Otsuka M., Drug Dev. Ind. Pharm., 44, 713–722 (2018).
- 15) Moncada G. W., González M. I., Escuredo O., Fischer S., Míguez M., Talanta, 116, 65–70 (2013).
- 16) Vo A. Q., He H., Zhang J., Martin S., Chen R., Repka M. A., AAPS PharmSciTech, 19, 3425–3429 (2018).
- 17) De Beer T., Burggraeve A., Fonteyne M., Saerens L., Remon J. P., Vervaet C., Int. J. Pharm., 417, 32–47 (2011).
- 18) Rébufa C., Pany I., Bombarda I., Food Chem., 261, 311–321 (2018).
- 19) Frizon C. N. T., Dagostin J. L. A., Nisgoski S., Ribani M., Hoffmann-Ribani R., Int. J. Food Prop., 20 (Suppl. 2), 1403–1412 (2017).
- 20) Mireei S. A., Mohtasebi S. S., Massudi R., Rafiee S., Arabanian A. S., Berardinelli A., Austral. J. Crop Sci., 4, 175–179 (2010).
- 21) Schwanninger M., Rodrigues J. C., Fackler K., J. Near Infrared Spectrosc., 19, 287–308 (2011).
- 22) Sinsheimer J. E., Poswalk N. M., J. Pharm. Sci., 57, 2007–2010 (1968).
- 23) Inoue Y., Maeda R., Furuya K., Murata I., Kimura M., Kanamoto I., Results Pharma Sci., 3, 15–19 (2013).
- 24) Inoue Y., Suzuki K., Maeda R., Shimura A., Murata I., Kanamoto I., Results Pharma Sci., 4, 42–49 (2014).
- 25) Yamamoto Y., Fukami T., Onuki Y., Metori K., Suzuki T., Koide T., Vib. Spectrosc., 93, 17–22 (2017).