Abstract
Polycomb repressive complex 2 (PRC2) is an attractive drug target for anti-cancer treatment. Among the three core subunits (EZH2, EED and SUZ12) of PRC2, EZH2 is the catalytic subunit that methylates histone H3 lysine 27 (H3K27), while EED is the regulatory subunit. Besides the small-molecule inhibitors of EZH2, those targeting the protein–protein interaction (PPI) between EZH2 and EED have also been reported. Here, for the first time, we have identified the key residues that contributed most to the EED–EZH2 binding affinity by molecular mechanics Poisson–Boltzmann surface area (MM-PBSA) calculations based on the 200 ns molecular dynamics simulation. Moreover, we report the identification of two novel and potent small-molecule inhibitors (35 and 49) of EZH2–EED interaction (bottom interaction surface) by virtual screening and biological evaluations. Binding modes of the two identified molecules with EED were probed by molecular docking. Additionally, 35 and 49 displayed cellular antiproliferative activity against diffuse large B-cell lymphoma (DLBCL) cancer cell line Toledo whose cell growth was driven by aberrant PRC2 activity. Our findings have provided structural insights for the design of novel EZH2–EED interaction inhibitors to regulate the activity of PRC2 complex.
Introduction
Histone methylation is one of the most important epigenetic modifications for mediating diverse fundamental cellular processes.1,2) Polycomb repressive complex 2 (PRC2) possesses histone methyltransferase activity and is found to play pivotal roles in embryonic development, stem-cell plasticity and cell differentiation, by catalyzing H3K27 trimethylation (H3K27me3).3–5) PRC2 is composed of three key subunits, EZH2, EED and SUZ12. EZH2 is the catalytic subunit whose activity necessitates the assembly of a core complex with EED and SUZ12,6,7) and the depletion of either EED or SUZ12 could completely inactivate the function of PRC2. Numerous studies8–11) have demonstrated that aberrant PRC2 activity has a key relationship with cancer initiation and progression. For example, in GCB-cell type diffuse large B-cell lymphoma (GCB-DLBCL) and follicular lymphoma (FL) the hyper-trimethylation of H3K27 was found.9) In multiple human cancers, overexpression of EZH2, or other PRC2 subunits, was detected, while knocking down the expression of EZH2 could suppress the growth of these cancer cells.12) These evidences indicate that PRC2 is a promising anticancer target.
Targeting EZH2 or the protein–protein interaction (PPI) between EZH2 and EED are two current strategies to develop PRC2 inhibitors. As EZH2 is the catalytic engine of PRC2, many efforts have been made to develop EZH2 inhibitors.13–26) These inhibitors are S-adenosylmethionine (SAM) competitive inhibitors and could compete with SAM for EZH2 binding so as to inhibit PRC2 activity. Among the reported EZH2 inhibitors (Fig. S1), GSK126, EPZ6438 and CPI-1205 have been evaluated by clinical trials. Compared with EZH2 inhibitors, only a few PPI inhibitors (Fig. S2) have been reported and none of them have gone into clinical trials. There are two interfaces (top and bottom) on EED that can be targeted by PPI inhibitors of PRC2. By screening an in-house database, our group previously identified the first potent PPI inhibitor targeting the bottom of EED,27) using the high-throughput fluorescence polarization assay developed by ourselves.28) He et al. and researchers in the pharmaceutical company Novartis have identified a series of PPI inhibitors29–33) that targeted the top of EED and determined the co-crystal complex structures. As shown in Fig. S3, all the inhibitors targeting the top of EED were located at the same binding site.
Considering the importance in cancer therapeutics, PRC2 has attracted researchers from both academic and industrial fields to study its structure and biological function. In this study, we have for the first time identified the key residues that contribute most to the EED–EZH2 binding affinity by molecular mechanics Poisson–Boltzmann surface area (MM-PBSA) calculations based on the 200 ns molecular dynamics (MD) simulation. Besides, two novel and potent small-molecule inhibitors (35 and 49) of EED–EZH2 interaction (bottom interaction surface) were identified by virtual screening and biological evaluations. Binding modes of 35 and 49 with EED were probed by molecular docking. As expected, 35 and 49 displayed cellular antiproliferative activity against diffuse large B-cell lymphoma cancer cell line Toledo in which the cell growth is driven by aberrant PRC2 activity. These results have provided new thoughts for the development of novel PPI inhibitors for the inhibition of PRC2 complex activity.
Results and Discussion
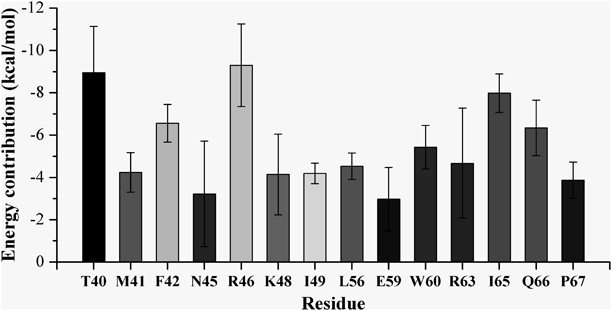
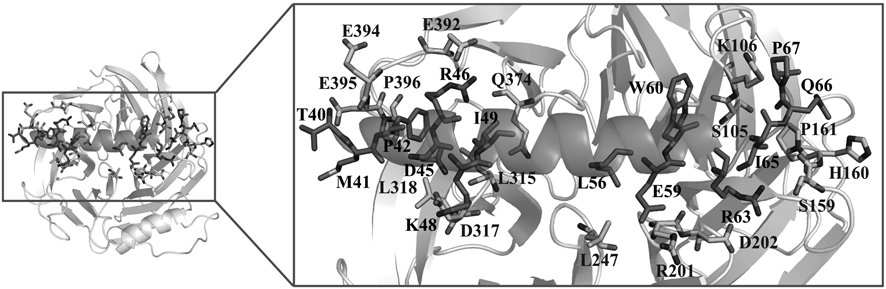
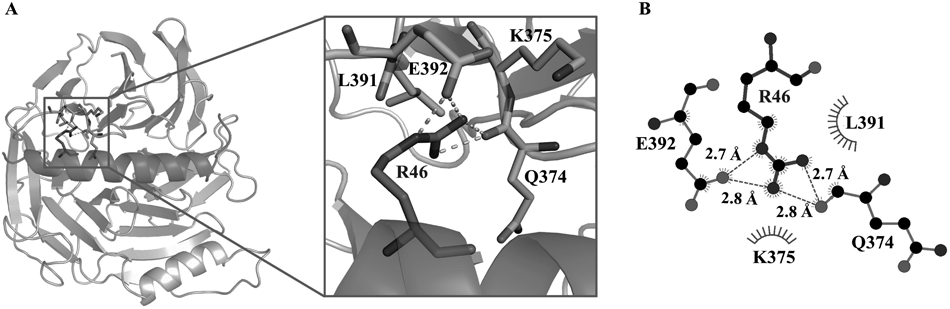
Key Residues Involved in EED–EZH2 Interaction Were Identified by Binding Free Energy DecompositionIn order to gain a more detailed understanding of the interaction between EED and EZH2, we performed the 200 ns MD simulation on the EED–EZH2 complex model. The stability of the simulation model could be reflected by root-mean-square deviation (RMSD) values of the heavy atoms of EED and EZH2. As shown in Figs. S4 and S5, all the RMSD values fluctuated within a small range, which indicated that the simulated model was well equilibrated and the trajectory could be used for further analysis. Based on the trajectory, the binding free energy between EED and EZH2 was calculated using MM-PBSA method. As shown in Table 1, the calculated binding free energy was –174.33 ± 10.32 kcal/mol, which suggested a very strong binding affinity. Then the binding free energy was further decomposed into contributions from residues at the EED–EZH2 interaction surface to identify the key residues that contributed most to the EED–EZH2 interaction. As illustrated in Table S1 and Fig. 1, residues T40, M41, F42, N45, R46, K48, I49, L56, E59, W60, R63, I65, Q66 and P67 in EZH2, as well as residues S105, K106, S159, H160, P161, R201, D202, L247, L315, D317, L318, Q374, E392, E394, D395 and P396 in EED, were identified as the key residues. All the identified residues were shown in Fig. 2. Among these residues, R46 in EZH2 displayed the biggest contribution with binding energy of –9.3 ± 1.95 kcal/mol (Fig. 1). Therefore, the interactions between R46 and EED were carefully analyzed and depicted in Fig. 3. Besides, residues F42, N45, I49, L56 and P67 have also been validated to play significant roles in the interaction between EED and EZH2 by missense mutation experiment.34) The other residues identified by our MD simulation provided more clues for mutational analysis to corroborate the interaction between EED and EZH2.
Table 1. The Calculated Binding Free Energy (in kcal/mol) between EED and EZH2
a)| ΔGgas | ΔGsolv | ΔG |
|---|
| −837.65 ± 46.66 | 663.32 ± 41.19 | −174.33 ± 10.32 |
a) ΔGgas represents the binding free energy in vacuum while ΔGsolv represents the solvation free energy change. ΔG = ΔGgas + ΔGsolv.
Then the hydrogen bonds (H-bonds) and hydrophobic interactions were carefully analyzed to further probe the molecular mechanism of EED and EZH2 interaction, and the results were shown in Tables S2 and S3, respectively. A total of 24 pairs of H-bonds and 19 pairs of hydrophobic interactions existed in the EED–EZH2 interaction surface with the occupancy rate above 50% during the MD simulation. These data indicated that the hydrogen bonds and hydrophobic interactions were the main interactions and were quite stable, which could readily explain the strong binding affinity between EED and EZH2.
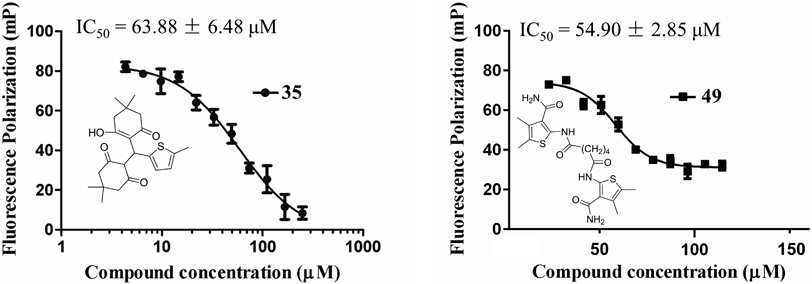
Virtual Screening Combining with the Fluorescence Polarization (FP) Based Competitive Assay Identified Two Novel and Potent EED–EZH2 Interaction InhibitorsIn our previous study, we have identified the first potent EED–EZH2 interaction inhibitor (astemizole, IC50 = 93.80 µM) targeting the bottom of EED by virtual screening an in-house database.27) To obtain more PPI inhibitors targeting the bottom of EED, SPECS database that contains 211838 compounds was selected to perform the molecular docking based virtual screening. The workflow of virtual screening adopted in this study was shown in Fig. S6. R46 in EZH2 was identified to be the residue that contributed most to the EED–EZH2 binding affinity by our aforementioned MD analysis, so it was selected as “ligand” in the molecular docking process. After two rounds docking (SP and XP mode) simulation, the top 200 compounds ranked on the docking score were selected for the following cluster analysis. Finally, we selected 50 compounds to test their EED–EHZ2 interaction inhibition activity with the FP based competitive assay method. Two compounds (35 and 49, Fig. 4) displayed potent inhibition against EED–EZH2 interaction with IC50 values of 63.88 ± 6.48 and 54.90 ± 2.85 µM, respectively (Tables S5 and S6). MACCS fingerprint similarity of the two hits with two known active compounds astemizole and apomorphine hydrochloride were calculated by RDKit (RDKit: Open-Source Cheminformatics Software. http://www.rdkit.org) in Python. The results (Table S4) indicated that the two compounds displayed little structural similarity with astemizole and apomorphine hydrochloride. Besides, both compounds exhibited more potency than our previously reported EED–EZH2 interaction inhibitor astemizole (IC50 = 93.80 µM). The ligand efficiencies of compounds 35 (0.21 kcal/mol) and 49 (0.19 kcal/mol) were also calculated by approximating IC50 to Kd (dissociation constant). This result indicated that compound 35 possessed more advantages than 49 to be developed into lead compound. Therefore, the two compounds will encourage medicinal chemists to perform structure modification based on the two scaffolds for more EED–EZH2 interaction inhibitors.
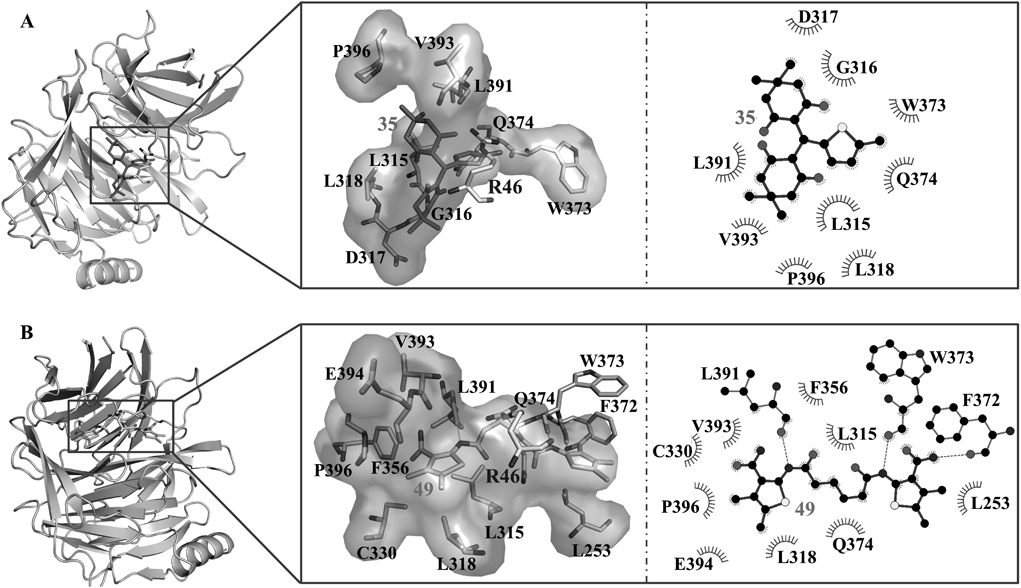
The probable binding modes of the two compounds were provided to show the detailed interaction mechanism. As shown in Fig. 5, both compounds could well occupy the R46 binding site. Compound 35 established hydrophobic interactions with residues L315, G316, D317, L318, W373, Q374, L391, V393 and P396. Compound 49 displayed both hydrophobic and H-bond interactions with EED. Three residues (F372, W373 and L391) were found to have H-bond interactions with 49, while residues L315, L318, L253, C330, F356, Q374, V393, E394 and P396 exhibited hydrophobic interactions with 49. In brief, residues L315, L318, W373, Q374, L391, V393 and P396 were the key residues that showed interactions with both compounds.
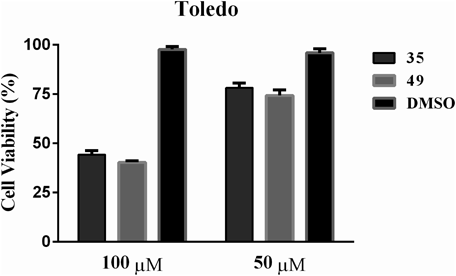
Anti-proliferative Activity Assay in PRC2-Driven DLBCLs Cancer Cell Lines Validated the Cellular Engagement of the Two EED–EZH2 Interaction InhibitorsThe intracellular inhibition of PRC2 by 35 and 49 on the viability of DLBCLs cancer cells Toledo was monitored. As the cell growth of DLBCLs cancer cell is driven by the dysregulation of PRC2 activity, the anti-proliferative activity could be used to reflect the cellular engagement of EED–EZH2 interaction inhibitors. As shown in Fig. 6. Both of the two compounds displayed anti-proliferative activity against Toledo cancer cells in dose-dependent manners.
Conclusion
As PRC2 has become a popular anticancer target, more and more efforts have been devoted to discover its inhibitors. Targeting EZH2 or the PPI between EZH2 and EED are two current strategies to develop PRC2 inhibitors. Up to now, three small molecular inhibitors of EZH2 have been put into clinical trials and none druggable EZH2–EED interaction inhibitors have been found. The active compounds identified by our work provided novel scaffold for PRC2 inhibitors discovery. We believe that our research results could be helpful in discovering new potent and specific inhibitors of EED–EZH2 interaction.
Experimental
MD Simulation and MM-PBSA CalculationsAMBER 14.0 package35) coupled with the Amber14SB force field was used to perform the 200 ns MD simulation. The coordinates of EZH2 peptides (residues 40–68) in 2QXV (PDB ID) and of EED (residues 81–439) in 3JPX (PDB ID) were used to construct the EED–EZH2 interaction model. Specifically, the two protein crystal files were opened in PyMOL and then the protein structures were overlapped by the ‘align’ command. The residues of EED protein in 2QXV and the coordinates of chain B in 3JPX were deleted, and an ‘object’ consisting of the remaining residues was created and saved. The EZH2–EED complex was thus constructed. The protonation states of all ionizable residues were adapted from the predicted results of H++ program.36) The periodic box of water molecules (transferable intermolecular potential 3P, TIP3P) and the counter-ions (Cl−) were added to the simulation model. MD simulations were conducted at constant temperature and pressure with periodic boundary conditions (time step = 2 fs).
Based on the 200 ns MD trajectory, the MM-PBSA method was used to calculate the binding free energy (between EED and EZH2) and to further decompose the energy into contributions from residues that located in the EED–EZH2 interaction surface. A total of 4000 snapshots from the trajectory were firstly extracted every 50 ps, and then the MM-PBSA calculation was performed on each extracted snapshot using the MMPBSA.py.MPI module.
Molecular Docking Based Virtual ScreeningMolecular docking was performed using Glide 5.5 program37,38) inserted in Maestro 7.5. The protein coordinates were minimized by Protein Preparation Wizard Workflow with default settings. The docking grids were created by defining residues within 15 Å around the key residues that were identified by binding free energy decomposition. Then the prepared (using LigPrep panel) compounds of SPECS database (https://www.specs.net/) were docked into the pre-defined docking grids with standard precision (SP) mode. The top ranking compounds (Top 500) were submitted for further docking validation with the extra precision (XP). Subsequently, “Clustering Molecules” protocols embedded in Pipeline Pilot 7.5 (Pipeline Pilot; Accelrys Software Inc., San Diego, CA, U.S.A.) was used to do the cluster analysis. Finally, according to the cluster analysis results, the 50 candidate compounds were selected and purchased from SPECS database supplier.
MACCS Fingerprint Similarity CalculationMACCS fingerprint similarity of the compounds were calculated by RDKit (RDKit: Open-Source Cheminformatics Software. http://www.rdkit.org) in Python. Briefly, the smiles formats of two new compounds (35 and 49) and the reference compounds (astemizole and apomorphine hydrochloride) were converted to 2D structure by MolFromSmiles. Then, the MACCS keys fingerprint similarity of each compounds were calculated and compared with GenMACCSKeys and FingerprintSimilarity application in RDKit.
Protein Expression and PurificationThe protein expression and purification methods were the same as we have previously reported.27,28) In brief, the EED gene (encoding human EED protein with amino acid sequence of 81–441) was subcloned into a modified pET28a vector, which contained a N-terminal 6× His SUMO tag. Escherichia coli strain BL21 (DE3) was used to overexpress the recombinant protein at 16°C and then the harvested bacteria were sonicated and centrifuged (18000 rpm, 30 min, 4°C) in turn to obtain the supernatant. The nickel affinity chromatography (GE Healthcare) and size exclusion chromatography (Superdex 75; GE Healthcare) were successively used to purify the EED protein. The protein was stored in a buffer containing 25 mM N-(2-hydroxyethyl)piperazine-N′-2-ethanesulfonic acid (HEPES) (pH 8.0), 150 mM NaCl and 1 mM DTT.
Fluorescence Polarization (FP) Based Competitive AssayThe fluorescence polarization based competitive assay was used to test the activity against EED–EZH2 interaction. In the FP-based competitive assay, serial dilutions of the tested compounds were prepared from the 100 mM dimethyl sulfoxide (DMSO) stocks. The diluted compound was added to the reaction mixture in 40 µL FP buffer (25 mM HEPES, pH 8.0; 150 mM NaCl, 0.1 mg/mL bovine serum albumin (BSA) and 0.01% NP40). The final concentrations of fluorescein isothiocyanate (FITC)-labeled EZH2 peptide (residue 39–63) and EED protein were 20 and 625 nM, respectively. After 2 h incubation at room temperature, the FP values were measured for each compound concentration and the IC50 value (the concentration required for 50% displacement of the FITC-labeled EZH2 peptides) was fitted using the GraphPad Prism 6.0 software. The multifunctional microplate reader (EnVision, PerkinElmer, Inc.) was used to measure the FP values with excitation at 485 nm and emission at 520 nm, respectively.
In Vitro Cell Viability AnalysisDLBCL cancer cell line Toledo was used to test the effects of the hit compounds on cell viability. The exponentially growing cells were cultured in RPMI 1640 medium supplemented with 10% fetal bovine serum (FBS) and 1% penicillin/streptomycin at a density of 2 × 10⁴ cells per well. Then the cells were incubated with the hit compounds under the concentration of 100 and 50 µM. Cell viability was measured by the Cell Titer-Glo Luminescent Cell Viability kit (Promega) after three days incubation.
Acknowledgments
This research work was financially supported by the National Natural Science Foundation of China (No. 81803438), Shandong provincial key research and development program (2019GSF108043), Shandong Provincial Natural Science Foundation (Nos. JQ201721, ZR2017BH038), the Young Taishan Scholars Program (No. tsqn20161037), and Shandong Talents Team Cultivation Plan of University Preponderant Discipline (No. 10027).
Conflict of Interest
The authors declare no conflict of interest.
Supplementary Materials
The online version of this article contains supplementary materials.
References
- 1) Kouzarides T., Cell, 128, 693–705 (2007).
- 2) Greer E. L., Shi Y., Nat. Rev. Genet., 13, 343–357 (2012).
- 3) Sparmann A., van Lohuizen M., Nat. Rev. Cancer, 6, 846–856 (2006).
- 4) Whitcomb S. J., Basu A., Allis C. D., Bernstein E., Trends Genet., 23, 494–502 (2007).
- 5) Simon J. A., Kingston R. E., Nat. Rev. Mol. Cell Biol., 10, 697–708 (2009).
- 6) Czermin B., Melfi R., McCabe D., Seitz V., Imhof A., Pirrotta V., Cell, 111, 185–196 (2002).
- 7) Cao R., Zhang Y., Mol. Cell, 15, 57–67 (2004).
- 8) Chase A., Cross N. C., Clin. Cancer Res., 17, 2613–2618 (2011).
- 9) Morin R. D., Johnson N. A., Severson T. M., et al., Nat. Genet., 42, 181–185 (2010).
- 10) Yap D. B., Chu J., Berg T., Schapira M., Cheng S. W., Moradian A., Morin R. D., Mungall A. J., Meissner B., Boyle M., Marquez V. E., Marra M. A., Gascoyne R. D., Humphries R. K., Arrowsmith C. H., Morin G. B., Aparicio S. A., Blood, 117, 2451–2459 (2011).
- 11) Sneeringer C. J., Scott M. P., Kuntz K. W., Knutson S. K., Pollock R. M., Richon V. M., Copeland R. A., Proc. Natl. Acad. Sci. U.S.A., 107, 20980–20985 (2010).
- 12) Beguelin W., Popovic R., Teater M., et al., Cancer Cell, 23, 677–692 (2013).
- 13) Tan J., Yang X., Zhuang L., Jiang X., Chen W., Lee P. L., Karuturi R. K., Tan P. B., Liu E. T., Yu Q., Genes Dev., 21, 1050–1063 (2007).
- 14) Chiang P. K., Pharmacol. Ther., 77, 115–134 (1998).
- 15) Couture J. F., Hauk G., Thompson M. J., Blackburn G. M., Trievel R. C., J. Biol. Chem., 281, 19280–19287 (2006).
- 16) McCabe M. T., Ott H. M., Ganji G., et al., Nature (London), 492, 108–112 (2012).
- 17) Souroullas G. P., Jeck W. R., Parker J. S., Simon J. M., Liu J. Y., Paulk J., Xiong J., Clark K. S., Fedoriw Y., Qi J., Burd C. E., Bradner J. E., Sharpless N. E., Nat. Med., 22, 632–640 (2016).
- 18) Konze K. D., Ma A., Li F., et al., ACS Chem. Biol., 8, 1324–1334 (2013).
- 19) Knutson S. K., Warholic N. M., Wigle T. J., Klaus C. R., Allain C. J., Raimondi A., Porter Scott M., Chesworth R., Moyer M. P., Copeland R. A., Richon V. M., Pollock R. M., Kuntz K. W., Keilhack H., Proc. Natl. Acad. Sci. U.S.A., 110, 7922–7927 (2013).
- 20) Wu Y., Hu J., Ding H., Chen L., Zhang Y., Liu R., Xu P., Du D., Lu W., Liu J., Liu Y., Liu Y. C., Lu J., Zhang J., Yao Z., Luo C., Bioorg. Med. Chem. Lett., 26, 3813–3817 (2016).
- 21) Knutson S. K., Wigle T. J., Warholic N. M., et al., Nat. Chem. Biol., 8, 890–896 (2012).
- 22) Qi W., Chan H., Teng L., et al., Proc. Natl. Acad. Sci. U.S.A., 109, 21360–21365 (2012).
- 23) Amatangelo M. D., Garipov A., Li H., Conejo-Garcia J. R., Speicher D. W., Zhang R., Cell Cycle, 12, 2113–2119 (2013).
- 24) Bruno N. C., Tudge M. T., Buchwald S. L., Chem. Scr., 4, 916–920 (2013).
- 25) Zingg D., Debbache J., Schaefer S. M., Tuncer E., Frommel S. C., Cheng P., Arenas-Ramirez N., Haeusel J., Zhang Y., Bonalli M., McCabe M. T., Creasy C. L., Levesque M. P., Boyman O., Santoro R., Shakhova O., Dummer R., Sommer L., Nat. Commun., 6, 6051 (2015).
- 26) Vaswani R. G., Gehling V. S., Dakin L. A., et al., J. Med. Chem., 59, 9928–9941 (2016).
- 27) Kong X., Chen L., Jiao L., Jiang X., Lian F., Lu J., Zhu K., Du D., Liu J., Ding H., Zhang N., Shen J., Zheng M., Chen K., Liu X., Jiang H., Luo C., J. Med. Chem., 57, 9512–9521 (2014).
- 28) Zhu M. R., Du D. H., Hu J. C., Li L. C., Liu J. Q., Ding H., Kong X. Q., Jiang H. L., Chen K. X., Luo C., Acta Pharmacol. Sin., 39, 302–310 (2018).
- 29) Li L., Zhang H., Zhang M., et al., PLOS ONE, 12, e0169855 (2017).
- 30) Li L., Feng L., Shi M., Zeng J., Chen Z., Zhong L., Huang L., Guo W., Huang Y., Qi W., Lu C., Li E., Zhao K., Gu J., Anal. Biochem., 522, 37–45 (2017).
- 31) Qi W., Zhao K., Gu J., et al., Nat. Chem. Biol., 13, 381–388 (2017).
- 32) He Y., Selvaraju S., Curtin M. L., et al., Nat. Chem. Biol., 13, 389–395 (2017).
- 33) Huang Y., Zhang J., Yu Z., et al., J. Med. Chem., 60, 2215–2226 (2017).
- 34) Han Z., Xing X., Hu M., Zhang Y., Liu P., Chai J., Structure, 15, 1306–1315 (2007).
- 35) Case D. A., Cheatham T. E. 3rd, Darden T., Gohlke H., Luo R., Merz K. M. Jr., Onufriev A., Simmerling C., Wang B., Woods R. J., J. Comput. Chem., 26, 1668–1688 (2005).
- 36) Gordon J. C., Myers J. B., Folta T., Shoja V., Heath L. S., Onufriev A., Nucleic Acids Res., 33, W368–W371 (2005).
- 37) Friesner R. A., Banks J. L., Murphy R. B., Halgren T. A., Klicic J. J., Mainz D. T., Repasky M. P., Knoll E. H., Shelley M., Perry J. K., Shaw D. E., Francis P., Shenkin P. S., J. Med. Chem., 47, 1739–1749 (2004).
- 38) Halgren T. A., Murphy R. B., Friesner R. A., Beard H. S., Frye L. L., Pollard W. T., Banks J. L., J. Med. Chem., 47, 1750–1759 (2004).