Abstract
We examined the physicochemical and biochemical properties of mono-O-(5,9,13-trimethyl-4-tetradecenyl)glycerol ester (MGE), including ease of handling, high bioadhesiveness, quick and stable in vivo self-organization (forming a non-lamellar lyotropic liquid crystal [NLLC]), and high biomembrane permeation enhancement. We prepared MGE oral mucosa-applied spray preparations containing triamcinolone acetonide (TA), which is widely used in the treatment of stomatitis, and we examined the usefulness of the MGE preparations compared with commercially available oral mucosal application preparations containing 2,3-dihydroxypropyl oleate (1-mono(cis-9-octadecenoyl)glycerol (GMO) (previously studied as an NLLC-forming lipid) preparation. As a result, the MGE preparation applied to the oral mucosa can rapidly formed an NLLC with reverse hexagonal or cubic structures, or a mixture, on contact with water. In addition, by adding hydroxypropyl cellulose to the MGE preparation, similar retention properties on the oral mucous membrane were obtained to that using marketed drug preparations. Furthermore, the MGE spray formulation on the oral mucosa showed an equivalent or higher TA release as well as oral mucous membrane permeability compared with commercial formulations. Because MGE forms a stable NLLC and is easy to handle compared with GMO, MGE was considered to be a useful pharmaceutical additive for a spray preparation applied to the oral mucosa in combination.
Introduction
Various preparations applied to the oral mucosa are presently used for the treatment of diseases of the local oral mucosa. Several studies on new oral mucosa formulations are also in progress.1–3) Semisolid type, patch type, and spray type formulations can be considered as a typical preparation for the oral mucosa, although the spray type has not been studied extensively.4) Aphthous stomatitis is one of the target diseases for such a preparation.5) Furthermore, stomatitis caused by anti-cancer agent treatment, radiation therapy, and combination therapy is particularly problematic as an oral mucosal disease. Because aphthous stomatitis develops locally in general, semisolid and patch preparations are useful. Because stomatitis caused by cancer therapy develops sometimes in the entire oral cavity, it is considered that a gargle formulation or a spray-type preparation can be moderately useful. To obtain effective medicinal effects using oral mucosa preparations, it is important not only to ensure the safety and ease of application, but also to ensure bioadhesion and retention on the local mucosa as well as the controlled release of entrapped drug(s) from the formulation.
Self-organizing lipids (SOLs) form non-lamellar lyotropic liquid crystals (NLLCs) and have been a recent focus as a new type of pharmaceutical additive6–11) because they show high drug entrapment ability, high adhesion to biological membranes, sustained drug release ability, and enhanced biological membrane permeability and absorption. SOLs may be a next-generation material for biomimetic drug delivery systems such as liposomes. SOLs that form NLLCs on contact with water, such as 2,3-dihydroxypropyl oleate (1-mono(cis-9-octadecenoyl)glycerol [GMO], Table 1)6–10) and 3,7,11,15-tetramethyl-1,2,3-hexadecanetriol (Phytantriol)6,7,9) are well known. However, both of these SOLs are difficult to handle because of their solid or highly viscous aqueous solutions at room temperature. On the other hand, mono-O-(5,9,13-trimethyl-4-tetradecenyl)glycerol ester (MGE; Table 1),7,8,11) an NLLC-forming lipid with an isoprenoid type fatty chain, which was the focus of the present study, is easy to handle, with low viscosity, and exhibits a highly self-organized NLLC structure tightly packed at its interface with water over a wide range of temperatures.9,12)
Table 1. Chemical Structure and Molecular Weight of MGE and GMO
In the present study, MGE was selected for the preparation of a liquid crystal spray preparation containing triamcinolone acetonide (TA) as a model drug.4,13) Although we tried to use suitable drugs for the treatment of stomatitis caused by cancer chemotherapy and radiation therapy in spray formulations, only fundamental gargle formulations containing sodium azulene sulfonate and/or lidocaine hydrochloride are mainly used at the clinical stage. With regard to such stomatitis, studies are still in progress to find out good therapeutic agents and formulations. Therefore, we selected TA, because it is widely used for the treatment of aphthous stomatitis.
The spray preparations were evaluated using several experiments. As described above, a spray preparation was selected because these have not been well studied and was considered to be a form of preparation that is practically useful. For comparison with the present MGE preparation, a liquid crystal spray preparation using GMO,14,15) which has been studied extensively as an original SOL, was used. First, the MGE and GMO spray preparations were evaluated with regard to several physical properties, such as their sprayability, NLLC formation ability, and adhesive and retention properties on the oral mucosa. In addition, the release properties and the oral mucous membrane permeability of TA from the spray formulations were determined and compared with those from commercially available oral mucosa applicable preparations. Aftach® Adhesive Tablet and Kenalog® in Orabase were used as commercially available preparations. Finally, on the basis of the obtained results, the usefulness of the MGE spray preparation on the oral mucosa is discussed.
Experimental
MaterialsMGE and GMO were donated by Farnex Co., Inc. (Yokohama, Japan), and hydroxypropyl cellulose (HPC) with different degrees of substitution (SSL, SL, L, M, and H with a viscosities of 2–2.9, 3–5.9, 6–10, 150–400, and 1000–4000 mPa·s, respectively, from low to high degree of substitution degree) were donated by Nippon Soda Co., Ltd. (Tokyo, Japan). TA (Table 2), betamethasone valerate, ethyl 4-hydroxybenzoate, and rhodamine B used for coloring the spray preparations were purchased from FUJIFILM Wako Pure Chemical Corporation (Osaka, Japan). A commercially available spray vial (volume 5 mL, nozzle diameter 1 mm, Maruem, Osaka, Japan) was used for spraying the preparations. Commercially available formulations containing TA, Aftach® Adhesive Tablet (Teijin Pharma, Tokyo, Japan) and Kenalog® in Orabase (Bristol-Myers Squibb, Tokyo, Japan) were used as control formulations. Other reagents and solvents were of commercially available special grade or HPLC grade products.
Table 2. Chemical Structure and Physicochemical Parameters of TA
* Determined by Chem Draw Ultra 10.0® (PerkinElmer, Inc. Informatics, Cambridge, MA, U.S.A.).
Male WBN/ILA-Ht hairless rats (8 weeks old, 200–250 g body weight (b.w.)) were purchased from Ishikawa Laboratory Animal Research Institute (Fukaya, Saitama, Japan). Their dorsal skin was used in tests. Male J2N-n hamsters (8 weeks old, 100–130 g b.w.) were purchased from Sankyo Labo Service Corp., Inc. (Tokyo, Japan). The oral cheek pouch was used as a test material. Experimental animals were kept in a room adjusted to 25 ± 2 °C with a light/dark cycle at 9:00/21:00. Water and diet (MF, Oriental Yeast Co., Ltd., Tokyo, Japan) were freely accessed. Animal experiments were conducted in accordance with the regulations for animal experiments of Josai University after obtaining approval (JU18007) from the Institutional Animal Control Committee of Josai University (Sakado, Saitama, Japan).
Preparation of Spray PreparationsTable 3 shows the composition of the prepared liquid crystal spray preparations for oral mucosa application. Ethanol was included in the spray formulations to facilitate spraying into the oral cavity, except for the 100% formulation of MGE. HPCs with different degrees of substitution were also used to adjust the viscosity of the spray formulation. The preparation procedure was as follows: HPC with different degrees of substitution was added drop-wise into a spray vial containing ethanol. The vial was then placed and stirred in a water bath at 60 °C overnight to completely dissolve HPC to obtain ethanol solutions containing 5% HPC. After the vial was removed from the water bath, ethanol with or without 5% HPC was mixed with MGE or GMO to obtain the final spray preparations with composition ratios as shown in Table 3. In the case of the rhodamine B-containing spray formulations, rhodamine B was added to 1% of the total formulation. On the other hand, for the TA-containing spray formulations, TA was added to ethanol with and without HPC at a concentration of 5%, and the obtained solutions were mixed with MGE or GMO to give the composition ratio in Table 3, where the final concentration of TA was adjusted to 0.1%. The name code of the prepared spray preparations was as follows: the initial letter was for the SOL used (M for MGE, G for GMO, and W for water without SOL), followed by the SOL content in the subscript (100, 90, 80, 70, or 60), and finally the substitution degree of HPC (SSL, SL, L, M, and H) when HPC are added. For example, M70SSL indicates a spray formulation containing 70% MGE and SSL grade HPC.
Table 3. Spray Formulations Prepared in This Study
| Code | M100 | M90 | M80 | M70 | M60 | M70SSL | M70SL | M70L | M70M | M70H |
|---|
| MGE | 100 | 90 | 80 | 70 | 60 | 70 | 70 | 70 | 70 | 70 |
| GMO | — | — | — | — | — | — | — | — | — | — |
| Ethanol | — | 10 | 20 | 30 | 40 | 29 | 29 | 29 | 29 | 29 |
| HPC | — | — | — | — | — | 1 (SSL) | 1 (SL) | 1 (L) | 1 (M) | 1 (H) |
| Water | — | — | — | — | — | — | — | — | — | — |
| Total (%) | 100 | 100 | 100 | 100 | 100 | 100 | 100 | 100 | 100 | 100 |
| Code | | | | G70 | | G70SSL | G70SL | G70L | G70M | G70H |
|---|
| MGE | | | | — | | — | — | — | — | — |
| GMO | | | | 70 | | 70 | 70 | 70 | 70 | 70 |
| Ethanol | | | | 30 | | 29 | 29 | 29 | 29 | 29 |
| HPC | | | | — | | 1 (SSL) | 1 (SL) | 1 (L) | 1 (M) | 1 (H) |
| Water | | | | — | | — | — | — | — | — |
| Total (%) | | | | 100 | | 100 | 100 | 100 | 100 | 100 |
| Code | | | | | | W70SSL | W70SL | W70L | W70M | W70H |
|---|
| MGE | | | | | | — | — | — | — | — |
| GMO | | | | | | — | — | — | — | — |
| Ethanol | | | | | | 29 | 29 | 29 | 29 | 29 |
| HPC | | | | | | 1 (SSL) | 1 (SL) | 1 (L) | 1 (M) | 1 (H) |
| Water | | | | | | 70 | 70 | 70 | 70 | 70 |
| Total (%) | | | | | | 100 | 100 | 100 | 100 | 100 |
M: MGE, G: GMO, W: water without MGE/GMO; number in subscript: percentage of each ingredient the formulations; SSL, SL, L, M, and H: degree of substitution of HPC.
A slightly moistened Kimwipe was spread out, and the spray formulation containing rhodamine B was sprayed once using a spray vial from a distance of 3 cm, as shown in Fig. 1. Rhodamine B was used to visualize the spray area (spray area diameter).
Confirmation of Liquid Crystal Formation from the Spray PreparationsThe spray formulation was sprayed onto a glass-bottomed dish (Matsunami Glass Ind., Osaka, Japan) containing a small amount of water using a spray vial at a distance of 15 cm from the bottom of the dish. Formulations at the spray site were observed using a polarizing microscope VHX-5000 (Keyence Corp., Osaka, Japan). The reason for spraying from a distance of 15 cm unlike the test in section 2.4 was to prevent the water in the glass-bottomed dish from being disturbed by the spray flow. For the preparations that could not be sprayed in the test in “Spray Tests of Preparations,” 60 µL of each preparation was dropped from a distance of 15 cm from the bottom of the dish using a 200-µm dispenser tip.
Confirmation of NLLC Structure of the Spray Preparations Using Small Angle X-Ray DiffractionVarious spray formulations are sprayed using a spray vial onto a glass-bottomed dish containing a small amount of artificial saliva (Saliveht® Aerosol, Teijin Pharma, Tokyo, Japan), and the NLLC structure of the obtained gel-like substance was evaluated using a small angle X-ray scattering device (SAXS, Rigaku Nano-Viewer, Akishima, Tokyo, Japan). Measurement of samples using SAXS was entrusted to Science and Engineering Research Area, Kanazawa University (Kanazawa, Ishikawa, Japan).
Determination of Bioadhesive Properties of the Spray PreparationsStratum corneum-stripped dorsal skin was excised from hairless rats under mixed anesthesia (medetomidine hydrochloride: 0.15 mg/kg, midazolam: 2 mg/kg, butorphanol tartrate: 2.5 mg/kg, intraperitoneally (i.p.)) and used a substitute membrane for the oral mucosa. Spray formulation containing rhodamine B was sprayed once using a spray vial at a distance of 3 cm from the stratum corneum-removed skin surface, in the same manner as shown in Fig. 1, to determine the spray area. Immediately after measurement of the spray area, the sprayed skin was attached to a plate inclined at 45°, and warmed tap water at 37 °C was flowed at a rate of 200 mL/min for 1 h to determine the holding area. Then, the holding area was determined using image analysis software (VHX-H2M2, Keyence Corp.), and the holding ratio was calculated using the following equation. In the case of commercial formulations, 1 tablet of Aftach® was applied to the stripped dorsal skin using the procedure described in the package insert, and 200 mg of Kenalog® in Orabase with rhodamine B at a concentration of 1% was applied to the stratum corneum-stripped skin.
 | (1) |
In addition, only M70SSL and M70H were tested similarly using hamster cheek pouch (extraction method of the cheek pouch from hamsters is explained later).
Release Test of TA from Spray PreparationsRegenerated cellulose membrane (Cellulose tube 24/32 with a pore size of 50 Å, Eidia Co., Ltd., Tokyo, Japan) was set in a Franz type diffusion cell (receiver volume: 6.0 mL, effective diffusion area: 1.77 cm2) as described previously.8,10,11) Then, the spray formulation or commercial formulation (Aftach® Adhesive Tablet or Kenalog® in Orabase) containing the same amount of TA (25 µg) was applied onto the regenerated cellulose membrane after applying 200 µL of artificial saliva (Salibeht®) on the membrane. The spray formulation was applied with a pipette over the area to ensure uniform distribution and Kenalog® was spread with a spatula. Ethanol at a concentration of 20% in water (6.0 mL) was applied to the receiver side to start the release experiment of TA from each preparation over 6 h. The inside of the diffusion cell was constantly stirred using a magnetic stirrer and kept at 37 °C. The test was conducted in an environment kept at high humidity (>95% relative humidity (RH)) using a humidifier, because the NLLC structure was not maintained if the water evaporated from the spray preparation during the experiment. Aliquots (500 µL) were sampled from the receiver cell at predetermined intervals, and the same amount of 20% ethanol was added to keep the volume constant. The amount of TA in the obtained sample was assayed by HPLC.
In Vitro Oral Mucosa Permeation Study of TA from Spray PreparationsHamsters were fasted from the day before the experiment. Ternary mixed anesthesia was used in hamsters as in the experiment with hairless rats explained above. The oral cheek pouch was excised from hamsters under this anesthesia as follows: the hamster was exsanguinated by blood removal under anesthesia, and an incision was made vertically from the mouth corner to obtain the cheek pouch. The pouch was used for the experiment after washing with pH 6.75 phosphate-buffered saline (PBS).
The isolated cheek pouch was set in a vertical diffusion cell16) similar to that used for the release test, and the spray preparation or commercial preparation (Aftach® Adhesive Tablet or Kenalog® in Orabase) containing TA was applied. Salibeht® (200 µL) was applied to the epithelial side of the cheek pouch, followed by 200 µL of spray formulation or commercial formulation. Application method for spray formulations, Aftach® Adhesive Tablet or Kenalog® in Orabase was the same as in the release study. PBS (pH 6.75, 6 mL) was applied to the receiver side to start the oral mucosa permeation experiment of TA from each preparation over 6 h. Aliquots (500 µL) were sampled from the receiver cell at predetermined intervals, and the same amount of PBS was added to keep the volume constant. The inside of the diffusion cell was constantly stirred with a magnetic stirrer and kept at 37 °C. The test was conducted in an environment kept under high humidity (>95% RH) using a humidifier. The amount of TA in the obtained sample was assayed by liquid chromatography-tandem mass spectrometry (LC-MS/MS).
TA AssayThe sample obtained from the drug release or in vitro oral mucosal permeation test was obtained by centrifugation (21500 × g, 4 °C, 5 min) after stirring with acetonitrile at a ratio of 1 : 1 (v/v). The concentration of TA in the supernatant was measured by HPLC and LC-MS/MS, respectively.
The HPLC system consisted of system controller (SCL-10A; Shimadzu Corporation, Kyoto, Japan), pump (LC-10AD; Shimadzu Corporation), auto-sampler (SIL-10A; Shimadzu Corporation), column oven (CTO-10AC; Shimadzu Corporation), UV detector (SPD-10AV; Shimadzu Corporation), degasser (DGU-12A3; Shimadzu Corporation), analysis software (Chromato-PRO® version 5.0.0.199; Runtime Instruments, Sagamihara, Japan). The column was Inertsil® ODS-3 (5 µm, 4.6 × 150 mm) (GL Science, Tokyo, Japan) maintained at 40 °C. Ethyl 4-hydroxybenzoate was used as an internal standard. Acetonitrile : distilled water (35 : 65) was used as mobile phase with flow rate of 1.0 mL/min. The wavelength was set to 240 nm, and the injection volume was set to 20 µL. The lower limit of this assay was 0.44 µg/mL.
The LC-MS/MS system consisted of system controller (CBM-20A; Shimadzu Corporation), pump (LC-20AD; Shimadzu Corporation), auto-sampler (SIL-20AC; Shimadzu Corporation), column oven (CTO-20AC; Shimadzu Corporation), detector (3200 QTRAP; AB Sciex, Tokyo, Japan), and analysis software (Analyst® version 1.4.2; Shimadzu Corporation). The column and the guard column were Shodex® ODP2 HP-2B 2.0 × 50 mm and ODP2 HPG-2A 2.0 × 10 mm, respectively (each from Showa Denko, Tokyo, Japan). The column temperature was adjusted to 40 °C. An internal standard method was used for the TA assay, with betamethasone valerate used for this purpose. A mixed solution (A : B, 65 : 35) was used for the mobile phase, where A was acetonitrile : purified water : formic acid (90 : 10 : 0.1), and B was acetonitrile : purified water : formic acid (2 : 98 : 0.1)17) The flow rate was 0.2 mL/min, and the injection volume was set to 10 µL. Electrospray ionization (ESI) was used for TA ionization. The measured molecular weight of TA was set to m/z 435.00 for the precursor ion and m/z 415.10 for the product ion, and that for BV was m/z 477.00 for the precursor ion and m/z 279.20 for the product ion. The ion spray voltage was 4500 V, the nebulizer gas pressure was 40 psi, the drying gas flow rate was 30 L/min, and the drying gas temperature was 700 °C. The lower limit of quantification of this assay was 4.32 ng/mL.
Results
Sprayability of Prepared PreparationsThe sprayability of various preparations including MGE or GMO was tested using the method shown in Fig. 1 (no tests were done for the spray preparations without these SOL). Table 4 shows the obtained results. Formulations M70H, G70M, and G70H were not easy to spray from a spray vial due to their higher viscosity among the spray preparations tested. These preparations are marked with “△” in Table 4. Although M100, M90, G70SL, and G70L could not be widely sprayed, and the diameter of the spray site was 0.3 cm or less, and these preparations are marked to “○.” On the other hand, other formulations containing MGE or GMO were easily sprayable (denoted “●” in Table 4), and the diameter of the spray site was 0.5 to 1.0 cm.
Table 4. Evaluation of Sprayability and Bioadhesive Properties
| Sprayability* | Spray area (cm2) | Holding area (cm2) | Holding rate (%) |
|---|
| M100 | ○ | 0.35 | 0.35 | 96.9 |
| M90 | ○ | 0.54 | 0.49 | 83.89 |
| M80 | ● | 0.65 | 0.44 | 70.97 |
| M70 | ● | 1.55 | 1.17 | 70.58 |
| M60 | ● | 1.38 | 1.01 | 68.69 |
| M70SSL | ● | 0.78 | 0.80 | 102.6 |
| | 0.84** | 0.41** | 48.97** |
| M70SL | ● | 1.18 | 0.54 | 45.76 |
| M70L | ● | 1.54 | 1.19 | 77.27 |
| M70M | ● | 1.71 | 1.36 | 79.53 |
| M70H | △ | 0.57 | 0.44 | 77.19 |
| | 1.02** | 0.59** | 57.74** |
| G70 | ● | 1.43 | 0.63 | 44.05 |
| G70SSL | ● | 0.76 | 0.50 | 65.79 |
| G70SL | ○ | 0.73 | 0.17 | 23.29 |
| G70L | ○ | 0.73 | 0.46 | 63.01 |
| G70M | △ | 0.48 | 0.50 | 104.2 |
| G70H | △ | 0.33 | 0.17 | 51.52 |
| W70SSL | — | 0.86 | 0 | 0 |
| W70SL | — | 1.26 | 0 | 0 |
| W70L | — | 1.54 | 0 | 0 |
| W70M | — | 0.86 | 0 | 0 |
| W70H | — | 0.86 | 0 | 0 |
| Aftach® | — | 0.41 (Sticking area) | 0.35 | 84.94 |
| Kenalog® in Orabase | — | 3.67 (Coating area) | 2.85 | 70.92 |
* ●; Easy to spray, ○; difficult to spray, and △; very difficult to spray. ** Data using hamster cheek pouch, whereas others are data were obtained using stratum corneum-stripped hairless rat dorsal skin. (n = 3–4)
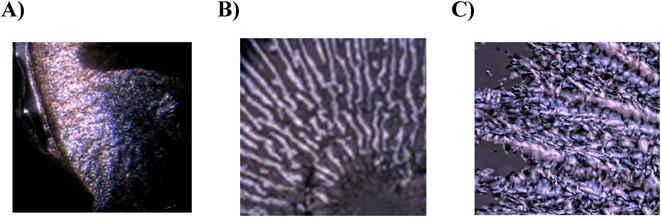
Because a polarized light image can be obtained when a liquid crystal is formed,8) a polarized light microscope image was used to examine the spray preparations. Figure 2 shows the results for M70SSL containing MGE and W70SSL containing neither MGE nor GMO as typical examples. Polarized images were seen with M70SSL, but not with W70SSL. Polarized images were confirmed for all preparations containing SOL (MGE or GMO) (data not shown). In addition, a polarized image was quickly generated for formulations combined with HPC with a low degree of substitution (SSL or SL, see Table 3). On the other hand, no polarized light image was observed in preparations that did not contain either MGE or GMO (First letter of the formulation names is “W,” as shown in Table 3).
Figure 3 illustrates the results of SAXS measurement. Spray formulation of M70 showed a reverse hexagonal structure with a peak ratio of  . M70SSL and M70SL displayed reverse hexagonal structure () and cubic structures having Im3m (
 ) space group, whereas M70L, M70M, and M70H showed cubic structure with Im3m space group (
 ). On the other hand, G70, G70SSL, and G70SL primarily had reverse hexagonal structure (), although cubic structure with Pn3m space group (
 ) was also observed. When a high degree of substitution of HPC was added in GMO formulation, cubic structure with Pn3m (
 ) space group was only observed.
Bioadhesive Properties of the Spray PreparationsBecause SOL (MGE or GMO) oral mucosal spray formulations formed NLLC structures immediately after contacting water, we investigated whether these liquids can produce an NLLC on the oral mucosa and they adhere to the mucosa. In this experiment, stratum corneum-removed hairless rat dorsal skin was first used as an oral mucosa model in order to investigate the presence or absence of adhesion retention. Table 4 shows the spray area of each preparation adhering to the rat skin, the holding area after gently rinsing with water, and the holding rate (%) calculated using eq. (1). M70H, G70M, and G70H, which were judged to be difficult to spray in the previous experiment, and M100, M90, G70SL, and G70L, which were difficult to apply widely, did not have large spray areas in this experiment. In addition, the holding area and holding rate were zero in preparations without the addition of SOL (MGE or GMO), and these were easily washed away with water. The addition of SOL (MGE or GMO) increased the holding rate. Notably, the addition of HPC to the SOL preparations showed much higher bioadhesive properties. In addition, spray formulations consisting of MGE with HPC showed higher retention than spray formulations consisting of GMO with HPC, and the former preparation had almost the same retention ability compared with the marketed formulations (Kenalog® in Orabase and Aftach®).
Next, hamster cheek pouches, which are often used as a model of the oral mucosa, were removed, and the bioadhesive property of M70SSL and M70H was evaluated in the same manner. The obtained data are also shown in Table 4. M70SSL showed high bioadhesive properties compared to M70H, which was similar to the findings in experiments using rat stratum corneum-removed hairless dorsal skin.
TA Release from Spray PreparationsFigures 4A-1, A-2, B, and C show the release profiles of TA from MGE spray formulations without HPC, MGE spray formulations with different grades of HPC, various GMO spray formulations, and commercial formulations and spray formulations without SOL, respectively. The amounts of TA released through the unit diffusion area of the dialysis membrane from the preparations were plotted against time. The MGE spray formulations without HPC (Fig. 4A-1) showed lower release without a big difference among the MGE contents compared with the commercial formulations (Fig. 4C), whereas the MGE formulation with HPC (Fig. 4A-2) showed almost the same TA release as the commercial formulations (Fig. 4C). MGE formulations with HPC-L or HPC-M showed higher release than those with HPC-SSL and HPC-SL (Fig. 4A-2). Similarly, the GMO spray formulations (Fig. 4B) showed the same level of release as the commercial formulations. G70H and G70M showed higher release than other GMO formulations (Fig. 4B). When comparing the overall release data, M70H and G70H with high viscosities of HPC showed the highest release (Figs. 4A-2 and 4B). On the other hand, the spray formulations without SOL showed higher TA release than the commercial formulations (Fig. 4C).
In Vitro Oral Mucosa Permeability of TA from Spray PreparationsFigure 5 shows the time course of permeation behavior of TA after application of the preparations and the commercially available preparations to hamster cheek pouch samples. This experiment was performed with spray formulations having a good sprayability. The oral mucous mucosa permeability of TA showed a remarkably high value after application of M70SSL spray formulation (○ in Fig. 5A) compared with the commercial formulations (Fig. 5C). On the other hand, M70SL (● in Fig. 5A) had lower permeability than M70SSL and M70 (○ and ● in Fig. 5A), and was almost the same as the commercial preparations (Fig. 5C). M70SSL (○ in Fig. 5A) showed higher permeability than G70SSL (□ in Fig. 5B), whereas the TA permeation from M70 and G70 spray formulations (● in Fig. 5A and ■ in Fig. 5B) showed similar values.
Discussion
Physical Properties of the Spray PreparationsThe sprayability of formulations is generally dependent on the viscosity of the formulation. That is, if the viscosity is high, nozzle of the spray vial is easily blocked by the formulation. As expected, the viscosity of the present spray formulations was dependent on the grade of HPC added. Because MGE showed lower viscosity than GMO when using the same grade of HPC in the present study, the MGE preparations had higher sprayability than GMO preparations.
Ethanol was added to the preparations to improve the sprayability in the present study. It may penetrate the diseased sites (such as inflammation sites) from the oral mucosal surface and cause pain in patients. It will be necessary to change to another solvent from ethanol. Polyols such as polyethylene glycol, propylene glycol, and butylene glycol4) may be suitable candidates. Changing from ethanol to polyols should be not a big issue.
It was confirmed in the present study that the combination of HPC with lower degrees of substitution with MGE or GMO gave a polarized image shortly after coming in to contact with water. Thus, the NLLC structure could form easily upon saliva contact in the oral mucosa after spraying these preparations. Thus, the viscosity of the preparations was closely related to the speed of liquid crystal formation.
From the results of SAXS measurement (Fig. 3), MGE and GMO preparations without HPC had reverse hexagonal structures, whereas two kinds of crystal structure with reverse hexagonal structure and cubic structures were mixed when HPC was added.18–21) Reverse hexagonal and cubic structure having Im3m space groups were found in MGE with low degree of substitution HPC (grade SSL and SL), whereas reverse hexagonal structure and cubic structure with Pn3m space group were found for G70SSL and G70SL. It was considered that such differences in crystal forms due to the addition of HPC may be affected by the viscosity and the order liquid crystal structure. Detailed analysis of the liquid crystal structure depends on future research.
It was revealed that the oral spray preparations in the present study showed high bioadhesive properties by adding SOL (MGE or GMO) and/or HPC. In addition, MGE was considered to be superior to GMO in terms of adhesive properties to biological membranes. It was suggested that the M70L and M70H preparations were good to secure the spray area and to increase the holding rate. Because both showed almost the same bioadhesive ability as in marketed drug formulations, they can be used in clinical settings instead of the marketed formulations. Compared with Aftach® tablet and Kenalog® ointment, which have limited application areas, the present spray preparations can be applied over a wide disease area. Thus, these oral mucosa spray preparations can be applied for a large number of problems such as the stomatitis during anticancer drug treatment.
The present MGE formulations formed a liquid crystal structure on contact with the oral mucosa, because the mucosa is rich in water. The MGE formulations have high bioadhesive properties. Therefore, MGE can be selected as a suitable pharmaceutical additive for oral spray preparations.
TA Release and in Vitro Oral Mucosa Permeability from Spray PreparationsThe release experiment was conducted with 20% ethanol as the receiver solution to increase TA solubility to maintain the sink condition. The ethanol in the receiver solution would reach to the donor side from the receiver side by permeation through the membrane. Although ethanol content in the formulation might change the constructed NLLC structure, no structural changes were observed between the constructed NLLC structures of M100 and M70 (data not shown).
From the results of the release test (Fig. 4), it was suggested that the release of TA can be controlled by changing MGE to GMO and vice versa, use of various grades of HPC, and adjusting the ethanol concentration. Although the MGE formulations without HPC showed about a half amount of TA released compared with the commercial formulations (Fig. 4A-1), the formulations with HPC showed much improved drug release (Fig. 4A-2). The M70H and G70H formulations contain viscous HPC (grade H) and showed a high release rate. It was suggested from the results of the SAXS determinations (Fig. 3) together from the time for crystal formation that the reverse hexagonal structure was dominant and rapidly formed for the MGE formulation without HPC. On the other hand, preparations containing high viscosity HPC took time to form NLLC structures, and cubic structure was formed. Thus, the highly viscous preparations affected the high release rate and the delayed NLLC formation. Although highly viscous preparations show a low rate of release in general, a reason for the high release rate from viscous M70H and G70H preparations is probably due to flexibility of their NLLC structures in aqueous solution.
For the oral mucosa permeability of TA, the M70SSL preparation showed the highest value (Fig. 5). This cannot be predicted from the release data, because the M70SSL preparation did not show the highest release of TA (Fig. 4A-2).
The formulations applied in the permeation experiment contained 29% ethanol. Since ethanol has been used as a permeation enhancer of hydrophilic drugs through buccal membrane,22,23) ethanol content might be related to membrane permeation of TA. On the other hand, Nicolazzo et al. have reported no enhancement effect by ethanol on the TA permeation through the buccal membrane.24) The enhancement effect by ethanol would be strengthened or weakened by different formulations. Ethanol was added in the spray formulation to facilitate spraying into the oral cavity by decreasing the viscosity. Thus, a further experiment is needed to clearly reveal the enhancement effect by ethanol in the applied formulations.
It was reported that the liquid crystal structure of the formulations affected the biomembrane permeability of the entrapped drugs.25) The M70SSL preparation rapidly formed two types of liquid crystal structures (reverse hexagonal structure and cubic structures with lm3m space group, shown in Fig. 3), which probably relates to the high TA permeability. The G70SSL formulation, which have mixed cubic liquid crystals of inverse hexagonal structure and cubic structure of Pn3m, showed low permeation. These results suggested that the constructed crystal forms markedly contribute to the biomembrane permeability. In other words, the structure of the liquid crystal and its formation rate together with their balance are important to adjust the drug release rate and biomembrane permeability.
Conclusion
It became clear from the sprayability test that MGE is a more suitable SOL as an additive for spray formulations than GMO. The viscosity of the MGE spray formulations could be adjusted using the different degree of HPC. The combination of MGE with low-viscosity HPC enabled the preparation of a spray formulation with the same level of adhesion to the oral mucosa as commercial formulations. In addition, these liquid crystal spray formulations showed the same release propertied of the entrapped drug, TA, as in the commercial formulation, and showed equivalent or superior in vitro oral mucosal permeation of TA to the commercial formulations. From the above results, it is considered that the present spray formulations based on MGE is useful as an oral mucous membrane applicable formulation.
Conflict of Interest
The authors declare no conflict of interest.
References
- 1) Bhagurkar A. M., Darji M., Lakhani P., Thipsay P., Bandari S., Repka M. A., J. Pharm. Pharmacol., 71, 293–305 (2018).
- 2) Ammar H. O., Ghorab M. M., Mahmoud A. A., Shahin H. I., AAPS PharmSciTech, 18, 93–103 (2017).
- 3) Kawano Y., Imamura A., Nakamura T., Akaishi M., Satoh M., Hanawa T., Chem. Pharm. Bull., 64, 1659–1665 (2016).
- 4) Kim D. W., Kim Y. I., Ud Din F., Cho K. H., Kim J. O., Choi H. G., Pharmazie, 69, 512–517 (2014).
- 5) Staines K., Greenwood M., BMJ Clin. Evid., 2015, 1303 (2015).
- 6) Okawara M., Hashimoto F., Todo H., Sugibayashi K., Tokudome Y., Int. J. Pharm., 472, 257–261 (2014).
- 7) Kadhum W. R., Oshizaka T., Hijikuro I., Todo H., Sugibayashi K., Eur. J. Pharm. Sci., 88, 282–290 (2016).
- 8) Kadhum W. R., Sekiguchi S., Hijikuro I., Todo H., Sugibayashi K., J. Oleo Sci., 66, 443–454 (2017).
- 9) Hato M., Minamikawa H., Rajesh A. S., Matsutani S., Langmuir, 18, 3425–3429 (2002).
- 10) Yamada K., Yamashita J., Todo H., Miyamoto K., Hashimoto S., Tokudome Y., Hashimoto F., Sugibayashi K., J. Oleo Sci., 60, 31–40 (2011).
- 11) Kadhum W. R., Hada T., Hijikuro I., Todo H., Sugibayashi K., J. Oleo Sci., 66, 939–950 (2017).
- 12) Hato M., Yamashita I., Kato I., Abe Y., Langmuir, 20, 11366–11373 (2004).
- 13) Ghalayani P., Emami H., Pakravan F., Nasr Isfahani M., Asia Pac. J. Clin. Oncol., 13, 448–456 (2017).
- 14) Boyd B. J., Whittaker D. V., Khoo S. M., Davey G., Int. J. Pharm., 309, 218–226 (2006).
- 15) Nielsen L. S., Schubert L., Hansen J., Eur. J. Pharm. Sci., 6, 231–239 (1998).
- 16) Morales J. O., McConville J. T., Eur. J. Pharm., 77, 187–199 (2011).
- 17) Ishii H., Todo H., Sugibayashi K., Chem. Pharm. Bull., 58, 556–561 (2010).
- 18) Barauskas J., Johnsson M., Tiberg F., Nano Lett., 5, 1615–1619 (2005).
- 19) Wrle G., Siekmann B., Koch M. H., Bunjes H., J. Pharm. Sci., 27, 44–53 (2006).
- 20) Kulkarni C. V., Wachter W., Iglesias-Salto G., Engelskirchen S., Ahualli S., Chem. Chem. Phys., 13, 3004–3021 (2011).
- 21) Nakano M., Teshigawara T., Sugita A., Leesajakul W., Taniguchi A., Kamo T., Matsuoka H., Handa T., Langmuir, 18, 9283–9288 (2002).
- 22) Hassan N., Ahad A., Ali M., Ali J., Expert Opin. Drug Deliv., 7, 97–112 (2010).
- 23) Howie N. M., Trigkas T. K., Cruchley A. T., Wertz P. W., Squier C. A., Williams D. M., Oral Dis., 7, 349–354 (2001).
- 24) Nicolazzo J. A., Reed B. L., Finnin B. C., J. Pharm. Sci., 93, 2054–2063 (2004).
- 25) Wan J., Wang S. M., Gui Z. P., Yang Z. Z., Shan Q. Q., Chu X. Q., Gui S. Y., Yang Y., Eur. J. Pharm. Sci., 125, 93–101 (2018).