Abstract
Lower urinary tract symptoms (LUTS) induced by anticholinergic drug action impair the QOL of patients and are associated with a poor prognosis. Therefore, it is expedient to develop methods of predicting the anticholinergic side effects of drugs, which we aimed to achieve in this study using a quantitative structure–activity relationship (QSAR) and docking study with molecular operations environment (MOE; Molecular Simulation Informatics Systems [MOLSIS], Inc.) In the QSAR simulation, the QSAR model built using the partial least squares regression (PLS) and genetic algorithm-multiple linear regression (GA-MLR) methods showed remarkable coefficient of determination (R2) and XR2 values. In the docking study, a specific relationship was identified between the adjusted docking score (-S) and bioactivity (pKi) values. In conclusion, the methods developed could be useful for in silico risk assessment of LUTS, and plans are potentially applicable to numerous drugs with anticholinergic activity that induce serious side effects, limiting their use.
Introduction
Many drugs have anticholinergic actions as an unwanted side effect. For example, the antidepressant amitriptyline and anti-schizophrenic haloperidol are well-known for high incidences of anticholinergic effects. Lower urinary tract symptoms (LUTS) are some of the symptoms induced by anticholinergic drug action. LUTS, which is mediated by actions on the muscarinic M3 receptor,1–11) impairs the QOL of patients, leading to poor prognosis.12–17) In clinical practice, indications of risk for LUTS are required to be identified. However, in silico risk assessment methods for LUTS have not been established. Therefore, it is important to develop methods for the prediction of anticholinergic activity of drugs used clinically and those under development.
In silico quantitative structure–activity relationship (QSAR) and docking studies are available and generally used for screening promising drug candidates. In silico simulation requires a shorter estimation time than biological screening does. Moreover, QSAR and docking studies might be applicable to risk management and assessment of new and existing drugs.18–21) In this study, we developed methods for the prediction of anticholinergic actions of drugs using QSAR and docking studies. All computational simulations were carried out using molecular operations environment (MOE; Molecular Simulation Informatics Systems [MOLSIS] Inc.).22)
Results and Discussion
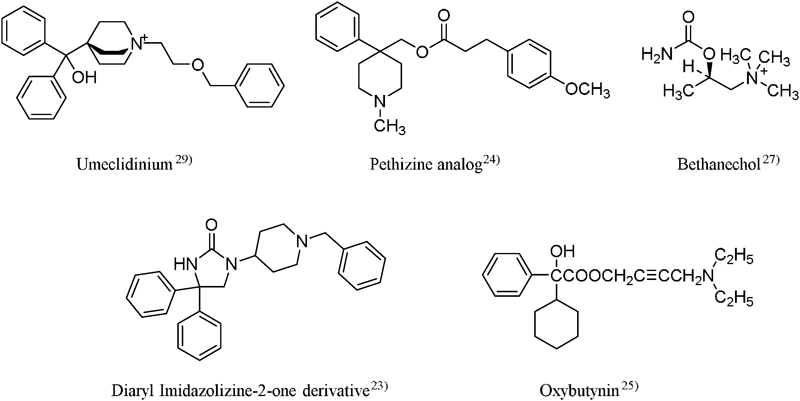
Prediction by QSAR ModelThe QSAR models were initially built based on the known activity values and structures of compounds and in this study, we used 82 compounds with known anticholinergic activity.23–29) We used binding affinity to the muscarinic M3 receptor (pKi value) as the experimental value. In previous studies,23–29) the Ki value was calculated using IC50. Therefore, the pKi value shows that binding affinity to the receptor is useful as an indicator of anticholinergic activity.23–29)
Figure 1 shows the typical structures used for building the QSAR models. Subsequently, the calculated QSAR models were classified by the number of descriptors and as shown in Table 1, the coefficient of determination (R2) tended to increase in a descriptor number-dependent manner.
Table 1. Correlation of Determination in Quantitative Structure–Activity Relationship (QSAR) Models Calculated Using Partial Least Squares (PLS) and Genetic Algorithm-Multiple Linear Regression (GA-MLR)
| Number of descriptors | Method |
|---|
| A. PLS | B. GA-MLR |
|---|
| 12 | R2 = 0.793 | R2 = 0.800 |
| XR2 = 0.670 | XR2 = 0.685 |
| 13 | R2 = 0.808 | R2 = 0.804 |
| XR2 = 0.696 | XR2 = 0.682 |
| 14 | R2 = 0.811 | R2 = 0.809 |
| XR2 = 0.659 | XR2 = 0.671 |
| 15 | R2 = 0.812 | R2 = 0.811 |
| XR2 = 0.649 | XR2 = 0.656 |
Candidates of calculated QSAR models were classified by number of descriptors. When 13 descriptors were used, correlation of determination (R2) score was large. Moreover, R2 value was as large as that of XR2.
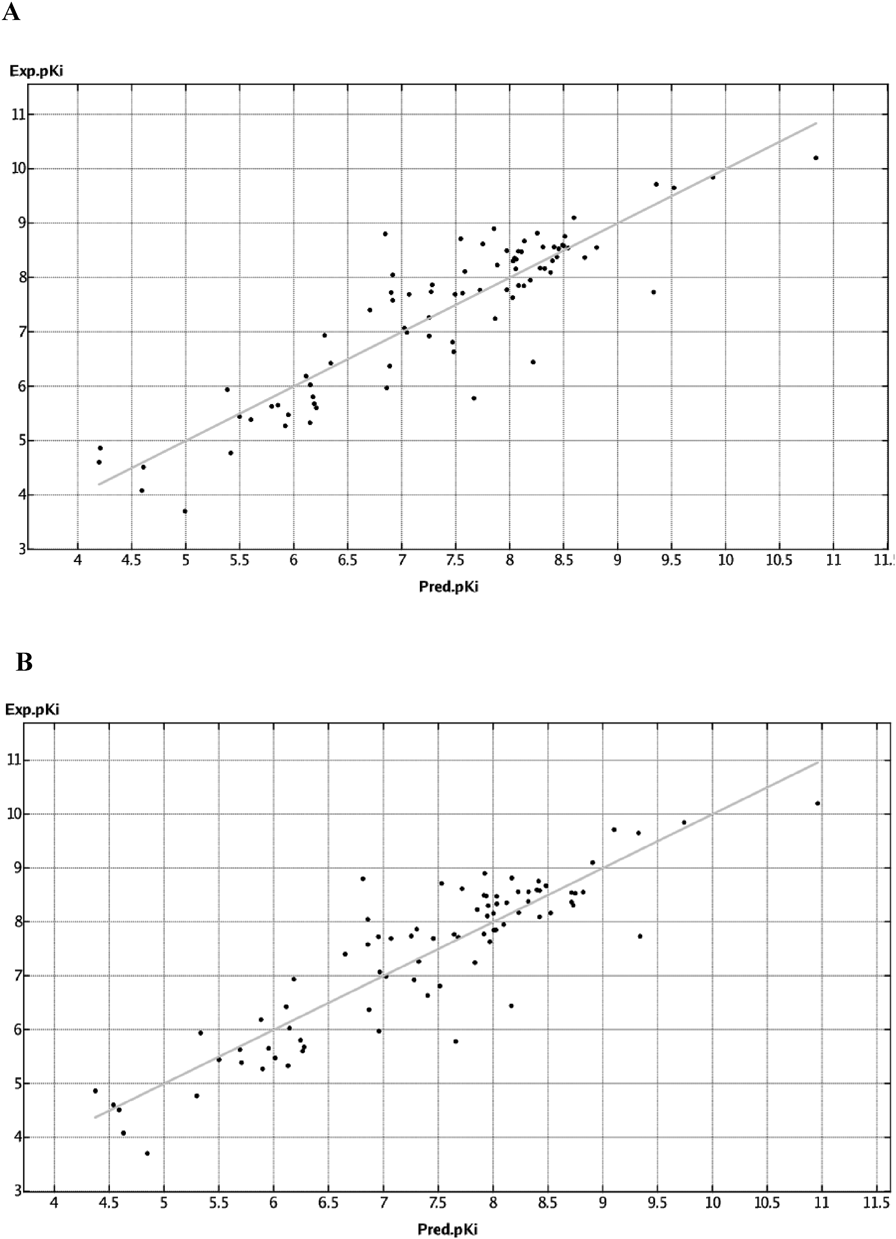
Moreover, the R2 value was approximately maximum when 13 descriptors were used30–32) in both the partial least squares (PLS) and genetic algorithm-multiple linear regression (GA-MLR) methods. Furthermore, a small difference between the R2 and XR2 value is generally desirable. Therefore, we adopted two QSAR models with 13 descriptors (Figs. 2A, 2B) and the QSAR models were further analyzed (PLS: R2 = 0.808 and XR2 = 0.696, GA-MLR: R2 = 0.804 and XR2 = 0.682.).
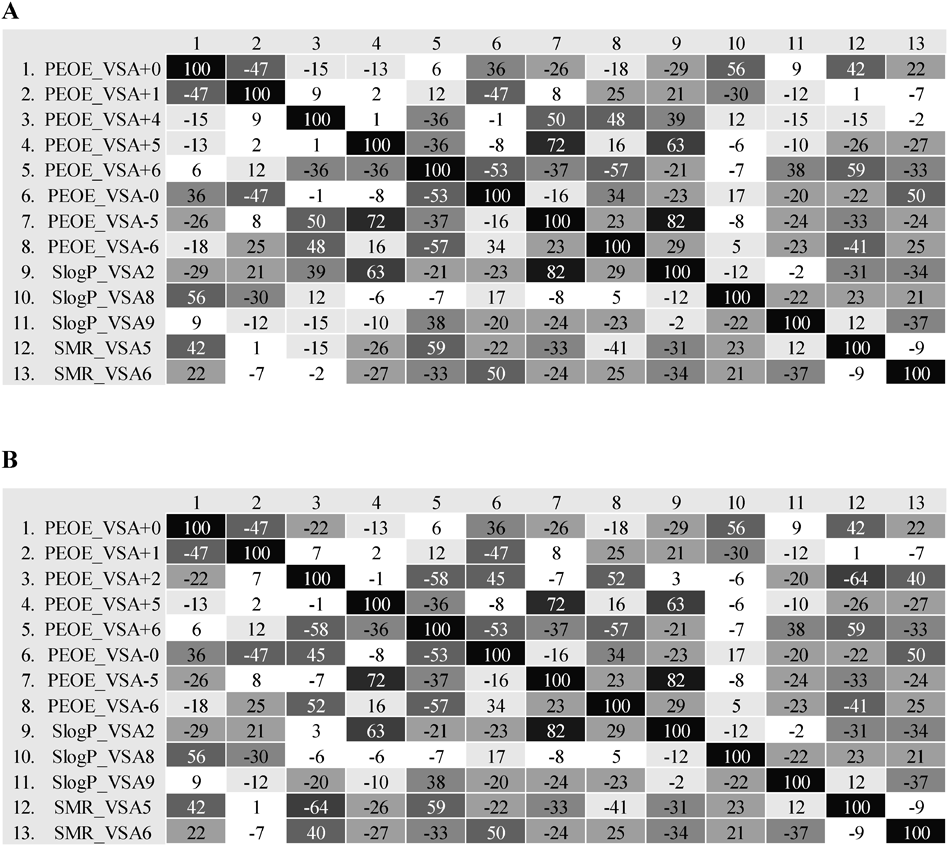
Statistical Analysis of QSAR ModelThe results of the ANOVA showed that the QSAR models had a p < 0.05, suggesting that they could be considered statistically significant. To validate the accuracy of the QSAR models it was important to evaluate the multicollinearity33–38) and, therefore, this was statistically analyzed using two methods. One of methods involved evaluating the correlation between two descriptors and the other, evaluated the variance inflation factor (VIF) statistics. First, the correlation between two descriptors was calculated using the correlation matrix function of MOE (Figs. 3A, 3B), and values >0.9 (90%) indicated they could be considered to be strong relevant. In this method, multicollinearity might not occur in both QSAR models.
Consequently, it was also necessary to evaluate the correlation between multiple descriptors because we used numerous descriptors.38) Therefore, secondary VIF statistics were calculated to evaluate the correlation between multiple descriptors using the IBM statistical package for the social sciences (SPSS)® statistical program. A VIF statistics >10 is indicative of a strong relevant correlation between descriptors, and the result of the analysis showed that no VIF exceeded 10 for the QSAR models constructed using either the PLS or GA-MLR method. Thus, the PLS and GA-MLR QSAR models were both considered appropriate. In this study, we developed QSAR model using the PLS and GA-MLR methods to predict anticholinergic activity as follows: R2 = 0.808, XR2 = 0.696, R2 = 0.804, XR2 = 0.682, respectively.
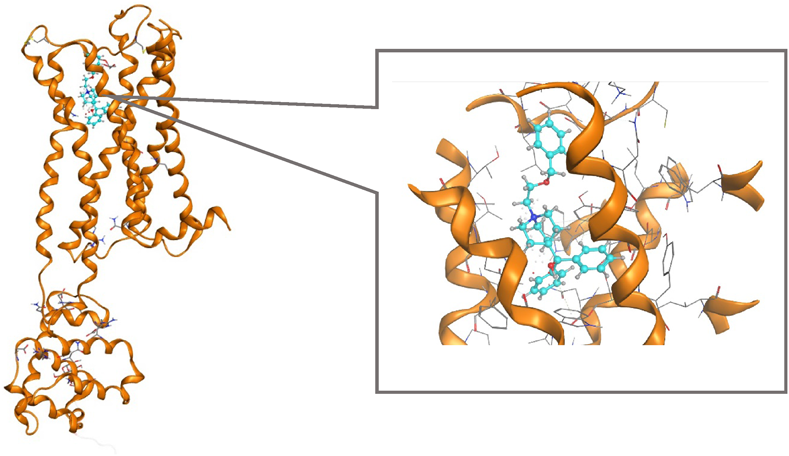
Docking StudySelection of Receptor DataThe muscarinic M3 receptor, a G protein-coupled receptor and member of the seven-pass-transmembrane domain receptor superfamily, has been suggested to play an important role in the induction of LUTS.1–7) Therefore, we used this receptor as the target protein in the docking study. There are six muscarinic M3 receptor types listed in the Protein Data Bank (PDB) and we selected the 5ZHP because it has the most recent publication year and muscarinic M3 receptor binding antagonist. Hydrogen addition, structural correction, and minimization energy were conducted with the 5ZHP. Re-docking was performed for the preprocessed receptor using the 5ZHP ligand (Fig. 4). The result showed that an almost similar binding style was identified (root mean square deviation [RMSD] = 0.29 Å). However, advanced consideration of docking simulation conditions is required.
Setting Docking Simulation ConditionsIn this procedure, 44 compounds already known to exhibit anticholinergic activity24–29) were docked with the preprocessed 5ZHP (Fig. 5). Docking simulation was performed using the initial condition in the application and the scoring function was adopted as GB/VI. After 30 trials, the top five compounds with the highest docking scores (-S) were output.
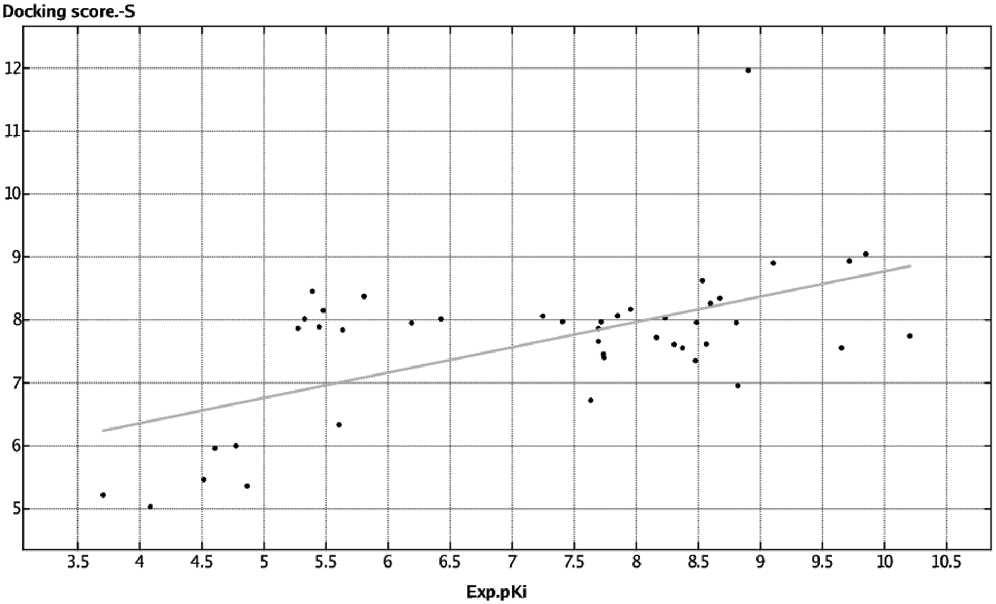
Assessment of -S ValueFigure 6 shows the relationship between the adjusted -S and bioactivity (pKi) values depicted on the vertical and horizontal axes, respectively. The results of the docking study of compounds with already known anticholinergic activity revealed a specific relationship between the -S and pKi values. Therefore, this finding suggests that the docking study was suitable for predicting the anticholinergic activity of substances.
Conclusion
We developed methods for the prediction of anticholinergic actions of drugs using with QSAR and docking study simulations. In the QSAR simulation, the QSAR models constructed using PLS and GA-MLR methods showed impressive R2 and XR2 values; however, we discovered that evaluations of QSAR models should consider both R2 and XR2 values and VIF statistics.
The docking study demonstrated a specific relationship between the -S and bioactive value. Therefore, docking study could be available for prediction of anticholinergic activity. In conclusion, these developed methods could be useful for in silico risk assessment of LUTS and plans are currently ongoing to apply these methods to several drugs, which may have anticholinergic action as serious side effects that limit their application. However, it is sometimes difficult to evaluate the prediction value, because information on drugs with anticholinergic action as the side effect is insufficient.
Experimental
Ligand structures were created using ChemDraw® (PerkinElmer, Inc.). These structures were properly preprocessed using MOE (Molecular Simulation Informatics Systems [MOLSIS] Inc.). The relevant data of the muscarinic M3 receptor, 5ZHP, used as the target protein was downloaded from PDB and was properly preprocessed. The QSAR model construction and docking study were performed using MOE and the various statistical analyses were performed using MOE and IBM SPSS® statistical program.
QSAR MethodBuilding QSAR ModelQSAR models were calculated for 82 compounds with already known anticholinergic activity.23–29) The AutoQSAR function was adopted for the model building using both the PLS and GA-MLR regression models. PLS22,39,40) is often used as one of the main regression analysis methods. GA-MLR22,41,42) is a method for finding the optimal model by referring to the mechanism of biological evolution. Generally, it is possible to calculate a simpler and more accurate model using GA-MLR although it takes more time than the PLS method.
Some conditions were considered in evaluating the constructed QSAR models. In particular, the difference between R2 and XR2 values was small, R2 was large, and the QSAR models had smaller outliers.
Statistical Analysis of QSAR ModelsStatistical analysis of the QSAR models was performed using an ANOVA and multicollinearity evaluation,33–38) and a p < 0.05 was considered statistically significant. Multicollinearity was evaluated using two methods where one involved determining the correlation between two descriptors and the other calculated the VIF statistics.38) The correlation between descriptors was analyzed using the correlation matrix function (MOE) while the VIF was analyzed by the diagnosis of collinearity function (SPSS). The reference values used were 0.9 and 10, respectively.
Docking Study MethodSelection of Receptor in PDBThe PDB ID of 5ZHP, the muscarinic M3 receptor, used as the target protein was identified. Hydrogen addition, energy minimization, and dummy site creation were conducted for 5ZHP before the docking simulation.
Setting Docking Simulation ConditionsThe docking site was selected as the ligand binding site in 5ZHP, while initial settings were adopted for the other conditions. Docking simulation was performed for 44 compounds with already known anticholinergic activity. All compounds were identified from the literature.24–29)
Docking Study EvaluationThe docking simulation output used a five point ranking score (S1–S5) while accounting for the binding energy. We converted S to the -S value, which was considered the final docking score. Predicted and experimental values were plotted (Fig. 6).
Acknowledgments
This work was supported by the Japan Society for the Promotion of Science (JSPS) KAKENHI (Grant nos. JP 16K08340).
Conflict of Interest
The authors declare no conflict of interest.
Supplementary Materials
The online version of this article contains supplementary materials.
References and Notes
- 1) Greenblatt D. J., Shader R. I., N. Engl. J. Med., 288, 1215–1219 (1973).
- 2) Abrams P., Andersson K. E., BJU Int., 100, 987–1006 (2007).
- 3) Iijima K., Wachter S. D., Wyndaele J. J., Eur. Urol., 52, 842–849 (2007).
- 4) Williams R. C., Chapple C. R., Yamanishi T., Yasuda K., Sellers D. J., J. Auton. Pharmacol., 21, 243–248 (2001).
- 5) Yoshimura N., Neurourol. Urodyn., 26 (Suppl.), 908–913 (2007).
- 6) Abraham N., Goldman H. B., Expert Opin. Pharmacother., 1, 79–93 (2015).
- 7) Kalisch Ellett L. M., Pratt L. N., Barratt J. D., Rowett D., Roughead E. E., J. Am. Geriatr. Soc., 62, 690–695 (2014).
- 8) Takahashi S., Takei M., Nishizawa O., Yamaguchi O., Kato K., Gotoh M., Yoshimura Y., Takeyama M., Ozawa H., Shimada M., Yamanishi T., Yoshida M., Tomoe H., Yokoyama O., Koyama M., Low Urin Tract Symptoms, 8, 5–29 (2016).
- 9) Blais A. S., Nadeau G., Moore K., Genois L., Bolduc S., Eur. Urol., 52, 9–13 (2016).
- 10) Woodford H. J., Drugs Aging, 2018, 773–776 (2018).
- 11) Mitsui T., Takeda M., The Pharmaceuticals Monthly, 59, 69–75 (2017).
- 12) DuBeau C. E., J. Urol., 175 (3S), S11–S15 (2006).
- 13) Gnjidic D., Johnell K., Clin. Exp. Pharmacol. Physiol., 40, 320–325 (2013).
- 14) Gnjidic D., Hilmer S. N., Blyth F. M., Naganathan V., Waite L., Seibel M. J., McLachlan A. J., Cumming R. G., Handelsman D. J., Le Couteur D. G., J. Clin. Epidemiol., 65, 989–995 (2012).
- 15) Hashimoto M., Hashimoto K., Ando F., Kimura Y., Nagase K., Arai K., J Pharm Health Care and Sci., 1, 7 (2015).
- 16) Coyne K. S., Sexton C. C., Kopp Z. S., Bitoun C. E., Milsom I., Chapple C., BJU Int., 108, 1459–1471 (2011).
- 17) Coyne K. S., Wein A. J., Tubaro A., Sexton C. C., Thompson C. L., Kopp Z. S., Aiyer L. P., BJU Int., 103 (Suppl. 3), 4–11 (2009).
- 18) Kurihara M., Rouf A. S. S., Kansui H., Kagechika H., Okuda H., Miyata N., Bioorg. Med. Chem. Lett., 14, 4131–4134 (2004).
- 19) Hakamata W., Sato Y., Okuda H., Honzawa S., Saito N., Kishimoto S., Yamamoto A., Sugiura T., Kittaka M., Kurihara M., Bioorg. Med. Chem. Lett., 18, 120–123 (2018).
- 20) Demizu Y., Nakatsu A., Sato Y., Honzawa S., Yamashita A., Sugiura T., Kittaka A., Kato S., Okuda H., Kurihara M., Lett. Org. Chem., 8, 43–47 (2011).
- 21) Nagai J., Kagaya H., Uesawa Y., Chem-Bio Informatics Journal, 18, 1–9 (2018).
- 22) MOLSIS Inc., ‹https://www.molsis.co.jp/›, cited 19 February, 2020.
- 23) Peretto I., Forlani R., Fossati C., et al., J. Med. Chem., 50, 1571–1583 (2017).
- 24) Lee N. R., Zhang X., Darna M., Dwoskin L. P., Zheng G., Bioorg. Med. Chem. Lett., 25, 5032–5035 (2015).
- 25) Sonda S., Katayama K., Fujio M., Sakashita H., Inaba K., Asano K., Akira T., Bioorg. Med. Chem. Lett., 17, 925–931 (2007).
- 26) Lee M. J., Moon J. H., Lee H. K., Cho C. H., Choi S. H., Im W. B., Eur. J. Pharmacol., 843, 240–250 (2019).
- 27) Sykes D. A., Dowling M. R., Charlton S. J., Mol. Pharmacol., 76, 543–551 (2009).
- 28) Drug interview form of Eklira®, 5th edition, KYORIN Pharmaceutical Co., Ltd., 2018.
- 29) Drug interview form of ENCLUSE®, 5th edition, GlaxoSmithKline K.K., 2018.
- 30) Hou T. J., Xia K., Zhang W., Xu X. J., J. Chem. Inf. Comput. Sci., 44, 266–275 (2004).
- 31) Oprea Tudor I., J. Comput. Aided Mol. Des., 14, 251–264 (2000).
- 32) Kazius J., McGuire R., Bursi R., J. Med. Chem., 48, 312–320 (2005).
- 33) Wildman S. A., Crippen G. M., J. Chem. Inf. Comput. Sci., 39, 868–873 (1999).
- 34) Cooley W. W., Lohnes P. R., “Multivariate Data Analysis,” Wiley, New York, 1971.
- 35) Johnson J. W., Multivariate Behav. Res., 35, 1–19 (2000).
- 36) Seva U. L., Ferrando P. J., Chico E., Behav. Res. Methods, 42, 29–35 (2010).
- 37) Gerber S. B., Finn K. V., “Using SPSS For Windows Data Analysis and Graphics,” Springer, Berlin, pp. 139–159, 2006.
- 38) Mansfield E. R., Helms B. P., Am. Stat., 26, 158–160 (1981).
- 39) Geladi P., Kowrski B. R., Anal. Chim. Acta, 185, 1–17 (1986).
- 40) Riahi S., Ganjali M. R., Moghhadam A. B., Pourbasheer E., Norouzi P., Curr. Anal. Chem., 5, 42–47 (2009).
- 41) Arcos M. J., Alonso C., Ortiz M. C., Electrochim. Acta, 43, 479–485 (1998).
- 42) Pourbasheer E., Riahi S., Ganjali M. R., Norouzi P., J. Enzyme Inhib. Med. Chem., 25, 844–855 (2010).