Abstract
17β Hydroxysteroid dehydrogenase type 3 (17β-HSD3) is the key enzyme in the biosynthesis of testosterone, which is an attractive therapeutic target for prostate cancer (PCa). H10, a novel curcumin analogue, was identified as a potential 17β-HSD3 inhibitor. The pharmacokinetic study of H10 in rats were performed by intraperitoneal (i.p.), intravenous (i.v.) and oral (p.o.) administration. In addition, the inhibitory effects of H10 against liver CYP3A4 were investigated in vitro using human liver microsomes (HLMs). The acute and chronic toxicological characteristics were characterized using single-dose and 30 d administration. All the mice were alive after i.p. H10 with dose of no more than 100 mg/kg which are nearly the maximum solubility in acute toxicity test. The pharmacokinetic characteristics of H10 fitted with linear dynamics model after single dose. Furthermore, H10 could bioaccumulate in testis, which was the target organ of 17β-HSD3 inhibitor. H10 distributed highest in spleen, and then in liver both after single and multiple i.p. administration. Moreover, H10 showed weak inhibition towards liver CYP3A4, and did not cause significant changes in aspartate transaminase (AST) and alanine transaminase (ALT) levels after treated with H10 for continuously 30 d. Taken together, these preclinical characteristics laid the foundation for further clinical studies of H10.
Introduction
Prostate cancer (PCa) is the most prevalent cancer among men, and the second leading cause of cancer-related death in men worldwide. PCa-related mortality is estimated at 385560 global deaths in 2020.1) Currently, surgery and radiation continue to be curative treatments for localized disease but have adverse effects such as urinary symptoms and sexual dysfunction that can negatively affect QOL.2) 17β Hydroxysteroid dehydrogenase type 3 (17β-HSD3) almost concentratedly expresses in testicular microsomes, which is the key enzyme in catalyzing androstenedione into testosterone,3) especially the conversion of non-androgenic androstenedione (adione) to active circulating testosterone in the presence of nicotinamide adenine dinucleotide phosphate (NADPH).4) Although 17β-HSD3 is expressed almost exclusively in the testis, it has been reported that 17β-HSD3 was also expressed in prostate cancer tissues.5,6) Notably, 17β-HSD3 inhibitors may result in fewer side effects than other hormonal treatments. Orchidectomy, or luteinizing hormone-releasing hormone (LHRH) inhibitors that act upstream to the 17β-HSD3 reaction, affecting the systemic balance of other hormones, causes adverse effects on sexual interest, function and bone mineral density. Inhibitors of 17β-HSD3 enzyme may be superior to the existing endocrine therapies regarding the off-target effects since they could act selectively in an intracrine manner.7) Because of its unique expression profile and substrate specificity, 17β-HSD3 could overall be a good target. Several groups have developed many of steroids so far, and non-steroidal 17β-HSD3 inhibitors had been also synthesized successively, such as RM-532-105, STX1383 and STX217.8) They could significantly lower the plasma testosterone levels and inhibit the androgen-dependent tumor growth in vivo. 17β-HSD3 inhibitors have become hopeful drug candidate agent in the treatment of hormone-dependent prostate cancer.9)
Curcumin was a small molecular polyphenolic compound derived from Curcuma zedoaria or Curcuma longa (both from Zingiberaceae plants). It has diversiform pharmacological activities including antioxidant, anti-inflammatory, anti-tumor, and anti-diabetes properties.10) However, the low oral bioavailability, poor absorbability, high presystemic metabolism and rapid clearance restrict their medical applications.11) A large number of curcumin analogues have been synthesized to overcome those limitations above-mentioned.12) We have reported that curcumin analogues have a regulatory effect on endocrine hormones, thus affecting the expression of HSDs enzyme.13) According to previous results, a curcumin analogue named H10, was determined as a potential 17β-HSD3 inhibitor for inhibiting testosterone production up to 90% in LC540 cells overexpressed 17β-HSD3 stably [LC540 (17β-HSD3)]. In addition, our previous animal experiments also demonstrated that H10 inhibited the growth of xenograft tumors of prostate cancer in mice.14)
The significant efficacy of H10 attracts our increasing interesting in its absorption, distribution, metabolism, and excretion (ADME) in vivo.15,16) Compound with favorable pharmacokinetics (PK) is more likely to be efficacious and safe.17) However, the pharmacokinetics of H10 still remain unknown. In addition, the inhibitory effects of H10 on human CYP enzymes (CYPs) is essential to predict potential drug–drug interactions (DDI) and toxicity.18,19) Among all the CYPs in human liver, CYP3A4 is the most abundant, which is an important metabolic enzyme involved in 46% of drug metabolism in clinics.20) However, the inhibitory activity of H10 on CYP3A4 is also unclear. Therefore, it is necessary to investigate the PK characteristics and potential DDIs of H10. To these goals, the preclinical characteristics of H10 were performed by pharmacokinetics, tissue distribution, acute and chronic toxicological testing, and inhibitory effects on liver CYP3A4. This study would be helpful to the metabolic fates of H10 in vivo.
Results
In Vivo Toxicity StudyDue to the solubility of H10, we set the maximum dose to 100 mg/kg in the acute toxicity test. The intraperitoneal (i.p.) of H10 at the dose of 50, 70 and 100 mg/kg for 14 d did not cause any behavioral abnormalities of the mice at any time point in the acute toxicity test. The body were normal weight gain during the experimental period (Table 1). After i.p. of either the vehicle or H10 (100 mg/kg/d) for 30 d, the biochemical and physiological indexes of blood did not significant changes including aspartate transaminase (AST) and alanine transaminase (ALT) (Table 2). The hematoxylin–eosin (H&E) analysis did not show any morphological alterations, and tissues were quite similar to control (Fig. 1). The results showed that H10 were relatively safe within the experimental dosages.
Table 1. Acute Toxicity Test of H10 in Mice (Mean ± S.D.)
| Dosage (mg/kg) | No. | No. of dead | Total death/mortality | Body weight (g) |
|---|
| 1–7 d | 8–14 d | 0 d | 7 d | 14 d |
|---|
| Blank | 8 | 0 | 0 | 0/0 | 25.09 ± 0.43 | 31.09 ± 1.25 | 37.67 ± 1.18 |
| 50 | 8 | 0 | 0 | 0/0 | 24.55 ± 0.79 | 31.60 ± 1.15 | 36.69 ± 0.94 |
| 70 | 8 | 0 | 0 | 0/0 | 24.90 ± 0.60 | 31.75 ± 0.88 | 35.85 ± 1.36 |
| 100 | 8 | 0 | 0 | 0/0 | 25.34 ± 1.08 | 30.28 ± 1.88 | 36.82 ± 1.54 |
Table 2. Effect of H10 on Biochemical Parameters in Rats Treated Daily for 30 d at the Dose of 100 mg/kg (Mean ± S.D.;
n = 8)
| Parameter | Control | 30 d |
|---|
| Glucose | 2.33 ± 0.70 | 2.85 ± 0.82 |
| Triglycerides | 0.54 ± 0.23 | 0.55 ± 0.16 |
| Cholesterol | 1.74 ± 0.29 | 1.92 ± 0.38 |
| ALT | 64.13 ± 10.52 | 65.92 ± 11.47 |
| AST | 251.00 ± 56.81 | 289.00 ± 57.79 |
| ALP | 280.71 ± 52.21 | 289.00 ± 57.79 |
| Urea | 5.00 ± 0.69 | 4.76 ± 0.98 |
| Creatinine | 37.86 ± 6.20 | 34.42 ± 5.82 |
| Uric acid | 2.49 ± 0.10 | 2.54 ± 0.11 |
Each value represents the mean ± S.D.
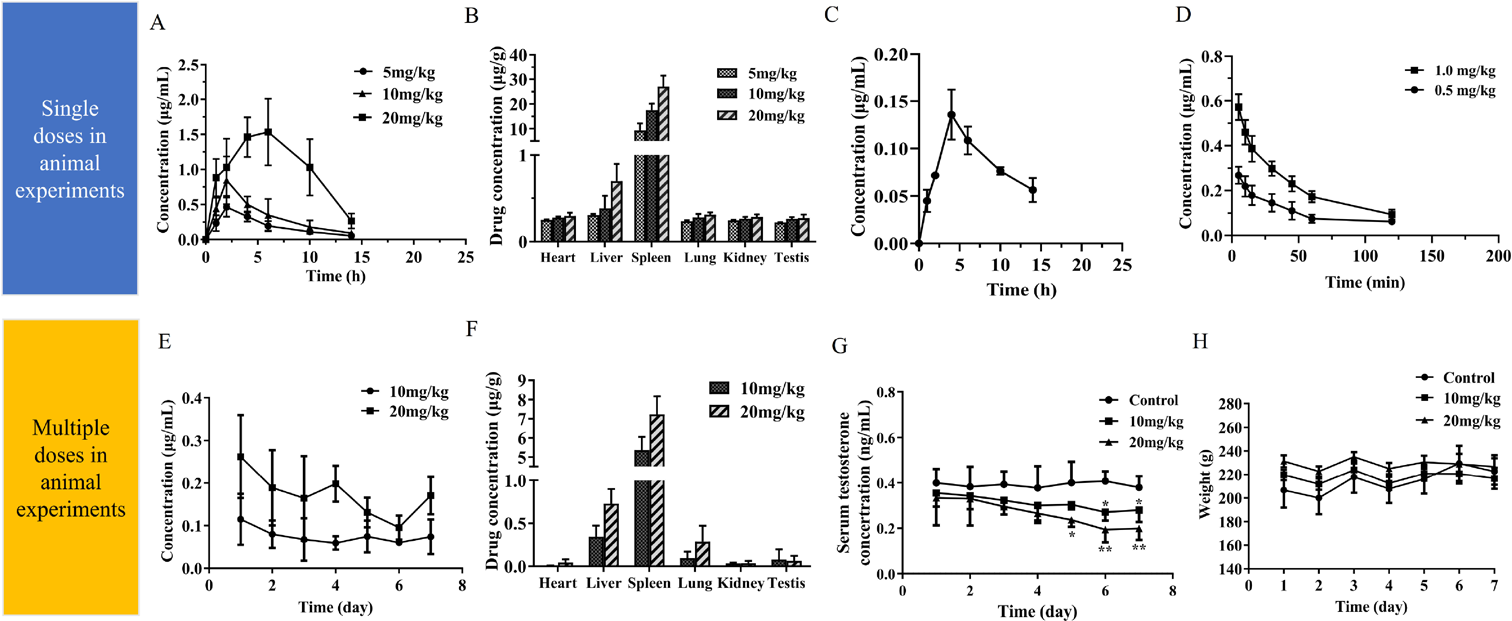
As the first step of our in vivo studies, we measured at different times (1, 2, 4, 6, 10, 14 and 24 h) the concentration of inhibitor present in blood following a single i.p. of 5, 10 and 20 mg/kg in rat (Fig. 2A). The pharmacokinetic parameters were shown in Table 3, at the highest dose, the inhibitor achieved a maximum plasma concentration of 1.84 µg/mL at 5.2 h and the area under the curve (AUC)0–24h was 15.86 µg·h/mL. For the dose of 10 mg/kg, the Cmax of H10 reached 0.85 µg/mL at 2 h. At the lowest dose, the Cmax of H10 reached 0.46 µg/mL at 2 h. Meanwhile, we determinate the pharmacokinetic data by oral (p.o.) (10 and 20 mg/kg), the results show that the inhibitor had a maximum plasma concentration of 0.14 µg/mL and the AUC0–24h was 1.37 µg·h/mL at the dose of 20 mg/kg. There were only two point-in-time (4 and 6 h) above the lower limit of quantification at the dose of 10 mg/kg, so we could not fit a plasma concentration–time curve of it. (Fig. 2C and Table 3). As shown in Fig. 2D and Table 3, the pharmacokinetic data were investigated by intravenous (i.v.) (0.5 and 1.0 mg/kg), the results show that the AUC0–24h was 0.33 µg·h/mL at the dose of 0.5 mg/kg. For the dose of 1.0 mg/kg, the AUC0–24h was 0.61 µg·h/mL. As shown in Fig. 2E, the steady plasma–drug concentration ( ) were 0.18 and 0.66 µg/mL after 7 d i.p. at the dose of 10 and 20 mg/kg.
Table 3. Summary of the Pharmacokinetic Parameters of H10 in Rats after a Single i.p., i.v. and
p.o. Administration (Mean ± S.D.;
n = 6)
| Parameter | Intraperitoneal injection | Oral administration | Intravenous injection |
|---|
| 5 mg/kg | 10 mg/kg | 20 mg/kg | 20 mg/kg | 0.5 mg/kg | 1.0 mg/kg |
|---|
| t1/2 (h) | 3.52 ± 1.15 | 3.11 ± 0.66 | 2.43 ± 0.29 | 5.24 ± 2.44 | 0.73 ± 0.017 | 0.69 ± 0.053 |
| Tmax (h) | 2.00 ± 0.10 | 2.00 ± 0.10 | 5.20 ± 1.10 | 4.67 ± 1.15 | — | — |
| Cmax (µg/mL) | 0.46 ± 0.14 | 0.85 ± 0.30 | 1.84 ± 0.44 | 0.14 ± 0.030 | — | — |
| AUC0–t (µg/mL·h) | 2.62 ± 0.51 | 4.39 ± 1.67 | 15.86 ± 1.78 | 1.37 ± 0.17 | 0.33 ± 0.045 | 0.61 ± 0.023 |
| AUC0–∞ (µg/mL·h) | 2.86 ± 0.48 | 4.72 ± 1.72 | 17.32 ± 2.51 | 1.49 ± 0.250 | 0.35 ± 0.049 | 0.64 ± 0.028 |
| MRT (h) | 6.14 ± 1.39 | 5.35 ± 1.02 | 7.81 ± 1.25 | 10.1 ± 2.98 | 1.03 ± 0.014 | 0.97 ± 0.11 |
| CL/F [(mg/kg)/(µg/mL)/h] | 1.79 ± 0.31 | 2.47 ± 1.01 | 1.18 ± 0.20 | 13.7 ± 2.41 | 1.58 ± 0.24 | 1.72 ± 0.083 |
H10 could distributed in various organs in vivo either a single dose or multiple doses. After 24 h of i.p., the concentrations of H10 in spleen, either single (Fig. 2B) or multiple administrations (Fig. 2F), were much higher than those in other tissues. The concentrations of H10 in spleen were 9.23 µg/g at 5 mg/kg, 17.48 µg/g at 10 mg/kg and 26.98 µg/g at 20 mg/kg with a single administration. After 7 d of treatment, the spleen accumulated 5.36 µg/g at 10 mg/kg and 7.24 µg/g at 20 mg/kg of H10. It means that the H10 was accumulated in the spleen when it was almost eliminated in blood within 24 h of intraperitoneal injection. Compared with the control group, H10 (10 and 20 mg/kg) reduced serum T level of Sprague-Dawley (SD) rats and leveled off on day 6 (Fig. 2G). As shown in Fig. 2H, there was no significant change in body weight after 7 d of administration.
Effect of H10 on Liver CYP3A4 Activities in Human Liver Microsomes (HLMs)In this study we examined the optimal conditions for incubating HLMs, which determined the optimal incubation time was 20 min (Fig. 3A), the concentration of midazolam (MDZ) was 10 µmol/L (Fig. 3B), and the protein concentration was 1.0 mg/mL (Fig. 3C). The Km and Vm values of CYP3A4 were calculated by non-linear regression analysis of experimental data according to the Michaelis–Menten model of enzyme kinetics, the Km values of CYP3A4 was 12.38 µmol/L and the Vm values was 0.36 nmol/mg/min. As shown in the Fig. 3D, the IC50 values of H10 towards CYP3A4 in HLMs was 38.9 ± 2.37 µmol/L. Thus, when compared with the control group, H10 inhibited either the MDZ reduction or 1-OH MDZ production. Further, decrease in the activities of CYP3A4 became more pronounced with the increase in incubation time and H10 concentration (Fig. 3E).
Discussion
Preclinical pharmacokinetics and metabolic study are an indispensable part to the development of new drug candidate agent. Dose of the drug candidate influences the therapeutic effect or causes adverse drug effect, and most adverse drug effects are dose dependent.21) Therefore, we first explored the safe dose to make sure that all the experiments were performed within the safe dose range. Due to the poorly solubility of H10, we decreased progressively from maximum dose of 100 mg/kg in the acute toxicity tests. After the long-term safety assessment (100 mg/kg/d for 30 d), the biochemical and physiological indexes of blood did not significant changes including AST and ALT levels. The H&E analysis did not show any morphological alterations, and tissues were quite similar to control.
In our pharmacokinetics research, dosage of administration was 5, 10 and 20 mg/kg as same as the pharmacodynamics investigation which were in the safe dose range. The design of blood collection points was based on the results of the previous experiments. In our study, the total blood collection time was more than 3 times of the t1/2, the concentrations of final blood collection point were less than 1/20 of the Cmax. According to the results, blood collection design is in line with the guidelines for PKs research.22)
Due to the poor solubility of H10, 10% dimethyl sulfoxide-90% aqueous methylcellulose (0.4% (w/v)) was used as the solvent of H10 according to the reference.23) According to the characteristics of linear pharmacokinetics,24) the t1/2 and CL/F were independent of the dose, the AUC and Cmax were proportional to the dose. We performed the linear regression, the results showed that the dosage have good correlations with AUC (R2 = 0.9565) and Cmax (R2 = 0.9988), suggesting AUC and Cmax were dose-dependent. Meanwhile, both t1/2 and CL/F were independent of dosage, indicating that H10 elimination was linear pharmacokinetic. Surprisingly, Tmax value was longer at 20 mg/kg than those at 5 and 10 mg/kg. Similar results were observed in previous study.25) This could be attributed to that the inhibitor is more likely to aggregate at high doses, resulting in slower elimination.
The concentrations of H10 in testis were 0.22 µg/g at 5 mg/kg, 0.26 µg/g at 10 mg/kg and 0.30 µg/g at 20 mg/kg with a single administration. It means that H10 could bioaccumulate in testis, which was the target organ of 17β-HSD3 inhibitor. In order to increase the concentration of the drug in the target organ, appropriate size of pharmaceutical preparation should be design seriously for H10. Particle size reduction is a well-established method for improving the bioavailability. By reducing the crystal size of a drug, the surface area increases and improves the dissolution rate, according to the Noyes-Whitney equation.26) Improved dissolution can lead to enhanced drug absorption, reduce the clinical dose and increase the concentration of H10 in the testes to provide prostate cancer patients with a more efficient formulation.
We found H10 was most distributed in the spleen, and then we speculated that it would be related to the characters of H10 in solvent. Therefore, we measured the particle size and Zeta potential diagram of H10 suspension, and supplemented the results in supplementary Fig. 1. The average size of the H10 suspension was (905.1 ± 24.1) nm and average zeta potential was (–2.37 ± 0.19) mV. Particles larger than 100 nm could be filtered off, internalized by spleen red pulp macrophages and slowly destroyed, and particle removal by splenic filtration tends to increase with size.27) Bi et al. verified that CUR-NS of 70 nm accumulated more in the brain, whereas CUR-NS of 200 nm accrued more in spleen and liver.28) The magnitude of zeta-potential indicated the stability by electrostatic or charge repulsion or attraction between particles. In general, the good dispersion stability shows as a large negative or positive zeta-potential of the particles. These findings indicated H10 particles were more likely to capture by spleen, and so the height drug concentration in spleen were detected.
The study of tissue distribution after H10 i.p. administration showed liver was the second abundant cumulative organs for H10. As the major organ for drug metabolic processes, the liver accumulation of large drugs or their metabolites, could cause hepatic injury and toxicity.29) CYP3A4 is the most abundant enzyme in human liver CYPs. In fact, induction or inhibition of the CYP3A4 by different drugs and/or chemical compounds could lead to impact of treatment effects or drug–drug interaction.30) H10 inhibited the enzyme activity of liver microsomal CYP3A4, which may cause that elevation of the Cmax values, and prolonging t1/2 of the co-administered protease inhibitors resulting in better efficacy and less frequent dosing. Furthermore, high lipophilicity of a compound not only improves its permeability but is responsible for the high affinity of the drug for CYP450 enzymes which leads to increased metabolism and decreased metabolic stability of the compound.
Conclusion
H10 is a promising 17β-HSD3 specific inhibitor for PCa treatment as published previously. In this study, safety evaluation and pharmacokinetics of H10 were studied for preclinical study. In both acute and chronic toxicity experiments, H10 did not cause animal mortality and no obvious changes in the clinical signs and body weights. The pharmacokinetic characteristics of H10 fitted with linear dynamics model after single dose and was concentratedly distributed in spleen. H10 showed weak inhibition of liver drug enzyme CYP3A4 in vitro using HLMs. Taken together, H10 showed good safety and favorable pharmacokinetic properties in vivo.
Experimental
Chemicals and ReagentsCurcumin analogue H10 (HPLC purity > 98%) and H12 (IS, HPLC purity > 98%), were synthesized by Professor Huang Shiliang, Sun Yat-Sen University in China. Pooled HLMs were purchased from Research Institute for Liver Diseases Co., Ltd. (Shanghai, P. R. China). Midazolam (MDZ), 1-hydroxymidazolam (1-OH MDZ), diazepam (DZP), β-nicotinamide adenine dinucleotide phosphate (NADPH) were purchased from Sigma-Aldrich (St. Louis, MO, U.S.A.). Methanol, cetonitrile, ethyl acetate and trifluoroacetic acid (TFA) were HPLC-grade reagents from Merck Company (NJ, U.S.A.). All other chemicals used were analytical grade.
AnimalsAdult male SD rats (200 ± 20 g, animal qualified certificate No. 44007200068702) and male Kunming (KM) mice (20 ± 2 g, animal qualified certificate No. 44007200059490) were supplied by the Guangdong Medical Laboratory Animal Center (Guangdong, P. R. China). Rats and mice were kept in different animal room respectively with constant temperature of (25 ± 2) °C and humidity of (55 ± 10)% on a 12-h light/dark cycle with free access to water and food. The experimental protocol was approved by the Ethics Review Committee for Animal Experimentation of Jinan University in Guangzhou (ethical review No. 20170301003) and all experiments were conducted in accordance with the National Institutes of Health guide for the care and use of Laboratory animals (NIH Publications No. 8023, revised 1996).
Toxicity Study of H10 in VivoFor acute toxicity study, thirty-two male KM mice (20 ± 2) g, while the control group mice received the vehicle alone, the three H10 group mice received different concentrations of H10 (i.p., 50, 70 and 100 mg/kg, n = 8 of each group) at a single dose. The mice survival and body weights were monitored and recorded up to 7 d and 14 d post treatment.
For chronic toxicity study, the male SD rats (200 ± 20) g were treated with H10 (i.p., 0, 100 mg/kg, n = 8 of each group) once daily for 30 d. After 12 h of last treatment, the bloods from the orbital venous plexus were drawn and centrifuged at 3000 rpm for 10 min to collect the blood serum for the determination of GLU, blood urea nitrogen (BUN), creatinine (CREA), Ca, ALT, AST, alkaline phosphatase (ALP), CHOL and triglyceride (TG) levels by using an automatic biochemistry analyzer (LX20, Beckman Coulter Inc., Miami, FL, U.S.A.). After then the animals were sacrificed by neck dislocation. Tissue samples were fixed in 4% paraformaldehyde (PFA) and then embedded in paraffin wax. Sections of tissue were cut and stained by H&E as well as examined for histopathological changes.
Application to Pharmacokinetics and Tissue Distribution StudyFirst Assay (1-d Treatment)In this study, H10 was suspended in 10% dimethyl sulfoxide-90% aqueous methylcellulose (0.4%, w/v). Male SD rats were treated with H10 (i.p., 0, 5, 10 and 20 mg/kg, n = 6 of each group) and (p.o., 0, 10 and 20 mg/kg, n = 6 of each group), serial blood samples were collected from fosse orbital vein at 0, 1, 2, 4, 6, 10, 14, 24 h after dosing, respectively. Meanwhile, male SD rats were treated with H10 (i.v., 0, 0.5 and 1.0 mg/kg, n = 6 of each group), serial blood samples were collected from fosse orbital vein at 0, 5, 10, 15, 30, 45, 60, 120, 180 min after dosing, respectively. Blood samples were centrifuged at 3000 rpm for 10 min. Supernatant blood layer was transferred into another tube and stored at –80 °C until analysis. After 24 h of i.p., the rats were sacrificed by neck dislocation, tissue samples (heart, liver, spleen, lung, kidney and testis) were collected and stored at –80 °C until analysis.
Second Assay (7-d Treatment)Male SD rats were treated with H10 (0, 10 and 20 mg/kg, n = 6 of each group) by continuous i.p. for 7-d. After 4 h of daily administration, serial blood samples were collected from fosse orbital vein and the supernatant blood layer were stored at –80 °C until analysis. Serum samples were collected for determination of testosterone levels using the Iodine [125I] Testosterone Radioimmunoassay Kit. Four hours after the 7th day of treatment, rats followed by cervical dislocation and tissue from rats were rapidly trimmed, weighed and stored at -80 °C.
Determination of H10 ConcentrationChromatographic Conditions and Method ValidationChromatographic separation was performed on Nexera-i LC-2040C 3D HPLC system (Shimadzu, Japan). An InertSustain® C18 column (4.6 × 250 mm, 5 µm; Shimadzu, Japan) was employed and the column temperature was maintained at 40 °C. The mobile phase was composed of 0.1% trifluoroacetic acid in water, methanol and acetonitrile (49 : 5 : 46, v/v/v) at a flow of 0.8 mL/min. Sample injection volume was 20 µL. The method was validated for selectivity, linearity, the lower limit of quantification, accuracy, precision, recovery, and the stability of H10 in rat plasma and tissue homogenates, following the U.S. Food and Drug Administration (FDA) Guidance for industry on bio-analytical method validation procedures. Among HPLC method, separating degree and repeatability are more practical parameters in system applicability test. As shown in Fig. 4, H10 could be well separated from H12 (IS). The linearity, precision, accuracy and recovery of the method were conform to the analysis requirements of biological samples.
Preparation of SamplesThe analytes were extracted by solvents extraction, using H12 as internal standard (IS). The tissues were homogenized with icy normal saline (0.9% NaCl, 1 : 5, w/v), then centrifuged at 13000 rpm for 10 min. Collect the supernatant for later use.
In brief, 180 µL plasma or supernatant of tissue homogenate was spiked with 20 µL H12 (2 µg/mL) and 2 mL ethyl acetate, vortexed 1 min, and centrifuged at 4000 rpm for 5 min. Then the supernatants were transferred and evaporated to dryness under a gentle stream of nitrogen. Next, the residue was reconstituted with 200 µL methanol and filtered by 0.45 µm filter membrane. The concentrations of H10 were measured using the HPLC method above.
In-Vitro Assessment of Liver CYP3A4 Activities in HLMsThe enzyme activity of CYP3A4 was determined by using MDZ as substrate.31) We optimized the incubation time, MDZ concentration and protein concentration of HLMs, and according to the Michaelis–Menten model of enzyme kinetics to estimate the kinetic parameters.32) The IC50 of H10 on the inhibition of CYP3A4 activity were determined in a total volume of 200 µL, the concentrations of H10 ranged from 0.01–200 µM were incubated with HLMs (1.0 mg/mL) in Tris–HCl buffer (50 mM, pH 7.4), MgCl2 (20 mM) at 37 °C. After a 5 min warm up period, reactions were initiated with addition of NADPH (2 mM). Incubations were conducted at 37 °C for 20 min and then terminated by the addition of 200 µL ice-cold acetonitrile containing DZP (8 µg/mL) to terminate the reaction. All samples were vortex mixed, centrifuged at 12000 rpm for 15 min and the supernatant were collected to determinate the concentration of 1-OH MDZ. According to the IC50 values, the concentration of H10 (0, 4, 16 and 40 µM) and incubation time (0, 5, 10, 25 and 40 min) were determined for the inhibition of CYP3A4 activity in HLMs.
The chromatographic separation of MDZ and 1-OH MDZ were performance HPLC with an InertSustain® C18 column (4.6 × 250 mm, 5 µm; Shimadzu, Japan). The mobile phase was water (10 mmol/L CH3COONH4, pH 7.4) and acetonitrile (57 : 43, v/v, flow rate of 1.0 mL/min). Sample injection volume was 50 µL.
Statistical AnalysisAll data were expressed as mean ± standard deviation (S.D.) of at least three independent experiments. PK parameters were calculated using the PK solver 2.0. Statistical analyses were performed using GraphPad Prism 8 software (GraphPad Software Inc., La Jolla, CA, U.S.A.). Differences among more than two groups were analyzed by one-way ANOVA followed by a Tukey HSD comparison test. Values of p < 0.05 were considered as statistically significant.
Acknowledgments
This work was supported by the Major Scientific and Technological Special Project of the Administration of Ocean and Fisheries of Guangdong Province [GDME-2018C013, Yuecainong, 2017, No. 17], Guangzhou Science and Technology Program key projects [201803010044]. Thanks to the research group of Professor Huang Shiliang, Sun Yat-Sen University in China for providing curcumin analogues (H10 and H12).
Conflict of Interest
The authors declare no conflict of interest.
Supplementary Materials
The online version of this article contains supplementary materials.
References
- 1) Siegel R. L., Miller K. D., Jemal A., CA Cancer J. Clin., 69, 7–34 (2017).
- 2) Litwin M. S., Tan H. J., JAMA, 317, 2532–2542 (2017).
- 3) Massanyi E. Z., Gearhart J. P., Kolp L. A., Migeon C. J., Urology, 81, 1069–1071 (2013).
- 4) Roy J., Fournier M. A., Maltais R., Kenmogne L. C., Poirier D., J. Steroid Biochem., 141, 44–51 (2014).
- 5) Djigoue G. B., Kenmogne L. C., Roy J., Maltais R., Poirier D., Bioorg. Med. Chem., 23, 5433–5451 (2015).
- 6) Koh E., Noda T., Kanaya J., Namiki M., Prostate, 53, 154–159 (2010).
- 7) Ning X., Yang Y., Deng H., Zhang Q., Huang Y., Su Z., Fu Y., Xiang Q., Zhang S., Steroids, 121, 10–16 (2017).
- 8) Cortés-Benítez F., Roy J., Maltais R., Poirier D., Bioorg. Med. Chem., 25, 2065–2073 (2017).
- 9) Day J. M., Foster P. A., Tutill H. J., Schmidlin F., Sharland C. M., Hargrave J. D., Vicker N., Potter B. V. L., Reed M. J., Purohit A., Endocr. Relat. Cancer, 20, 53–64 (2013).
- 10) Salehi B., Stojanović-Radić Z., Matejić J., Sharifi-Rad M., Anil Kumar N. V., Martins N., Sharifi-Rad J., Eur. J. Med. Chem., 163, 527–545 (2019).
- 11) Morazzoni P., Riva A., Ronchi M., Planta Med., 80, 758–758 (2014).
- 12) Fiona Rodriguesa C., Anil Kumar N. V., Eur. J. Med. Chem., 177, 76–104 (2019).
- 13) Yuan X., Li H., Bai H., Su Z., Xiang Q., Wang C., Huang Y., Eur. J. Med. Chem., 77, 223–230 (2014).
- 14) Cheng Y., Yang Y., Wu Y., Wang W., Xiao L., Zhang Y., Tang J., Huang Y., Zhang S., Xiang Q., Front. Pharmacol., 11, 637 (2020).
- 15) Guo Z. R., Yao Hsueh Hsueh Pao, 47, 144–157 (2012).
- 16) Andrade E. L., Bento A. F., Cavalli J., Oliveira S. K., Schwanke R. C., Siqueira J. M., Braz. J. Med. Biol. Res., 49, 12 (2016).
- 17) Fan J., de Lannoy I. A., Biochem. Pharmacol., 87, 93–120 (2014).
- 18) Knights K. M., Stresser D. M., Miners J. O., Crespi C. L., Curr. Protocols Pharmacol., 74, 7–8 (2016).
- 19) Olsen L., Oostenbrink C., Jørgensen F. S., Adv. Drug Deliv. Rev., 86, 61–71 (2015).
- 20) Almazroo O. A., Miah M. K., Venkataramanan R., Clin. Liver Dis., 21, 1–20 (2017).
- 21) Kane-Gill S. L., Pharmacotherapy, 38, 782–784 (2018).
- 22) Tozer T. N., Rowland M., “Introduction to pharmacokinetics and pharmacodynamics: the quantitative basis of drug therapy,” ed. by Lippincott Williams & Wilkins, Philadelphia (2006).
- 23) Cortés-Benítez F., Roy J., Perreault M., Maltais R., Poirier D., J. Med. Chem., 62, 15 (2019).
- 24) Yang X., Hu Z., Chan E., Duan W., Zhou S., Curr. Drug Metab., 7, 565–576 (2006).
- 25) Roy J., Fournier M., Maltais R., Kenmogne L., Poirier D., J. Steroid Biochem. Mol. Biol., 141, 44–51 (2014).
- 26) Dokoumetzidis A., Macheras P., Int. J. Pharm., 321, 1–11 (2006).
- 27) Fan W., Yu Z., Peng H., He H., Lu Y., Qi J., Dong X., Zhao W., Wu W., Int. J. Pharm., 586, 119551 (2020).
- 28) Bi C., Miao X. Q., Chow S. F., Wu W. J., Yan R., Liao Y. H., Zheng Y., Nanomedicine, 13, 943–953 (2017).
- 29) Ye H., Nelson L. J., del Moral M. G., Martínez-Naves E., Cubero F. J., World J. Gastroenterol., 24, 1373–1385 (2018).
- 30) Lu J., Zhang Y., Sun M., Liu M., Wang X., Phytomedicine, 26, 1–10 (2017).
- 31) Jamwal R., de la Monte S. M., Ogasawara K., Adusumalli S., Barlock B. B., Akhlaghi F., Mol. Pharm., 15, 2621–2632 (2018).
- 32) Lu Y., Xie T., Zhang Y., Zhou F., Ruan J., Zhu W., Zhou X., BMC Complement. Altern. Med., 17, 15 (2017).