Abstract
This study aimed to compare the manufacturability and granule and tablet properties of green fluidized bed granulation (GFBG) and of direct compression (DC). Acetaminophen was used as a low compactability model drug. The process time of GFBG to produce final mixtures was comparable to that of DC, and thus GFBG could be considered a simple process. DC could not produce 30% drug load tablets owing to poor granule flowability, whereas no problems were observed in the GFBG tableting process up to 80% of drug load. Tablets prepared with GFBG showed higher tensile strength than those prepared using DC. Compactability evaluation results show that the yield pressure of the granules prepared with GFBG was significantly lower than that of DC, suggesting that the granules prepared with GFBG were easily plastically deformed. Moreover, tablets prepared with GFBG showed fast disintegration, which was faster than that of DC. We conclude that GFBG produces granules with higher drug content and desired physicochemical properties at low cost.
Introduction
In the pharmaceutical field, direct compression (DC) is widely used as a manufacturing method for oral dosage tablets.1–3) DC consists of only three processes, sieving, blending, and tableting, and require only three main pieces of manufacturing equipment to produce tablets, the blender, sieving, and tableting machines. This simple manufacturing process reduces the effort of transferring intermediates to other machines and cleaning equipment. Therefore, it is considered the simplest and most economical manufacturing method for oral dosage forms compared to the other manufacturing methods of wet granulation and dry granulation.4,5) DC is also beneficial for moisture- and heat-sensitive active pharmaceutical ingredients (APIs) because DC requires no granulation water or heating processes.1–4,6,7)
The characteristics of an API have an impact on the final mixture and tablet properties of DC. In general, most API show relatively small particle sizes and non-spherical particle shape,8) leading to manufacturing problems and high variability of content uniformity for DC due to low flowability and high cohesivity. Functional excipients are available for improving the flowability and compaction properties of the commercial base. However, these excipients have little impact on high drug load DC formulations, especially over 20 or 30%.3) In these cases, the granulation process is necessary to overcome undesirable API characteristics.9)
Wet granulation technology is widely used to improve granule and tablet properties. In particular, high shear granulation (HSG) is one of the most widely used wet granulation methods because it enables the production of well-flowing granules with uniform API content. On the other hand, HSG is inferior to DC and dry granulation in terms of production costs owing to the drying process and the need to transfer the intermediate products to other machines. Thus, we focused on moisture-activated dry granulation (MADG), which was initially described by Ullah et al.,10) as an eco-friendly manufacturing method that could be an alternative to conventional manufacturing methods of oral dosage tablets. In general, MADG can be separated into two processes: the agglomeration step and the moisture absorption step.11,12) After the agglomeration process, the moisture absorption process is conducted using MADG instead of the heat-mediated drying process. In this process, water-insoluble excipients such as microcrystalline cellulose and colloidal silicon dioxide are usually used as moisture absorbents, and the powder is agitated, whereby water content is reduced and uniformly distributed. Many studies have recently focused on MADG.8,13–20)
We have reported a new granulation technology, green fluidized bed granulation (GFBG), which applies the concept of MADG to a conventional fluidized bed granulator.21) The disadvantage of the conventional fluidized bed granulation (FBG) process is that it requires a longer granulation time. According to a previous study,21) GFBG took 15 min to prepare the final mixture, whereas conventional FBG took 107 min, because GFBG uses a lower amount of granulation water without a heating process. Hence, GFBG could be considered an eco-friendly wet granulation technology. Additionally, the granules prepared with GFBG showed higher tensile strength than those of HSG and MADG owing to the irregular and porous shape of the granules. Moreover, tablets prepared with GFBG granules showed the fastest disintegration compared to those with MADG, FBG, and HSG.21) In terms of tensile strength and disintegration time, GFBG showed a wider acceptable range in the amount of added water than that of MADG.22) These results indicate that GFBG is a simple and eco-friendly manufacturing process compared to the classical wet granulation process, achieving good granule and tablet properties and reducing the undesirable characteristics of APIs such as high cohesivity and low compaction properties. However, previous studies of GFBG were conducted using only placebo formulations.
It is very important to investigate how many drug loads can be applied with GFBG. Therefore, we used acetaminophen (APAP), which has been widely reported to have poor compaction properties in general, as a model drug. Blending with appropriate excipients, granulation, milling, and modifying crystallization are usually conducted to improve the flowability and compaction properties of APAP23–27) because it is a material that even at low doses frequently leads to capping in the tableting process owing to high elastic deformation.28) In this study, we aimed to investigate the number of drug contents that GFBG can be applied to and evaluate the manufacturability and properties of granules and tablets in GFBG.
Experimental
MaterialsTable 1 shows the formulations used in this study. Except for lactose grade, all compositions were the same. APAP (d50 = 35.4 µm) was purchased from Zhejiang Kangle pharmaceutical (Wenzhou Zhejiang, China). Lactose monohydrate and agglomerated lactose (Granulac 200 and Tablettose 80, respectively) from Meggle (Wasserburg, Germany), polyvidone (Povidone K12) and crospovidone (Kollidon CL) from BASF (Ludwigshafen, Germany), microcrystalline cellulose (Avicel PH102 SCG) from FMC (Philadelphia, PA, U.S.A.), colloidal silicon dioxide (Aerosil 200) from Degussa (Frankfurt, Germany), and magnesium stearate (magnesium stearate vegetable) from Faci (Carasco, Italy).
Table 1. Formulation Used in This Study
| (A) GFBG |
|---|
| Process stage | Composition | % |
|---|
| Added water (%) | 3.5 | 3.5 | 4.5 | 4.5 |
|---|
| 1 | Acetaminophen | 20.0 | 30.0 | 50.0 | 80.0 |
| Lactose monohydrate | 45.0 | 35.0 | 15.0 | — |
| Polyvidone | 5.0 | 5.0 | 5.0 | 5.0 |
| 2 | Microcrystalline cellulose | 26.4 | 26.4 | 26.4 | 11.4 |
| Colloidal silicon dioxide | 0.1 | 0.1 | 0.1 | 0.1 |
| 3 | Crospovidone | 2.5 | 2.5 | 2.5 | 2.5 |
| Magnesium stearate | 1.0 | 1.0 | 1.0 | 1.0 |
| Total | 100.0 | 100.0 | 100.0 | 100.0 |
1 = Pre-mixing/granulation; 2 = Absorption; 3 = Blending and final blending.
| (B) DC |
|---|
| Process stage | Composition | % |
|---|
| 1 | Acetaminophen | 20.0 | 30.0 |
| Agglomerated lactose | 45.0 | 35.0 |
| Polyvidone | 5.0 | 5.0 |
| 2 | Microcrystalline cellulose | 26.4 | 26.4 |
| Colloidal silicon dioxide | 0.1 | 0.1 |
| Crospovidone | 2.5 | 2.5 |
| Magnesium stearate | 1.0 | 1.0 |
| Total | 100.0 | 100.0 |
1 = Sieving and mixing 1; 2 = Mixing 2 and final blending.
Figure 1 shows the manufacturing flow of the GFBG. All processes were conducted using an MP-01 fluidized bed granulator (Powrex, Japan). The batch size was 700 g. The details of the manufacturing conditions of GFBG have been described in our previous study.21) Briefly, APAP, lactose monohydrate, and polypividone were placed into a fluidized bed granulator and blended for 1 min. Pre-blended mixtures were granulated with sprayed water. After granulation, moisture absorbents, microcrystalline cellulose, and colloidal silicon dioxide were blended for 5 min. Finally, crospovidone was placed into the granulator and blended for 1.5 min, and then pre-sieved magnesium stearate was added to the granulator and blended for 0.5 min. The final blends were sieved using a sieving machine (Quadro Comil U5; Powrex) with a 1.0 mm rasp sieve.
DCThe manufacturing flow of the DC is shown in Fig. 2. The batch size was 700 g. First, in order to improve mixability, APAP, the excipient granulated lactose monohydrate, and the binder polyvidone were initially sieved for 4 min. They were then placed into a blender (Turbla mixer, T2F, Shinmaru Enterprises, Japan) and mixed for 5 min. Microcrystalline cellulose, colloidal silicon dioxide, and crospovidone were added directly into the blender and mixed for 5 min. Finally, pre-sieved magnesium stearate lubricant was added directly to the blender and mixed for 2 min.
Evaluation of Particle MorphologyThe particle morphology of the final mixtures was assessed with scanning electron microscope (SEM) images obtained using a TM3000 Microscope (Hitachi High-Tech, Japan). Briefly, samples were placed on a plate and coated with Au using a sputtering coating device (MSP-mini magnetron sputter, Shinkuu device) before imaging.
Measurement of Particle Size DistributionThe particle size distribution of the final mixtures was determined using a sieve analysis machine (Robot Shifter RPS-95; Seishin, Japan) with aperture sizes ranging from 63 to 500 µm. Approximately 5 g of the final mixture was placed on the top of the sieve tower and shaken for 5 min with Level 4 vibration and a pulse interval of 1 s (n = 1). The relative width of the particle size distribution (Rw) was calculated using the following equation:
where d10, d50, and d90 are 10, 50, and 90%, respectively, of the accumulated particle size on a screen.
Additionally, the d50 of APAP was measured using a laser diffraction particle size analyzer (SALD-7100, Shimadzu, Japan).
Measurement of Bulk Density and Tapped DensityThe bulk and tapped densities of the final mixtures were evaluated with a 100 mL sample cup using a powder property measurement system (Tapped density tester SVM121, ERWEKA) by applying 1250 taps (n = 1). In addition, the hausner ratio (HR), an indicator of flowability, was calculated using the following equation:
where ρbulk and ρtapped are bulk and tapped density, respectively.
Additionally, the HR was classified according to the U.S. Pharmacopedial Convention benchmarks. As a standard, HR of 1.00–1.11 represents excellent, 1.12–1.18 represents good, 1.19–1.25 represents fair, 1.26–1.34 represents passable, 1.35–1.45 represents poor, and 1.46–1.59 represents very poor.
Measurement of Flow TimeThe flow time as an indicator of flowability of final mixtures was measured using a granule flow tester (GTB, ERWEKA). A 100 mL hopper equipped with a 10 mm diameter nozzle was filled with the final mixtures of 100 g and the time taken for all the samples to flow out of the hopper was measured. If the powder did not flow completely, it was considered not measurable.
Measurement of Moisture ContentThe moisture content of the final mixtures was measured following exposure to 105 °C for 10 min using a moisture analyzer HG63-P (Mettler Toledo, OH, U.S.A.) (n = 1). The weight of the samples was approximately 5 g.
Preparation of TabletsA single punch press (Korsch EK0; Korsch, Germany) was used to prepare flat face tablets of 8 mm diameter and 200 mg of mass at the following compression forces: 2.5, 5.0 7.5, 10.0, and 15.0 kN. The granules were obtained via free fall without an agitation feeder. The tableting process was carried out at a speed of 20 tab/min for 30 min, and a total of 600 tablets were produced.
Measurement of Tablet HardnessThe tablet breaking force and thickness were measured using a MultiTest 50 (SOTAX, Switzerland). In addition, the tensile strength was calculated by the following equation29):
where F is the tablet breaking force, D the tablet diameter, and T the tablet thickness.
Evaluation of Tableting BehaviorFlat face tablets 8 mm in diameter and 200 mg in mass were prepared using a Tabflex (Okada Seiko, Japan) at a compression force of approximately 90 MPa. Each final mixture was manually filled into the die and tableting was performed five times for each sample. During the tableting process, the force and displacement of the upper punch were recorded using a Tableting Pressure Data Acquisition System (DAATSU III, Okada Seiko, Japan). In addition, heckel analysis was performed on each sample using the following equation30):
where D is the relative density, K the slope of the linear part of the plot, P the compaction pressure, and A the Y intercept with the linear part of the plot. The yield pressure (Py) was calculated using the following equation:
Measurement of Tablet Disintegration TimeDisintegration of tablets was measured using a disintegration tester (NT-400, Toyama, Japan) at 30 cycles/min (n = 6) without disc. Distilled water was used as the test medium. The disintegration time was recorded individually as the time needed for all particles to completely pass through the mesh screen of the apparatus.
Calculation of Tablet PorosityThe tablet porosity (ε) was calculated by the following equation:
where ρapp and ρtrue are the apparent and true densities (g/mL), respectively. The ρapp was calculated by dividing the tablet mass by tablet volume. The ρtrue of the final mixtures was measured using a mercury penetration porosimeter (Amico, Japan) (n = 1).
Evaluation of Wettability of the TabletsWettability of the tablets was measured using a surface tensiometer (K100; Krüss GmbH, Germany) at 25 °C. First, a tablet was placed in a stainless-steel tube. After that, it was suspended into the probe and lowered into liquid. Then, the time and weight of the liquid that penetrated into the tablet were recorded. Water was used as the probe solvent. Wetting behavior is composed of initial wetting and capillary wetting. The initial wetting was calculated using the first five data points in linear regression except for the first point. The capillary wetting was calculated using linear regression at this condition. For calculation of initial wetting and capillary wetting, the equilibrium part (R2 ≥ 0.95) of the coefficient of mass2 and time was used.18)
Statistical AnalysisTwo-group comparisons were performed using Student’s t-test. p-Values of <0.05 or 0.01 were defined as statistically significant.
Results and Discussion
Comparison of GFBG with the DC ProcessIn the manufacturing process of GFBG, no problems such as reduced granule fluidization were observed. As shown in Figs. 1 and 2, GFBG and DC needed two manufacturing machines for preparing the final mixtures. In addition, Table 2 shows the measured process time for preparing the final mixtures of GFBG and DC in the 30% drug load formulation. GFBG took 17 min to prepare final mixtures, which was comparable to that of DC (16 min).
Table 2. Measured Process Time for Preparing Final Mixtures in the 30% Drug Load Formulation
| Process | Process time (min) |
|---|
| GFBG | DC |
|---|
| Sieving | — | 4 |
| Pre-mixing | 1 | — |
| Granulation | 8 | — |
| Absorption | 5 | |
| Mixing 1 | — | 5 |
| Mixing 2 | — | 5 |
| Blending | 1.5 | — |
| Final blending | 0.5 | 2 |
| Sieving | 1 | — |
| Total (min) | 17 | 16 |
In general, conventional FBG requires a longer processing time than other granulation methods because a uniform distribution of the binder to fluidize granules is needed, leading to longer processing time. It is difficult to reduce the FBG processing time by increasing the spray rate, because an excessively high spray rate might lead to the discontinuation of granule fluidization. On the contrary, by using a lower amount of added water for granulation, GFBG enables a reduced processing time as opposed to conventional FBG.22)
Furthermore, although DC has the advantage of requiring fewer manufacturing machines and a short processing time, it is necessary to use excipients that allow good flowability and compaction properties.3,31) In addition, an API co-sieving process is necessary because of the de-agglomeration of the API, resulting in the danger of exposure to irritating and/or toxic substances. Therefore, GFBG reduces the manufacturing disadvantages of FBG and DC.
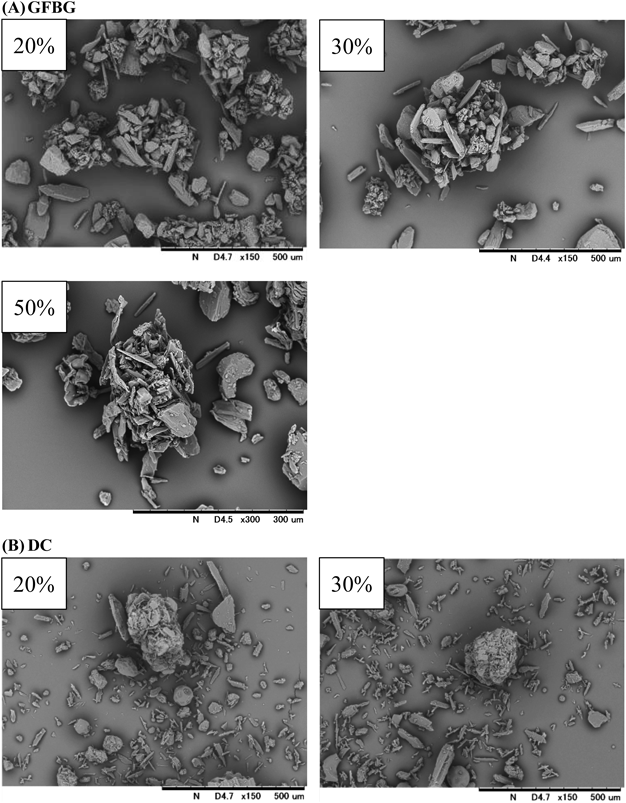
Properties of Final Mixtures Prepared with GFBG and DCExternal Structure of GranulesFigure 3 shows SEM images of final mixtures prepared with GFBG and DC, respectively. The external structure of granules prepared with GFBG were porous and irregular. It has already been reported that mechanical stress to granules in the GFBG process, similar to FBG, is lower than in other wet granulation technologies, leading to a loose and irregular structure of granules.22) In contrast, many fine particles were observed in the SEM images of DC compared to that of GFBG, except for agglomerated lactose.
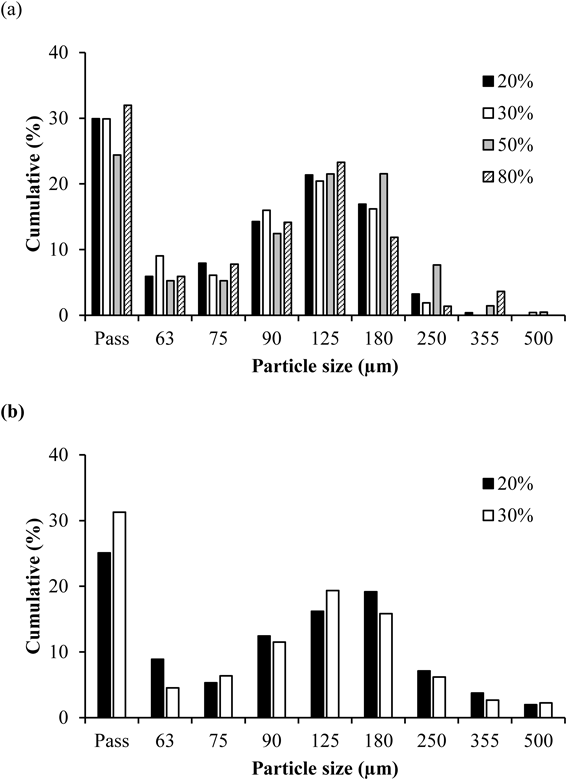
Physicochemical Properties of Granules Prepared with GFBG and DCFigures 4a and 4b show the particle size distribution, and Table 3 the physicochemical properties, of the final mixtures. Based on particle size distribution and calculation of relative width (Rw), it was suggested that GFBG produces granules with a narrow particle size distribution compared to DC. Additionally, in GFBG, increases in particle size and reduction of relative width of the formulation including 50% APAP were observed (Table 3) when comparing the 30% APAP. This was considered to result from the increasing amount of added water in the granulation process. It has been reported that the amount of added water has a significant impact on granule and tablet properties in GFBG.22) For this reason, increasing the amount of added water in the granulation process of GFBG might be one solution for preparing granules properly for a high drug load formulation.
Table 3. Physicochemical Properties of Final Mixtures Prepared with GFBG and DC
| Green fluidized bed granulation (GFBG) |
|---|
| Drug load | 20% | 30% | 50% | 80% |
|---|
| d50 (µm) | 105 | 101 | 132 | 101 |
| Rw | 1.93 | 1.94 | 1.69 | 1.99 |
| Bulk density (g/mL) | 0.42 | 0.43 | 0.38 | 0.39 |
| HR | 1.36 | 1.32 | 1.37 | 1.47 |
| Flow time (s/100 g) | 27 | 29 | 30 | # |
| Tablet mass variation (%) | 0.28 | 0.29 | 0.42 | 0.35 |
| Loss on drying (%) | 3.29 | 3.24 | 3.47 | 2.03 |
| Direct Compression (DC) |
|---|
| Drug load | 20% | 30% | | |
|---|
| d50 (µm) | 120 | 114 | | |
| Rw | 2.23 | 2.18 | | |
| Bulk density (g/mL) | 0.52 | 0.46 | | |
| HR | 1.37 | 1.54 | | |
| Flow time (s/100 g) | # | # | | |
| Tablet mass variation (%) | 0.60 | # | | |
| Loss on drying (%) | 1.76 | 1.72 | | |
The granules prepared by GFBG showed a comparable hausner ratio (HR) to that of DC; however, the flow time was 27 s for GFBG and could not be measured for DC because of poor flowability in the 20% drug load formulation. In GFBG, HR of granules prepared with 30 and 50% drug load formulation were 1.32 and 1.37, respectively, and flow times were 29 and 30, respectively, suggesting decrease of flowability. This might be attributed to the fact that granules containing 30% APAP had a bulk density of 0.43, while those including 50% APAP had a bulkier bulk density of 0.38. The reason bulk density decreased was due to the increase in the amount of added water during the granulation process from 3.5 to 4.5%. This was thought to be caused by the formation of bulkier particles due to the low mechanical force of GFBG, although the increase in the amount of water added promoted more particle agglomeration. In fact, this phenomenon occurred in the previous study where the bulk density decreased significantly after reaching a certain amount of water addition.22) However, the granules showing sufficient HR and flow time could be prepared with 30 and 50% drug loads because no problems such as variations in tablet weight (below 0.5%) were observed in the tableting process for all products prepared with GFBG, indicating that the granules prepared in this way have sufficient granule flowability (Table 3). In DC, conversely, even though the HR of the granules prepared with 20% drug load formulation was 1.37, a passable value, the HR of the 30% formulation increased significantly to 1.54, a very poor value. In addition, the tableting problem of insufficiently filled granules occurred for 30% of the drug load formulation in the tableting process owing to poor flowability. This resulted from increased static electricity with increasing drug load of organic compounds such as APAP, leading to inadequate flow and compaction properties.32–34) Though a large amount of excipients could be added to improve flowability and compaction properties, blending with fine API may lead to segregation problems.35,36) Therefore, changing the formulation to improve powder properties is not always the preferred method. For this reason, GFBG was considered a useful granulation method because it allowed the preparation of the final mixture with a processing time comparable to DC and is applicable to high drug load formulations.
GFBG showed similar Loss on Drying (LoD) at 20–50% of the drug, with a significant reduction in LoD at 80% of drug content (Table 3). This is thought to result from the low hygroscopicity of APAP, which prevents granules from retaining moisture. In addition, the HR was 1.47, and the flow time was not measurable because it was not possible to achieve sufficient granulation owing to the inability to hold water. This suggested that, when applying GFBG to high drug load formulations, it is necessary to consider the affinity of the drug with water, and if the drug has low hygroscopicity, it is necessary to consider other additives to retain water. However, we suggest that GFBG could be adapted to high drug load formulations by optimizing the formulation and process parameters.
Properties of Tablets Prepared with GFBG and DCCompaction Properties of Granules Prepared with GFBG and DCThe tensile strength of tablets prepared with GFBG and DC is shown in Fig. 5. The tablets prepared with the final mixture of DC at 20% drug content showed low tablet tensile strength (0.83 MPa) at a low compression force (5 kN). In addition, at 30% drug content, as described above, tableting could not be performed owing to blocking caused by poor flowability. On the other hand, the granules prepared with GFBG showed sufficient tablet tensile strength under low compression force at both 20 and 30% drug contents (20%: 1.58 MPa; 30%: 1.56 MPa), and as a result of checking the appearance of the tablets and the punch, no problems were observed in the tableting process. This is because previous studies have reported that GFBG tends to show high tablet tensile strength because it uses a fluidized bed granulator, leading to high compaction properties.21) Also, no sticking problem occurred in the tableting process since GFBG can eliminate free water inducing cohesiveness of particles, by inlet air flow.22) Interestingly enough, GFBG succeeded in preparing tablets with sufficient tablet hardness even at 50% drug content. This is because the external structure of the granules prepared with GFBG, including 50% drug contents were porous as were the granules prepared with 20 and 30% drug contents. This was a contributing factor to the improved compaction properties. The reason is that the more porous granules lengthen contact time influencing rearrangement, deformation, and/or fragmentation in a positive way, leading to higher compaction properties.37) On the other hand, the granules prepared with GFBG at 80% drug content did not produce tablets with sufficient tensile strength. Because APAP has low compaction properties and hygroscopicity, it was considered that the hardness decreased with increasing APAP content. To produce a tablet with sufficient hardness even in a high drug load formulation, it is necessary to set the optimal formulation and process parameters in the future.
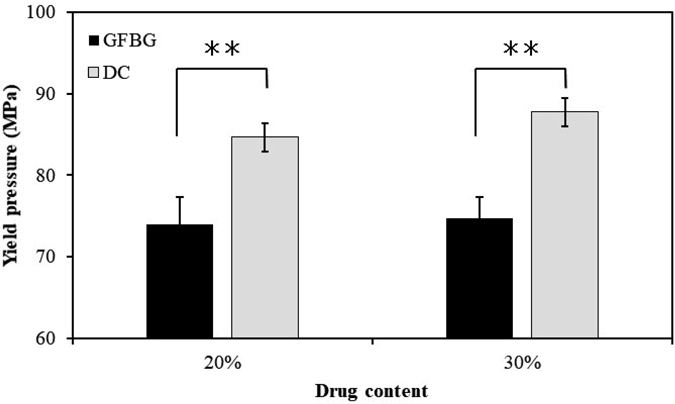
Tableting behavior was evaluated to reveal the reason for the difference in tablet tensile strength between GFBG and DC. Figure 6 shows the yield pressure of the granules prepared with GFBG and DC at 20 and 30% drug contents. GFBG showed a significantly lower yield pressure at both drug contents of 20 and 30%, indicating that the granules prepared with GFBG were more likely to plastically deform during the tableting process than those with DC. Generally, granules that are more easily plastically deformed show increased hardness. Therefore, it was found that GFBG has the potential to increase the compaction properties of granules by improving plastic deformability.
For this reason, the higher compaction properties of GFBG compared to DC may result from the low yield pressure of the prepared final mixtures. From the above results, we conclude that GFBG was able to produce tablets with a higher drug content than DC and had high compaction properties, although there was no significant difference in manufacturing time between the two methods.
Evaluation of the Disintegration of Tablets Prepared with GFBG and DCThe disintegration time of tablets prepared with GFBG and DC granules at 20% drug content is shown in Fig. 7, with GFBG yielding faster tablet disintegration compared to DC. It is known that disintegration of the tablet is affected by wettability and porosity.18,38) In order to elucidate the driving force of faster disintegration of tablet prepared with GFBG compared to that of DC, we evaluated tablet porosity and tablet wettability.
The porosities, initial and capillary wetting of the tablets prepared with GFBG and DC were shown in Table 4. Tablets showing tensile strength of approximately 2.7 MPa were used in these evaluations. Consequently, tablets prepared with GFBG had slightly larger porosity (0.134) than those prepared with DC (0.127) and no significant difference of initial wetting between GFBG and DC. In contrast, capillary wetting of the tablets prepared with GFBG was significantly higher (0.0021) than those of DC (0.0017). It was reported by Takasaki et al. that tablets manufactured with GFBG show high disintegration owing to fast water penetration into the tablet.21) Therefore, we suggest that the fast disintegration of GFBG tablets was caused by the high capillary wetting of the tablets prepared with GFBG.
Table 4. Tablet Porosity (
n = 1) and Wettability (
n = 3)
| Properties | GFBG | DC | Student’s t-test |
|---|
| Mean (S.D.) | Mean (S.D.) | p-Values |
|---|
| Tablet porosity (—) | 0.134 (—) | 0.127 (—) | — |
| Initial wetting (g2/s) | 0.0039 (0.0003) | 0.0039 (0.0002) | 0.8399 |
| Capillary wetting (g2/s) | 0.0021 (0.0002) | 0.0017 (0.0001) | 0.0390* |
Conclusion
We evaluated the manufacturability and properties of the granules and tablets prepared using GFBG and DC with APAP as a model drug. The number of machines that GFBG required to manufacture the final mixtures was the same as that of DC, and the time required for manufacturing was within 20 min for both.
Granules prepared with GFBG showed a narrower particle size distribution and higher flowability compared to those with DC. The granules prepared with DC could not be tableted owing to low flowability when the drug content was 30%, but the granules prepared with GFBG could be tableted with up to 80% drug content without any problems.
Tablets prepared with GFBG granules showed higher tensile strength than those prepared with DC granules. Although a tablet with sufficient hardness could not be prepared with a drug content of 80%, we believe it is possible to develop a product with high drug content using GFBG by optimizing formulation design and process parameters.
Tablets prepared with GFBG granules showed faster disintegration than those prepared with DC. According to the evaluation of the disintegration mechanism, it was found that the fast disintegration of GFBG was caused by the high capillary wetting of the tablets.
We conclude that GFBG can produce granules containing higher drug content than DC and show desired physicochemical properties at low cost.
Acknowledgments
We would like to thank Okada Seiko Co., Ltd. for helping us with the measurement of tableting behavior.
Conflict of Interest
The authors declare no conflict of interest.
References
- 1) Armstrong N. A., Pharm. Technol. Eur., 9, 24–30 (1997).
- 2) Rubinstein M. H., “Pharmaceutics: The Science of Dosage Form Design,” Churchill Livingstone, London, 1988, pp. 304–321.
- 3) Jivraj I. I., Martini L. G., Thomson C. M., Pharm. Sci. Technol. Today, 3, 58–63 (2000).
- 4) Jarvinen M. A., Paaso J., Paavola M., Leiviska K., Juuti M., Muzzio F., Jarvinen K., Drug Dev. Ind. Pharm., 39, 1802–1808 (2013).
- 5) Augsburger L. L., Zellhofer M. J., “Encyclopedia of Pharmaceutical Technology: Third Edition,” Informa Healthcare U.S.A., Inc., NY, 2006, pp. 3641–3652.
- 6) Garg N., Pandey P., Kaushik D., Dureja H., Int. J. Pharm. Investig., 5, 266–274 (2015).
- 7) Mangal S., Meiser F., Morton D., Larson I., Curr. Pharm. Des., 21, 5877–5889 (2015).
- 8) Moravkar K. K., Ali T. M., Pawar J. N., Amin P. D., Adv. Powder Technol., 28, 1270–1280 (2017).
- 9) Otsuka A., Yakugaku Zasshi, 118, 127–142 (1998).
- 10) Ullah I., Corrao R. G., Wiley G. J., Lipper R. A., Pharm. Tech., 11, 48–54 (1987).
- 11) Ullah I., Chang J. W. Y., Wiley G. J., Jain N. B., Kiang S., Pharm. Tech., 33, 62–70 (2009).
- 12) Ullah I., Wang J., Chang S. Y., Guo H., Kiang S., Jain N. B., Pharm. Tech., 33, 42–49 (2009).
- 13) Christensen L. H., Johansen H. E., Schaefer T., Drug Dev. Ind. Pharm., 20, 2195–2213 (1994).
- 14) Malamataris S., Goidas P., Dimitriou A., Int. J. Pharm., 68, 51–60 (1991).
- 15) Railkar A. M., Schwartz J. B., Drug Dev. Ind. Pharm., 26, 885–889 (2000).
- 16) Railkar A. M., Schwartz J. B., Drug Dev. Ind. Pharm., 27, 893–898 (2001).
- 17) Chen C.-M., Alli D., Igga M. R., Czeisler J. L., Drug Dev. Ind. Pharm., 16, 379–394 (1990).
- 18) Takasaki H., Yonemochi E., Messerschmid R., Ito M., Wada K., Terada K., Int. J. Pharm., 456, 58–64 (2013).
- 19) Takasaki H., Yonemochi E., Ito M., Wada K., Terada K., Powder Technol., 294, 113–118 (2016).
- 20) Gomez-Zepeda D., Taghi M., Scherrmann J.-M., Decleves X., Menet M.-C., Pharmaceutics, 12, 1–20 (2020).
- 21) Takasaki H., Sakurai A., Katayama T., Matsuura Y., Ohyagi N., Wada K., Ishikawa A., Yonemochi E., Int. J. Pharm., 557, 18–25 (2019).
- 22) Takasaki H., Sakurai A., Katayama T., Matsuura Y., Ohyagi N., Mizoguchi M., Takano J., Wada K., Matsui K., Nagato T., Ishikawa A., Yonemochi E., Int. J. Pharm., 570, 118647 (2019).
- 23) Nyström C., Mazur J., Sjögren J., Int. J. Pharm., 10, 209–218 (1982).
- 24) Humbert Droz P., Gurny R., Mordier D., Doelker E., Int. J. Pharm. Technol. Prod. Manuf., 4, 29–35 (1983).
- 25) Hüttenrauch R., Pharm. Ind., 45, 435–440 (1983).
- 26) Zuurman K., Riepma K. A., Bolhuis G. K., Vromans H., Lerk C. F., Int. J. Pharm., 102, 1–9 (1994).
- 27) Ghazi N., Liu Z., Bhatt C., Kiang S., Cuitino A., AAPS PharmSciTech, 20, 168 (2019).
- 28) Krycer I., Pope D. G., Hersey J. A., J. Pharm. Pharmacol., 34, 802–804 (1982).
- 29) Fell J. T., Newton J. M., J. Pharm. Sci., 59, 688–691 (1970).
- 30) Heckel R. W., Trans. Metall. Soc. AIME, 221, 1001–1008 (1961).
- 31) Chen L., He Z., Kunnath K. T., Fan S., Wei Y., Ding X., Zheng K., Dave R. N., Int. J. Pharm., 557, 354–365 (2019).
- 32) Han X., Ghoroi C., Dave R., Int. J. Pharm., 442, 74–85 (2013).
- 33) Huang Z., Scicolone J. V., Han X., Dave R. N., Int. J. Pharm., 478, 447–455 (2015).
- 34) Shimada Y., Sunada M., Mizuno M., Yonezawa Y., Sunada H., Yokosuka M., Kimura H., Takebayashi H., Drug Dev. Ind. Pharm., 26, 149–158 (2000).
- 35) Enstad G. G., “Segregation of powders-mechanisms, processes and counteraction,” Vol. 10, Elsevier Science, Amsterdam, 2001, pp. 589–602.
- 36) Huang Z., Xiong W., Kunnath K., Bhaumik S., Dave R. N., Eur. J. Pharm. Sci., 104, 344–355 (2017).
- 37) Šantl M., Ilić I., Vrečer F., Baumgartner S., Int. J. Pharm., 414, 131–139 (2011).
- 38) Fukami J., Ozawa A., Yoshihashi Y., Yonemochi E., Terada K., Chem. Pharm. Bull., 53, 1536–1539 (2005).