Abstract
Hospital preparations are frequently prepared in Japanese hospitals when ready-made formulations to meet patients’ needs are unavailable. Although the quality of hospital preparations have to be ensured for efficacy and safety, such quality evaluation tends to be insufficient mainly due to lack of manpower and experimental environments in hospitals. In this paper, we investigated the applicability of quantitative (q)NMR spectroscopy to the quality control of diclofenac gargles as examples of hospital preparations, as it has various merits for the quantitative analysis of mixtures in solutions. Diclofenac gargles are composed of diclofenac, tranexamic acid, and lidocaine, and are used for the pain relief of stomatitis induced by cancer chemotherapy. Aliquots of the gargles, which were prepared five times, were mixed with dimethylsulfone as an internal standard, followed by qNMR measurements. Water signal suppression was achieved using a pulse program, water suppression enhanced through T1 effects, because the pulse program was superior to other ones such as presaturation and one-dimensional nuclear Overhauser effect spectroscopy in terms of quantitativeness. Concentrations of the three medicinal ingredients were simultaneously determined based on the signals selected by considering the spectral separation and the quantitativeness. Consequently, the gargles were found to be prepared with constant quality, and were stable at room temperature for at least four weeks. qNMR is considered to be potentially useful for the quality control of various hospital preparations because of minimal sample pretreatments, lack of need of calibration curves, and its comprehensive detection abilities.
Introduction
Hospital preparations are special pharmaceuticals which are prepared by pharmacists according to doctors’ requests in hospitals when no ready-made formulations to meet patients’ needs exist.1,2) Although hospital preparations provide better medical care, their quality evaluation is not necessarily sufficient mainly due to lack of manpower and experimental environments necessary for the analyses of many and different formulations in hospitals. Although chromatographic techniques such as HPLC can be used for the quality evaluation, they involve considerable trial-and-error to establish analytical conditions, and often require some knowhow dependent on experience. In addition, chromatographic techniques naturally have some limitations for the simultaneous measurements of components with various physicochemical properties.
Quantitative (q)NMR spectroscopy is a primary ratio method for quantitation, which guarantees traceability based on the International System of Units,3,4) and is thus suitable for the certification (purity determination) of small organic molecules including pharmaceuticals.5–7) qNMR has recently been adopted for the purity determination of standard substances in the crude drugs tests of the Japanese Pharmacopoeia.5) Although the application of qNMR is also growing in the quantitation of organic components in mixtures such as crude drugs and foods,8–10) its application to drug formulations is still limited.11,12) qNMR seems to be highly suitable for the quality control of drug formulations because of the following advantages over other quantitation methods. 1) Almost all 1H nuclei of organic compounds can be detected with the same sensitivity. Thus, standard samples and calibration curves for analytes are unnecessary for quantitation. 2) Organic compounds, when dissolved, can be comprehensively detected irrespective of their chemical structures. 3) Samples can be analyzed with minimal or no pretreatments. 4) Structural information is abundantly obtained.
In this paper, the applicability of qNMR to the quality control of diclofenac gargles (DF gargles) as examples of hospital preparations was investigated. DF gargles are composed of diclofenac sodium (DF), tranexamic acid (TR), and lidocaine hydrochloride (XC) and used for the pain relief of stomatitis induced by cancer chemotherapy.
Results and Discussion
To the best of our knowledge, there has been no report on the application of qNMR to hospital preparations. DF gargles are made of formulations of DF, TR, and XC. DF has been used as a medicinal ingredient of gargles for the pain relief of oral mucositis induced by cancer chemo-radiotherapy.13) TR and XC are potentially useful for gargles because they have antifibrinolytic effects14) and local anesthetic effects,15,16) respectively. Thus, the addition of TR and XC to DF is considered to be more effective for the treatment of stomatitis. In practice, such combinations have been effectively used as hospital preparations in Ehime University Hospital in Japan. The physicochemical properties of DF, TR, and XC considerably differ from one another, as can be seen from the chemical structures shown in Fig. 1, and thus the simultaneous measurements of these drugs by chromatographic techniques such as HPLC can be difficult. In addition, other substances contained in their formulations as pharmaceutical additives possibly hinder their chromatographic analyses. The applicability of qNMR to the quality control of DF gargles is thus interesting as it has various analytical merits, which are not available in chromatographic techniques.
qNMR analysis is generally performed for samples dissolved in deuterated solvents. However, qNMR with water signal suppression is required because real samples are often aqueous mixtures as in DF gargles. Thus, the validity of three pulse programs generally used for water signal suppression, i.e., presaturation,17,18) one-dimensional nuclear Overhauser effect spectroscopy (1D-NOESY),18–20) and water suppression through enhanced T1 effects (WET),17,18,21) was examined for the qNMR analysis of aqueous solutions of DF, TR, and XC, especially with regard to the quantitativeness. Dimethyl sulfone (DMS), a water-soluble certificated substance for qNMR, was used as an internal standard for quantitation since the chemical shift was expected to be relatively close to the offset frequency (4.3 or 4.7 ppm), which is desirable in terms of quantitativeness. When the spin-lattice relaxation time (T1) values of the 1H nuclei of DF, TR, XC, and DMS were measured, the methyl protons of DMS always had the longest T1 (5.6–5.9 s) of any of the samples. Thus, the qNMR spectra were obtained with recycle times being set at 39–41 s (delay time: 35–37 s), which were seven-fold over the T1 values of DMS. Figure 2 illustrates the qNMR spectra of DF, TR and XC using the WET pulse program. The 1H signals were broadly integrated, so long as the neighboring signals showed no interference.
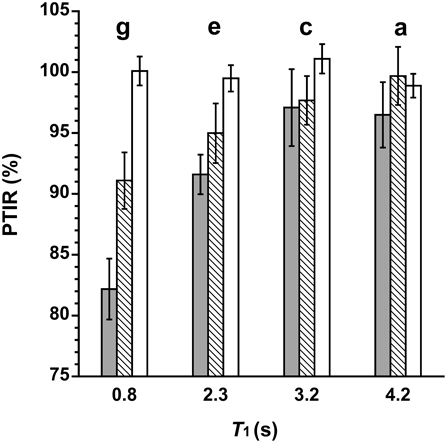
The integral ratios between the individual drug signals and DMS signal were measured in the three kinds of water suppression program, and their percentages to the theoretical integral ratios (PTIRs) were calculated for the evaluation of the quantitativeness. The results of DF are illustrated in Fig. 3. 1D-NOESY, which is generally used in metabonomics,20) and presaturation showed lower PTIRs for the nuclei with relatively short T1, and the PTIRs tended to decrease as the T1 got shorter. In contrast, the PTIRs in the WET pulse program were virtually 100% irrespective of the T1 values. Similar results were also obtained for TR and XC.
In presaturation, the water signal is suppressed by the selective saturation of water protons using a long and weak pulse focused to the frequency of water protons. Presaturation is simple to use for water signal suppression, which is incorporated into many pulse sequences including 1D-NOESY. However, the signals located near the water signal (δ 4.7) may be partially suppressed by presaturation.17) As shown in Fig. 3, the PTIR of the signal due to proton g of DF (at δ 3.68) was the lowest of all of the DF signals in terms of both presaturation and 1D-NOESY. The reason for this may be due to the signal being the nearest to the water signal. Additionally, the water signal suppression by 1D-NOESY is based on the differences of T1 between the water and analyte protons, and thus there is a possibility that the proton signals with a small T1 difference were partially suppressed.20) The PTIR of the signal due to proton g decreased more in 1D-NOESY compared with presaturation. The probable reason for this is that the T1 of proton g was the shortest of all and closest to that of the water protons. On the other hand, WET is not based on presaturation and T1 differences, and the water signal is suppressed using more selective radiation to the water signal followed by gradient dephasing, which is considered to be the reason of the good quantitativeness.
Table 1 summarizes the PTIRs in the WET pulse program. The PTIRs were nearly 100%. The PTIRs showed some acceptable errors, probably due to spectral noise, phase adjustment, baseline correction, pipetting, and also the integral regions. The results in Table 1 mean that almost all 1H nuclei of the drugs and DMS could be quantitatively detected by the WET pulse program.
Table 1. Accuracy and Precision of qNMR Using the WET Pulse Program
a)| PTIRb) |
|---|
| DF |
| a (δ 7.52) | b (δ 7.18), d (7.14) | e (δ 6.99) | c (δ 6.51) | g (δ 3.68) | |
| d, 2H | each t, 1H | t, 1H | d, 1H | s, 2H | |
| 98.9 ± 0.98 | 100.0 ± 1.03 | 99.5 ± 1.08 | 101.1 ± 1.21 | 100.1 ± 1.19 | |
| TR |
| a (δ 2.87) | e (δ 2.12) | d + f (equatorial, δ 1.94) | b (δ 1.65) | d + f (axial, δ 1.37) | c + g (axial, δ 1.06) |
| c + g (equatorial, δ 1.84) |
| d, 2H | tt, 1H | each br d, 2H | m, 1H | dq, 2H | dq, 2H |
| 100.2 ± 0.89 | 99.1 ± 0.63 | 99.1 ± 0.71 | 99.4 ± 0.86 | 98.5 ± 0.69 | 97.8 ± 0.75 |
| XCc) |
| a + b (7.2–7.3 ppm) | d (δ 4.31)d) | e (δ 3.37) | c (δ 2.21) | f (δ 1.38) | |
| 3Η | br s, 2H | q, 4H | s, 6H | t, 6H | |
| 99.1 ± 0.50 | 97.8 ± 0.87 | 100.3 ± 0.58 | 100.1 ± 0.43 | 99.0 ± 0.44 | |
| (—) | (95.9 ± 0.83) | (98.0 ± 0.54) | (98.1 ± 0.45) | (97.0 ± 0.37) | |
a) Five aliquots (800 µL) from the same solution of each drug were analyzed and the signals were integrated with the same integral regions. Some signals were occasionally integrated together when their spectral resolution was insufficient for the accurate integration. The alphabetical characters a–g indicate the positions in the chemical structures shown in Fig. 1. The italic alphabetical characters indicate the signal shapes: s, singlet; d, doublet; t, triplet; q, quartet; tt, triple triplet; dq, double quartet; br, broad. b) PTIR means the percentage of the integral ratios between drug signals and DMS signal to their theoretical integral ratios. The values are shown as mean ± standard deviation. c) The values in the parentheses do not include the cis isomer signals. d) The signal was so close to the residual water signal that the intensity and reproducibility were considered to be largely influenced by the distortion of the baseline and the spectral phase.
It is generally known that N-monosubstituted amides such as lidocaine occur as the trans isomer or a mixture of the major trans and the minor cis isomer, because of the partial double-bond character of the amide bond. In fact, minute 1H-NMR signals (e.g., δ 2.28 in Fig. 2) were observed next to the individual signals assigned to XC, and those integral intensity ratios and coupling patterns were consistent with the strucuture of lidocaine (see supplementary materials). The 13C-NMR and two-deminsional NMR spectra were also consistent with the existence of the isomer (data are not shown). Thus, the minute signals were regarded as the cis isomer, and included in the integral regions. When the minute signals were excluded from the integral regions, the PTIRs were approximately 2% lower, as shown in Table 1. The existence of such an isomer will be a critical problem when qNMR is used for the purity determination of compounds having amide bonds.
qNMR with the WET pulse program (qNMRWET) was applied to the quality evaluation of DF gargles based on the above experimental results. DF gargles with or without XC viscous were prepared, and they were named DF gargle[+XC] and DF gargle[−XC], respectively. The T1 values of DMS in the DF gargle[+XC] and DF gargle[−XC] were 5.7 ± 0.04 and 5.8 ± 0.15 s, respectively, and longer than other nuclei. Thus, the DF gargles were analyzed by qNMR with the recycle time being set at 45 s (delay time: 41 s), which is more than seven times the T1 values of DMS. Figure 4 shows an example of the qNMRWET spectra of DF gargle[+XC]. Almost all signals due to the three medicinal ingredients were assigned, based on the 1H-NMR spectral data of DF tablet, TR powder and XC viscous, and their medicinal ingredients dissolved in aqueous solution of NaHCO3. Correlation NMR spectroscopy was also used for the assignments of TR signals. The signal due to DMS as an internal standard was observed at 3.15, and sufficiently separated from the other signals.
From the spectral resolution in Fig. 4 and the PTIR in Table 1, the signals at δ7.52 (doublet, position a, 2H), δ 1.37 (double quartet, axial protons of positions d and f, 2H) and δ 2.20 (singlet, position c, 6H) were considered to be suitable as the signals for the quantitation of DF, TR and XC, respectively. When five aliquots from one bottle of the DF gargle[+XC] or DF gargle[−XC] were analyzed by qNMRWET using these signals, the concentrations of the three medicinal ingredients were obtained with good reproducibility as shown in Table 2, which was considered to be sufficient for the quality evaluation of the DF gargles. Subsequently, the DF gargle[+XC] and DF gargle[−XC] were prepared five times each, and the concentrations of the three medicinal ingredients were measured by qNMRWET. Consequently, the quantitation results were highly reproducible as shown in Table 3, and thus the DF gargles were found to be prepared with a constant quality. The ratios of the quantitation values to the theoretical ones, which can be seen from the addition amounts of DF tablets, TR powder, and XC viscous, were approximately 100%. These results indicate the substantially complete dissolution of the medicinal ingredients in the suspended gargles. The concentrations of XC were 3.0 mM, irrespective of the poor water solubility (1.75 mM at 30 °C) of the unionized species (pKa of the ionized species: 7.9), which predominates in water at the pH (8.3–8.6) of the DF gargle[+XC]. Some unknown interactions of XC with other components in the gargle are probably responsible for the complete dissolution. Although DF tablets, TR powder, and XC viscous contain various pharmaceutical additives, the insoluble or poorly soluble additives such as talc, titanium oxide, magnesium stearate, light anhydrous silicic acid, and crystalline cellulose, ferric oxide, and yellow ferric oxide were substantially eliminated by centrifugation, and the NMR measurements were shown to be unaffected by these additives.
Table 2. Reproducibility of qNMR
WET Measurements of the Medicinal Ingredients Contained in the DF Gargles
a) | Concentrations (mg/mL) |
|---|
| DF gargle[+XC] | DF gargle[−XC] |
|---|
| DF | 0.246 ± 0.003 (1.31) | 0.238 ± 0.001 (0.56) |
| TR | 2.536 ± 0.019 (0.77) | 2.507 ± 0.012 (0.48) |
| XCb) | 0.813 ± 0.008 (0.94) | − |
a) Five aliquots from one bottle of the DF gargle[+XC] or DF gargle[−XC] were analyzed by qNMRWET. The values are shown as mean ± standard deviation (relative standard deviation, %). b) The minor cis isomer signal (δ 2.27) was included in the integral region.
Table 3. Concentrations of the Medicinal Ingredients Contained in the DF Gargles
a) | Concentrations (mg/mL) |
|---|
| DF gargle[+XC] | DF gargle[−XC] |
|---|
| 0 week | 4 week | 0 week | 4 week |
|---|
| DF | 0.246 ± 0.003 | 0.248 ± 0.005 | 0.243 ± 0.003 | 0.242 ± 0.003 |
| (98.6 ± 1.31) | (99.3 ± 2.02) | (97.2 ± 1.36) | (96.9 ± 1.26) |
| TR | 2.523 ± 0.018 | 2.539 ± 0.048 | 2.532 ± 0.022 | 2.508 ± 0.021 |
| (100.9 ± 0.72) | (101.6 ± 1.93) | (101.3 ± 0.88) | (100.6 ± 0.83) |
| XCb) | 0.814 ± 0.003 | 0.813 ± 0.016 | — | — |
| (101.7 ± 0.39) | (101.6 ± 2.01) |
a) Each gargle was prepared five times and measured by qNMRWET. The values are shown as mean ± standard deviation. The values in the parentheses indicate the percentages of the observed concentrations to the theoretical ones. b) The minor cis isomer signal (δ 2.27) was included in the integral region.
The DF gargles were analyzed by qNMRWET four weeks after their preparation in order to evaluate stability. Consequently, the NMR spectral patterns were virtually unchanged compared with those obtained immediately after preparation, although the signals due to the ethyl moiety of XC slightly shifted to the upper field. As shown in Table 3, alterations in the concentrations of DF, TR, and XC were not observed. Thus, the DF gargles were found to be stable at room temperature for at least four weeks after preparation.
Conclusion
qNMR with water signal suppression by the WET pulse program was demonstrated to be useful for the quality control of DF gargles. The concentrations of the medicinal ingredients in aqueous mixtures were found to be accurately and precisely determined using an internal standard with minimal sample pretreatments. qNMRWET could be widely applied to the quality control of hospital preparations containing organic medicinal ingredients.
Experimental
Chemicals and ReagentsDeuterium oxide (99.96 atom%D) was purchased from Merck (Tokyo, Japan). Deuterium oxide (99.9 atom%D) containing 0.05% 3-(trimethylsilyl)-propionic-2,2,3,3-d4 acid sodium salt (TSP), XC monohydrate (purity: 99.9%), and DMS (certificated value 99.73%) which is a standard substance for qNMR were purchased from Sigma-Aldrich (Tokyo, Japan). DF (purity: 100.0%), TR (purity: 100.2%), and distilled water for HPLC were purchased from Wako (Osaka, Japan). DICLOFENAC SODIUM TABLETS 25 mg “TOWA” (DF tablets, 25 mg of DF in one tablet), TRANSAMIN® POWDER 50% (TR powder, 1.25 g of TR in one packet containing 2.5 g of powder), Xylocaine Viscous 2% (XC viscous, 20 mg of XC in 1 mL), and Sodium Bicarbonate (NaHCO3, 2.5 g of NaHCO3 in one packet) were obtained from TOWA PHARMACEUTICAL CO., LTD. (Osaka, Japan), Daiichi-Sankyo, Inc. (Tokyo, Japan), and Aspen Japan K.K. (Tokyo, Japan), and Milan Inc. (Tokyo, Japan), respectively.
NMR Spectroscopy1H-NMR spectra of standard solutions of the medicinal ingredients and diclofenac gargles in 5-mm o.d. NMR tubes were measured on a Bruker Avance500 spectrometer (11.75 T) at a probe temperature of 300 K without spinning of the NMR tubes, under the qNMR conditions. The qNMR measurements were performed with the water resonance being suppressed by using standard Bruker pulse programs for presaturation, 1D-NOESY and WET under the 13C decoupling conditions (mpf9). The common acquisition parameters were 65536 data points, a spectral width of 8152 Hz, a 90° flip angle for data acquisition, an acquisition time of 4.02 s, and two dummy scans. The free induction decays were Fourier transformed after application of a line-broadening of 0.30 Hz, and the spectra were referenced to a chemical shift of TSP at 0.0. The recycle times between pulses (acquisition time plus delay time) were seven or more times longer than the longest T1 of all T1 values of 1H nuclei observed in each sample, in order to ensure the full spin–lattice relaxation of all nuclei in qNMR measurements.
A low power pulse (50 Hz) at the frequency of water resonance was irradiated during the recycle delay time (35–41 s) in presaturation. In 1D-NOESY, such a pulse was irradiated during the mixing time (100 ms) as well as the recycle delay time. The offset frequency was set to the water signal resonance in both the presaturation and 1D-NOESY. In WET, four selective shaped pulses (20 ms sinc pulses) at the water frequency were successively irradiated, with a pulsed field gradient (1 ms) being applied after each shaped pulse. The offset frequency was set to 4.3 ppm in WET. The flip angles of shaped pulses were, in the order of radiation: 81.3, 101.4, 69.3, and 160.9°, respectively, and each subsequent gradient amplitude was half the one of the preceding member.21) The T1 values were measured three times for each sample by an inversion recovery method with the water resonance being suppressed. The spectra were manually phased, baseline corrected, and integrated.
Analysis of Standard Solutions of DF, TR and XCAqueous solutions of DF (0.508 mg/mL), TR (5.07 mg/mL), and XC monohydrate (1.73 mg/mL) were prepared, whose concentrations were supposed to be two times those in the DF gargles. The solution (800 µL), DMS D2O solution (1.802 mg/mL, 200 µL), and D2O containing TSP (100 µL) were placed in a 1.5 mL Eppendorf tube. The mixture was vortexed, and the solution (0.65 mL) was transferred to an NMR tube. T1 values were measured, followed by qNMR measurements with three kinds of programs for water signal suppression. The free induction decays were accumulated 48 times, and the accumulation time was 31–33 min. The signal-to-noise (SN) ratios of the 1H signals were supposed to be similar to those of the DF gargles.
The integral intensity ratios of the individual signals due to drugs to the DMS signal were obtained from the experiments, and compared with the theoretical integral ratios. The theoretical integral ratios were calculated according to the following equation, based on the assumption that the individual signals were quantitatively detected by the NMR measurements, and the purities presented by the reagent manufacturers were exact.
The alphabetical characters A, P, M, and H indicate amount, purity (%), molecular weight, and number of proton contributing to each signal, respectively. The words, sample and DMS, indicate the drug and the internal standard, respectively.
Preparation of DF Gargles and qNMR AnalysisFive DF tablets cut in two were placed in a 500-mL plastic shading bottle with 200–300 mL of distilled water, and shaken for one minute. To the suspension were added one packet of TR powder and NaHCO3 for DF gargle[−XC], or these formulations and XC viscous (20 mL) for DF gargle[+XC], and the mixtures were shaken for two minutes. The suspensions were filled up with distilled water to 500 mL using the scale of the bottle, followed by further mixing with inversion. DF gargle[+XC] and DF gargle[−XC] were prepared five times each. The analysis was performed once each immediately after preparation and after being left at room temperature for four weeks.
DF gargles were shaken again for two minutes immediately before sampling, and the resulting suspension (800 µL) was mixed with a DMS D2O solution (1.802 mg/mL, 200 µL), and D2O containing TSP (100 µL) in a 1.5 mL Eppendorf tube. The mixture was vortexed, centrifuged (2400 × g, for 15 min), and the supernatant (0.65 mL) was transferred to an NMR tube, followed by qNMR analysis with an accumulation time of 200 scans using the WET pulse program.
Acknowledgment
The authors wish to express appreciation to Dr. Kiriko Hirano of Bruker Japan (Kanagawa, Japan) for her invaluable assistance with the NMR measurements.
Conflict of Interest
The authors declare no conflict of interest.
Supplementary Materials
The online version of this article contains supplementary materials.
References
- 1) Watanabe K., Goto N., Nakamura T., Masada M., Biol. Pharm. Bull., 36, 719–722 (2013).
- 2) Hendrickx S., Veron A. M., van Schepdael A., Adams E., Eur. J. Pharm. Sci., 86, 13–19 (2016).
- 3) Giraudeau P., Magn. Reson. Chem., 55, 61–69 (2017).
- 4) Weber M., Hellriegel C., Rueck A., Wuethrich J., Jenks P., J. Pharm. Biomed. Anal., 93, 102–110 (2014).
- 5) Uchiyama N., Hosoe J., Sugimoto N., et al., Chem. Pharm. Bull., 69, 118–123 (2021).
- 6) Pauli G. F., Chen S.-N., Simmler C., Lankin D. C., Godecke T., Jaki B. U., Friesen J. B., McAlpine J. B., Napolitano J. G., J. Med. Chem., 57, 9220–9231 (2014).
- 7) Rundlof T., McEwen I., Johansson M., Avidsson T., J. Pharm. Biomed. Anal., 93, 111–117 (2014).
- 8) Simmler C., Napolitano J. G., McAlpine J. B., Chen S.-N., Pauli G. F., Curr. Opin. Biotechnol., 25, 51–59 (2014).
- 9) Duangdee N., Chamboonchu N., Kongkiatpaiboon S., Prateeptongkum S., Phytochem. Anal., 30, 617–622 (2019).
- 10) Tanaka R., Inagaki R., Sugimoto N., Akiyama H., Nagatsu A., J. Nat. Med., 71, 315–320 (2017).
- 11) Rundlof T., Mathiasson M., Bekiroglu S., Hakkarainen B., Bowden T., Arvidsson T., J. Pharm. Biomed. Anal., 52, 645–651 (2010).
- 12) Sun S., Jin M., Zhou X., Ni J., Jin X., Liu H., Wang Y., Molecules, 22, 1517 (2017).
- 13) Brennan P. A., Lewthwaite R., Sakthithasan P., McGuigan S., Donnelly O., Alam P., Gomez R. S., Fedele S., J. Oral Pathol. Med., 49, 956–959 (2020).
- 14) Carter G., Goss A., Int. J. Oral Maxillofac. Surg., 32, 504–507 (2003).
- 15) Lee H.-S., J. Dent. Anesth. Pain Med., 16, 237–244 (2016).
- 16) Silva F. C., Marto J. M., Salgado A., Machado P., Silva A. N., Almeida A. J., Pharm. Dev. Technol., 22, 266–274 (2017).
- 17) Barding G. A. Jr., Salditos R., Larive C. K., Anal. Bioanal. Chem., 404, 1165–1179 (2012).
- 18) Giraudeau P., Silvestre V., Akoka S., Metabolomics, 11, 1041–1055 (2015).
- 19) Nicholson J. K., Foxall P. J. D., Spraul M., Farrant R. D., Lindon J. C., Anal. Chem., 67, 793–811 (1995).
- 20) McKay R. T., Concepts Magn. Reson. Part A, 38A, 197–220 (2011).
- 21) Smallcombe S. H., Patt S. L., Keifer P. A., J. Magn. Reson. A, 117, 295–303 (1995).