Abstract
Citrus-type crude drugs (CCDs) are commonly used to formulate decoctions in Kampo formula (traditional Japanese medicine). Our previous study reported metabolomic analyses for differentiation of the methanol extracts of Citrus-type crude drugs (CCDs) using ultra-HPLC (UHPLC)/MS, and 13C- and 1H-NMR. The present study expanded the scope of its application by analyzing four CCD water extracts (Kijitsu, Tohi, Chimpi, and Kippi); these CCDs are usually used as decoction ingredients in the Kampo formula. A principal component analysis score plot of processed UPLC/MS and NMR analysis data indicated that the CCD water extracts could be classified into three groups. The loading plots showed that naringin and neohesperidin were the distinguishing components. Three primary metabolites, α-glucose, β-glucose, and sucrose were identified as distinguishing compounds by NMR spectroscopy. During the preparation of CCD dry extracts, some compounds volatilized or decomposed. Consequently, fewer compounds were detected than in our previous studies using methanol extract. However, these results suggested that the combined NMR- and LC/MS-based metabolomics can discriminate crude drugs in dried water extracts of CCDs.
Introduction
In Japan, crude drugs are obtained from medicinal parts of plants or animals, cells, secretions, extracts, and minerals.1,2) Numerous factors can affect the quality of these crude drugs including their botanical origin, geographical divergence, growth conditions, and processing method. The stable provision of crude drugs with reproducible medicinal value is the first step towards establishing the global acceptance and use of traditional Japanese medicines. The methods used to assure the quality of crude drugs include 1) morphological methods, 2) chemical methods, and 3) genotype confirmation. The chemical method involves qualitative and quantitative analyses of index components. Metabolomics has gained importance in recent years as a strategy for quality evaluation and control of crude drugs and the predictable reliability, quality, and efficacy of herbal medicines. Metabolomics is also useful for the classification and identification of natural products containing various organic compounds.3) Metabolomic studies employ various analytical methods such as LC/MS,4) GC/MS,5) and NMR.6) Although LC/MS and GC/MS-based metabolomics are considered superior due to sensitivity and resolution, identification of marker compounds is difficult because of the structural diversity of secondary metabolites of crude drugs. In contrast, NMR-based metabolomics enables the determination or estimation of the structure of marker compounds directly from their chemical shifts and coupling patterns. Thus, it is recommended that all organic compounds with hydrogen or carbon atoms that are difficult to analyze using LC/MS and GC/MS should be characterized by NMR-based metabolomic studies.
In our previous studies, we reported the metabolomic analyses of the methanol extracts of five Citrus-type crude drugs (CCDs) using 13C- and 1H-NMR.7) We found that 13C-NMR-based metabolomics could be an effective method for the differentiation of the five CCDs. We also compared the results from the metabolomic analysis done using LC/MS and 13C-NMR techniques, illustrating differences between these analytical methods8); the study suggested that 13C-NMR metabolomics could be used for quality control of crude drugs by cross-discrimination.7) Since there have been no reports on 13C-NMR metabolomics using processed crude drugs, we considered expanding the application of this method to the discrimination studies of processed crude drugs. In the present study, a metabolomic study on the differentiation of the dried boiling water extracts of citrus-type crude drugs (CCDs water extracts) was conducted to evaluate their quality. We performed ultra-HPLC (UHPLC)/MS and 13C- and 1H-NMR analyses of CCD water extracts because these are usually used as the ingredient of decoction in the Kampo formula. In Japan, six types of CCDs derived from the dried peels or fruits of Citrus plants are regulated by the Japanese Pharmacopoeia (JP)1) and the Japanese Standards for Non-pharmacopoeial Crude Drugs (non-JP crude drug standards).2) Their attributes are summarized in Supplementary Materials (Table S1). Herein, we investigated the discrimination of CCD water extracts using four of the six CCDs that are widely used in various applications.
Results and Discussions
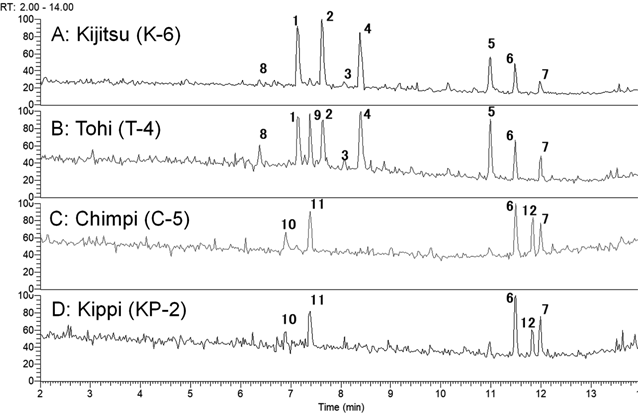
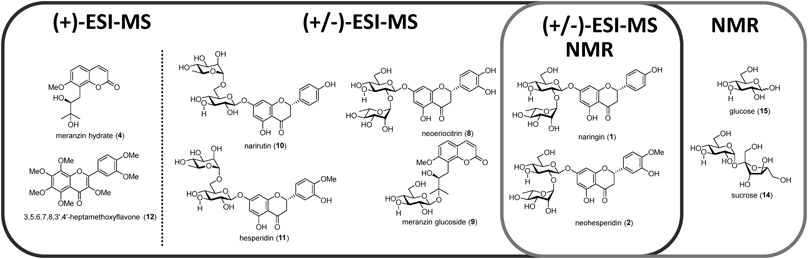
Overview of UHPLC/MSA total of 33 CCD water extracts were analyzed in the present study (Table S2, Supplementary Materials). Initially, 13 compounds were detected using UHPLC/MS analysis and identified by direct comparison with standards or assignments of their high-resolution MS and tandem MS (MS/MS) spectra (Fig. 1). The (+)-UHPLC/MS chromatograms of four types of CCD water extracts are presented in Figs. 2A–D. In the chromatogram of Kijitsu (Fig. 2A), characteristic flavanone neohesperidosides such as naringin (1),9) neohesperidin (2),10) and melitizine (3)11); coumarin derivatives meranzin hydrate (4),12) meranzin (5),13) polymethoxyflavones nobiletin (6),14) and tangeretin (7)15) were observed. In the chromatogram of Tohi (Fig. 2B), two additional compounds to those in Kijitsu were detected, namely neoeriocirin (8)16) and meranzin glucoside (9).17) Flavanone rutinosides, narirutin (10)18) and hesperidin (11),18) and one polymethoxyflavone-3,5,6,7,8,3′,4′-heptamethoxyflavone (12)19) were detected in the chromatograms of Chimpi (Fig. 2C) and Kippi (type 2, Fig. 2D).
(−)-UHPLC/MS chromatograms of four types of CCD water extracts are presented in Figs. S1a–d. In the (−)-UHPLC/MS chromatograms of Kijitsu and Tohi, 1, 2, 3, and 8 were detected (Figs. S1a–b). An acylated flavanone glycoside brutieridin (13)11) was detected in (−)-UHPLC/MS chromatograms of Kijitsu and Tohi (Figs. S1a–b).
Overview of 13C- and 1H-NMRThe evaluation of the constituents of each CCD water extract using the 13C- and 1H-NMR spectra was carried out and the signals of their characteristic constituents were assigned. The structures of the five compounds identified in the NMR analysis are presented in Fig. 1.
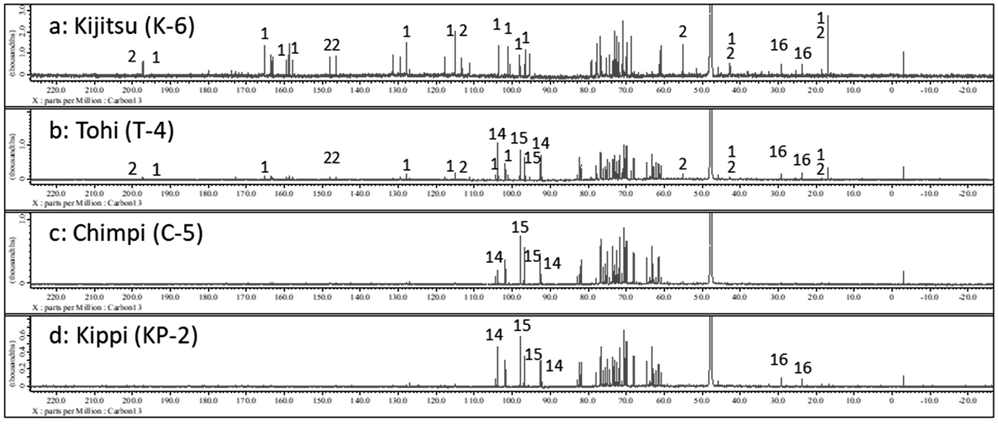
The 13C-NMR spectra of the CCD water extracts are presented in Figs. 3a–3d. In the range of 110–210 ppm (aromatic region), flavanone compounds were found in Kijitsu and Tohi (Figs. 3a and 3b). Specifically, aromatic carbon signals from the flavanone skeleton corresponding to naringenin (an aglycon of 1 (118 and 130 ppm)) and hesperetin (an aglycon of 2 (115, 120, and 150 ppm)) were observed in the spectra of Kijitsu (around 165 and 200 ppm, Fig. 3a).
In the range of 55–110 ppm (heteroatom-connected region), carbohydrate compounds were found in Tohi, Chimpi, and Kippi (Figs. 3b–3d). In contrast, the carbon signals of a glycoside neohesperidose (101 and 106 ppm) (a disaccharide included in 1 and 2) were observed in the spectra of Kijitsu (Fig. 3a) and Tohi (Fig. 3b). For Tohi, Chimpi, and Kippi (2) prepared from matured peels, the carbon signals of sucrose (14) (107 ppm) and glucose (15) (95 and 100 ppm) were confirmed (Figs. 3b–3d). Compound 14 was abundant in Tohi (Fig. 3b) while 15 (95 and 100 ppm) was abundant in the spectra of Chimpi (Fig. 3c) and Kippi (type 2, Fig. 3d).
In the aliphatic region, a flavanone skeleton (corresponding to the naringenin skeleton, 45 ppm, C-3) was observed. The methyl group at the 6th position of rhamnose (20 ppm) included in 1 and 2 was detected in the spectra of Kijitsu (Fig. 3a). In the spectra of Tohi (Fig. 3b) and Kippi (type 2, Fig. 3d), the aliphatic carbon signals of proline (16) were detected (26 and 32 ppm).
The full range 1H-NMR spectra of the four types of CCD water extracts are presented in Figs. S2a–d; compounds 1, 2, 14, and 15 were identified (Fig. 1). There were fewer compounds detected using water extract compared with our previous studies using MeOH extract.7,8) This could be attributed to the volatilization or decomposition of some of the compounds during the preparation of the CCDs dry extracts.
Principal Component Analysis (PCA) of UHPLC/MSDifferences in the component content of CCD extracts were also reflected in the PCA plots using (+)-UHPLC/MS data (Fig. 4a, the corresponding sample number of Kijitsu and Tohi were presented in Supplementary Materials Fig. S3a). When the sample clusters were in the two-dimensional space of two vectors, principal component 1 (PC1, 50%) and PC2 (21%), the CCDs were classified into three groups with high statistical values of Rx2 (0.973) and Q2 (0.945, Fig. 4): (A) Kijitsu, (B) Tohi, and (C) Chimpi and Kippi (type 2). The PCA plot positioned group (A) Kijitsu and (B) Tohi in the positive direction (in the first PC [PC1]) to the X-axis, and (C) Chimpi and Kippi (type 2) in the negative direction. (A) Kijitsu and (B) Tohi (CCDs in the positive direction) are commonly prepared from sources such as Citrus aurantium and C. natsudaidai, while the two negatively-positioned crude drugs ((C) Chimpi and Kippi (type 2)) are derived from C. unshiu or C. reticulata. This suggested that it was possible to evaluate the species of the botanical source of CCDs in the PC1 even if the crude drug dry extracts were used as analytes, although our previous study suggested the possibility of CCD differentiation based on their botanical origin.8) The Kijitsu group (A) was segregated into two subclusters, possibly due to the differentiation between the two-botanical origin of Kijitsu, C. aurantium and C. natsudaidai. In the loading plot (Supplementary Materials Fig. S4a), the flavanone neohesperidosides 1 and 2 and coumarin derivatives 4 and 9 contributed negatively to PC1, corresponding to (A) Kijitsu and (B) Tohi (Fig. 4a). In contrast, the flavanone rutinosides 10 and 11 showed a negative contribution to the PC1, corresponding to (C) Chimpi and Kippi (type 2). Furthermore, 1, 2, and 10, 11, and 12 showed a positive contribution to the PC2 that corresponded to (A) Kijitsu (Fig. 4a). Also, 4 and 9 showed a negative contribution equivalent to (B) Tohi (Fig. 4a). The contributors assigned from the loading plot are illustrated in Fig. 6. Thus, discrimination of the powdered extracts of CCDs was based on their botanical origin through the observation of differences in the sugar chains of the flavanone glycosides in the PC1.
The PCA plot of the (−)-UHPLC/MS (Rx2 (0.981) and Q2 (0.954)) showed differences in the constituents of the above-mentioned botanical sources (Fig. 4b, the corresponding sample number of Kijitsu and Tohi were presented in Supplementary Materials Fig. S3b). It is likely that differentiation according to the botanical origin took place as well as in the case of (+)-UHPLC/MS. The loading plot (Supplementary Materials Fig. S4b) differentiated compounds based on the original plant species, similarly to (+)-UHPLC/MS. Compounds 3 and 8 were observed as contributors of (B) Tohi. The UHPLC/MS conditions used in this study also provided information on secondary metabolites. The flavanone glycosides in the Citrus species contained sugar chains according to the plant species. Therefore, the results of differentiation using secondary metabolites also reflected the differences in botanical origin.
PCA of NMRThe PCA score plot of the 13C-NMR spectra data derived from the four CCD water extracts (statistical values: Rx2 (0.877) and Q2 (0.721)) and 1H-NMR spectra (Rx2 (0.941) and Q2 (0.907)) are shown in Fig. 5 (The corresponding sample number were presented in Supplementary Materials Figs. S5a and S5b). The PCA models indicated that the CCD water extracts were classified into the following three groups in both the 13C- and 1H-NMR-based analyses: (A) Kijitsu, (B) Tohi, (C), and Chimpi and Kippi (type 2). This classification of the type of CCD water extracts indicates a high distinguishability of these models. The loading plots of the PC1 and PC2 are shown in Supplementary Materials Fig. S6 (Fig. S6a: 13C-NMR and Fig. S6b: 1H-NMR). The assignment of the 13C-NMRspectra revealed the characteristics of compounds 1, 2, 14, and 15 (Fig. S6a); these compounds were responsible for the differentiation in the PCA score plot. The multivariate analysis based on the 13C-NMR spectra (Fig. S6a) identified an area corresponding to the Kijitsu score plot (Fig. 5a, A) that indicated the presence of compounds 1 and 2 in greater abundance than in the other three CCD water extracts (Fig. S6a). A section corresponding to Tohi (Fig. 5a, B) showed that compound 14 was present in a greater abundance than other CCDs. The area corresponding to Chimpi and Kippi (type 2) in the score plot (Figs. 5a, B and C) indicated a greater abundance of compound 15 than other CCDs (Fig. S6a). Similar contributors were detected in the loading plot of 1H-NMR (Fig. S6b) for CCDs extracts differentiation except the compound 2.
Conclusion
Four types of CCD water extracts were analyzed by UHPLC/MS and 13C- and 1H-NMR and the data were used for metabolomic evaluation. PCA revealed that the discrimination of CCD water extracts was successfully achieved irrespective of the analytical method. An analysis of the loading plot identified the contributing components for the differentiation of CCDs (Fig. 6).
Similar to our previous studies, UHPLC/MS and NMR-based metabolomic analysis enabled the discrimination of CCD water extract, however, with differences in components that contributed to group discrimination. It was confirmed that metabolomic analysis using NMR and UHPLC/MS could be applied to distinguish CCD water extracts. The metabolomic analysis using 13C-NMR spectra was also applicable to distinguishing the CCD water extracts as well as methanol extracts. Further development of the quality evaluation using metabolomics for the discriminant and integrated analyses using multiple analytical methods is currently underway.
Experimental
ChemicalsNaringin, neohesperidin, methanol (HPLC grade), 0.1% formic acid, methanol-d4, and acetonitrile (containing 0.1% formic acid) were purchased from Kanto Chemical Co., Ltd. (Tokyo, Japan); neoeriocitrin and nobiletin from Extrasynthase SAS (Lyon, France); meranzin hydrate and meranzin from Ark Pharm Inc. (Arlington Heights, IL, U.S.A.); narirutin and 3,5,6,7,8,3′,4′-heptamethoxyflavone from Sigma-Aldrich (St. Louis, MO, U.S.A.); hesperidin from ACROS (Geel, Belgium); tangeretin from Tokyo Chemical Industry Co., Ltd. (Tokyo, Japan); and sodium 4,4-dimethyl-4-silapentane-1-sulfonate-d6 (DSS-d6) from FUJIFILM Wako Pure Chemical Corporation (Osaka, Japan).
Plant MaterialsAll the crude drugs were obtained as JP17 or Non-JPS2018 grade; details are summarized in Supplementary Materials Table S2. Commercially available products for 11 Kijitsu species (JP17 product), 8 Tohi species (JP17 product), 11 Chimpi species (JP17 product), and 3 Kippi species (type 2, Non-JPS2018 product) were used.
Preparation of CCD Water Extracts and Sample PreparationTwenty-five grams of each drug was suspended in water (500 mL). After boiling the resulting suspension for 1 h, the mixture was filtered and the filtrate was lyophilized to produce the powdered form of the water extract. For UHPLC/MS analysis, 100 mg of the powdered extract was suspended in 1 mL of methanol, sonicated for 10 min, and centrifuged at 2500 × g for 10 min. The supernatant was filtered through a membrane filter (0.45 µm; Merck, Kenilworth, NJ, U.S.A.) to obtain a sample stock solution of 100 mg/mL. This stock solution was diluted 20-fold and used as the sample solution (5 mg/mL) for UHPLC/MS measurements. For NMR analysis, the powdered extract (100 mg) was suspended in solvent (1 mL methanol-d4, containing 0.5 mg/mL DSS-d6 as an internal standard). The resulting suspension was subjected to ultrasonication for 10 min, centrifuged at 2500 ×g for 10 min, and filtered through a membrane filter (0.45 µm; Merck). The methanol-d4 filtrate of each sample was transferred to a 5 mm NMR sample tube for spectral measurements.
UHPLC/MS Data AnalysisThe UHPLC system was interfaced with a Q Exactive hybrid quadrupole-orbitrap mass spectrometer (Thermo Fisher Scientific, Waltham, MA, U.S.A.). Two microliters of each sample were introduced using full-loop injection into an UltiMate 3000 RS LC system equipped with a photodiode array detector (Thermo Fisher Scientific) onto an Acquity UPLC HSS T3 column (100 × 2.1 mm, particle size 1.8 µm, Waters, Milford, MA, U.S.A.) maintained at 40 °C. The mobile phase consisted of a 0.1% aqueous solution of formic acid (phase A) and acetonitrile containing 0.1% formic acid (phase B), at a flow rate of 0.4 mL/min. Gradient elution was performed using the following parameters: 5 to 40% B in the initial 5 min, 95% B in successive 9 min increments, holding for 3 min, and then returned to the initial ratio (5%B) in 0.2 min. MS was measured in the positive- and negative-ion electrospray modes. Nitrogen was used as the desolvation gas at 300 °C. The capillary and cone voltages were set to 4000 and 35 V, respectively. Data were collected over the range of m/z 150 to 2000 and were centroided during the acquisition. All data obtained from the four assays in the two systems in both the positive and negative ion modes were processed using Progenesis QI data analysis software (Nonlinear Dynamics, Newcastle upon Tyne, U.K.). This was used for peak picking, alignment, and normalization to produce peak intensities for retention time and m/z data pairs. The ranges of the automatic peak picking assays were between 1.5 and 14 min. The assignment of individual peaks was performed by direct comparison of the UHPLC/MS data of the CCDs with those of authentic compounds.
NMR Data Acquisition1H- and 13C-NMR were measured at 800 and 201 MHz, respectively, using a JEOL JNM-ECZ800 spectrometer (JEOL, Tokyo, Japan) equipped with the Ultracool™ probe. For the 1H-NMR spectra, the water signal was suppressed using the presaturation method. The measurement parameters were: 32768 data points; spectral width −5 to 15 ppm; acquisition time 1.64 s; delay time 5.36 s; and 64 scans. The parameters of the 13C-NMR spectra were: 65536 data points; spectral width −25 to 225 ppm; acquisition time 1.04 s; delay time 1.96 s; and 3000 scans. The NMR data were processed using the Alice2 metabolome program (JEOL). The NMR spectral data were reduced to the integral region of equal width (0.04 ppm) corresponding to the region of −0.1 to 10.1 ppm spectral buckets for 1H-NMR and 0.2 ppm corresponding to −10 to 210 ppm spectral buckets for 13C-NMR. All spectra were aligned and normalized to DSS using the Alice2 metabolome program. Before the multivariate analysis, the data corresponding to residual water (4.70–4.90 ppm for 1H-NMR), methanol (3.20–3.40 ppm for 1H-NMR, 48.0–52.0 ppm for 13C-NMR), and DSS (−0.10 to 0.10 ppm for 1H-NMR, −10.0 to 5.0 ppm for 13C-NMR) were removed from the data sets. The assignment of each signal was performed by a direct comparison of the NMR spectra of the crude drugs with those of authentic compounds.
Data AnalysisThe resulting data sets were imported into SIMCA version 14.0 (Umetrics, Umeå, Sweden) for further multivariate statistical analysis. The resultant data matrices were mean-centered and then scaled using Pareto scaling. Hotelling’s T2 region shown as an ellipse in the score plots defined the 95% confidence interval of the modeled variation. The quality of the model was checked using Rx2 and Q2 values.
Acknowledgments
This research was supported by the Japan Agency for Medical Research and Development (AMED), Grant number JP19mk0101102. This work was also supported by the Japan Food Chemical Research Foundation.
Conflict of Interest
The authors declare no conflict of interest.
Supplementary Materials
The online version of this article contains supplementary materials.
References
- 1) “Japanese Pharmacopoeia, 17th ed.,” Ministry of Health, Labour and Welfare, Tokyo, Japan, 2016.
- 2) “Japanese Standards for Non-pharmacopoeial Crude Drugs,” Ministry of Health, Labour and Welfare, Tokyo, Japan, 2018.
- 3) Wolfender J.-L., Litaudon M., Touboul D., Queiroz E. F., Nat. Prod. Rep., 36, 855–868 (2019).
- 4) Stavrianidi A., J. Chromatogr. A, 1609, 460501 (2020).
- 5) Segers K., Declerck S., Mangelings D., Heyden Y. V., Eeckhaut A. V., Bioanalysis, 11, 2297–2318 (2019).
- 6) Emwas A.-H., Roy R., McKay R. T., Tenori L., Saccenti E., Gowda G. A. N., Raftery D., Alahmari F., Jaremko L., Jaremko M., Wishart D. S., Metabolites, 9, 123 (2019).
- 7) Tsujimoto T., Yoshitomi T., Maruyama T., Yamamoto Y., Hakamatsuka T., Uchiyama N., J. Pharm. Biomed. Anal., 161, 305–312 (2018).
- 8) Tsujimoto T., Yoshitomi T., Maruyama T., Yamamoto Y., Hakamatsuka T., Uchiyama N., J. Nat. Prod., 82, 2116–2123 (2019).
- 9) Park S.-H., Park E.-K., Kim D.-H., Planta Med., 71, 24–27 (2005).
- 10) Nakagawa H., Takaishi Y., Tanaka N., Tsuchiya K., Shibata H., Higuti T., J. Nat. Prod., 69, 1177–1179 (2006).
- 11) Di Donna L., De Luca G., Mazzotti F., Napoli A., Salerno R., Taverna D., Sindona G., J. Nat. Prod., 72, 1352–1354 (2009).
- 12) Chebrolu K. K., Jayaprakasha G. K., Jifon J., Patil B. S., Separ. Purif. Tech., 116, 137–144 (2013).
- 13) Shikishima Y., Takaishi Y., Honda G., Ito M., Takeda Y., Kodzhimatov O. K., Ashurmetov O., Lee K.-H., Chem. Pharm. Bull., 49, 877–880 (2001).
- 14) Herz W., Kulanthaivel P., Phytochemistry, 21, 2363–2366 (1982).
- 15) Chen J., Montanari A. M., J. Agric. Food Chem., 46, 1235–1238 (1998).
- 16) Pellati F., Benvenuti S., Melegari M., Phytochem. Anal., 15, 220–225 (2004).
- 17) Zhang Y., Huang P., He W., Sakah K. J., Ruan J., Li Z., Wang T., J. Nat. Med., 73, 146–153 (2019).
- 18) Kuroyanagi M., Ishii H., Kawahara N., Sugimoto H., Yamada H., Okihara K., Shirota O., J. Nat. Med., 62, 107–111 (2008).
- 19) Okuyama S., Morita M., Miyoshi K., Nishigawa Y., Kaji M., Sawamoto A., Terugo T., Toyoda N., Makihata N., Amakura Y., Yoshimura M., Nakajima M., Furukawa Y., Neurochem. Int., 70, 30–38 (2014).