Abstract
A facile and reliable fluorescence method for the quantification of urinary uracil concentration is proposed herein. The assay utilizes a specific fluorescence (FL) derivatization reaction for uracil using 3-methylbenzamidoxime as a fluorogenic reagent. Although the presence of urine inhibited the FL reaction, 10 µL of urine was sufficient for the detection of urinary uracil. The uracil derivative was successfully separated from other fluorescent impurities using simple reversed-phase LC with FL detection. Urinary uracil concentrations from 16 people were compared with the concentrations obtained by the traditional column-switching liquid chromatographic analysis with UV detection. The FL derivative of uracil appeared as a single peak in the chromatograms of all samples. However, several samples showed an additional peak overlapping the uracil peak when using the column-switching method because of UV-active impurities. These results indicated that that the present method is not affected by interfering substances in urine and affords a precise determination of urinary uracil. We expect the proposed method to be applicable for diagnosing dihydropyrimidine dehydrogenase deficiency in 5-fluorouracil chemotherapy.
Introduction
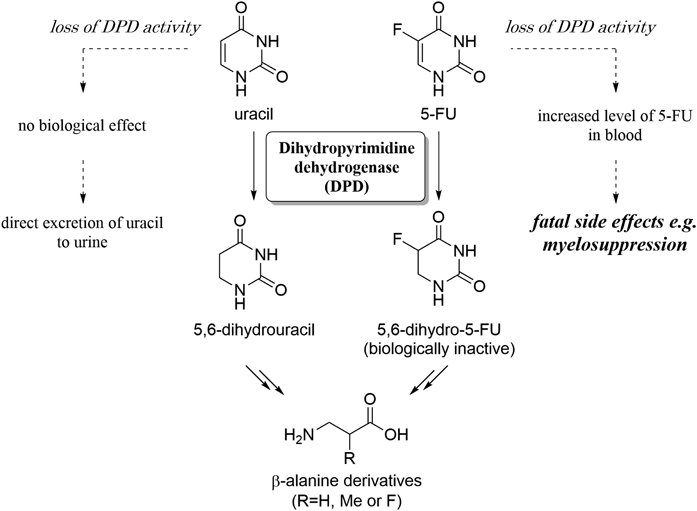
5-Fluorouracil (5-FU) and its prodrugs, such as tegafur and capecitabine, are potent anticancer agents applicable to a wide variety of cancers, e.g. colorectal cancer.1–3) These fluoropyrimidines demonstrate their antitumor activity by inhibiting nucleic acid metabolism. It has been known that the majority of the 5-FU administered is inactivated, and 60–90% of the dose is excreted from the body within 24 h.4–7) The first step of 5-FU catabolism is the reduction to 5,6-dihydro-5-FU by dihydropyrimidine dehydrogenase (DPD) which is a rate-limiting enzyme in the catabolic pathway of pyrimidine nucleobases (Fig. 1). Therefore, a loss of DPD activity could cause an unexpected increase of blood 5-FU concentration during 5-FU-based cancer chemotherapy, leading to fatal side effects.8) In addition, DPD deficiency shows no specific clinical symptoms except for the case of complete loss of DPD activity,9,10) which makes it difficult to diagnose DPD deficiency before fluoropyrimidine treatment.
A high level of uracil can be found in the urine samples of DPD-deficient patients.11) In the digestion of pyrimidine nucleotides, uridine and deoxythymidine are digested to uracil and thymine, respectively. Uracil and thymine are then converted by DPD into 5,6-dihydrouracil and 5,6-dihydrothymine, respectively. In case of cytidine, deamination occurs prior to the elimination of the nucleobase moiety, resulting in the production of uridine. Since DPD is the rate-limiting enzyme in pyrimidine catabolism, the reaction is slow and a significant quantity of uracil remains unchanged even in non-DPD-deficient people. Furthermore, these metabolites accumulate in urine at a level detectable by HPLC with UV detection. The excretion level of uracil is significantly affected by the activity of DPD, and the measurement of urinary uracil concentration is thought to be the main indicator for DPD activity.12) The most important step for determining uracil concentration is the isolation of uracil in urine. A single separation mode such as reversed-phase chromatography is not satisfactory as urine contains numerous UV-active substances and uracil is highly hydrophilic. Thus, a column-switching technique that consists of a strong cation exchange column and a reversed-phase column has been employed in the past.13,14) However, this method requires specialized equipment. Mass spectrometry (MS) techniques e.g. GC-MS15) and liquid chromatography-tandem mass spectrometry (LC-MS/MS)16) have also been applied to the quantification of urinary uracil. An extraction of organic components into an organic solvent and their trimethylsilylation are necessary prior to the analysis in case of GC-MS method, which are laborious and time consuming. LC-MS/MS is a powerful tool for the analysis of complex biomaterials, although the system is expensive and the analysis requires the operator’s experienced skill.17)
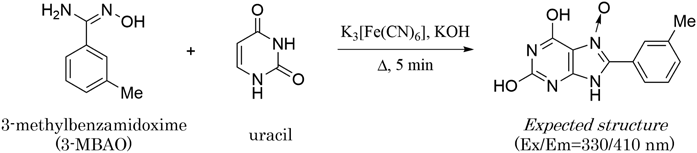
Recently, we have developed a novel fluorescence (FL) derivatization reaction for uracil using benzamidoxime (BAO) as a fluorogenic reagent.18) The reaction requires the simple addition of reagents and heating for several minutes, and exhibits high specificity toward uracil among 50 biological substances. We also found that 3-methylbenzamidoxime (3-MBAO, Fig. 2), a BAO analogue, produces stronger FL with uracil with the same substance specificity (see supplementary materials).19) In this research, the uracil-specific reaction with 3-MBAO was applied to quantify urinary uracil using HPLC without a column-switching device, and the results were compared to the values obtained using the conventional column-switching method.
Results and Discussion
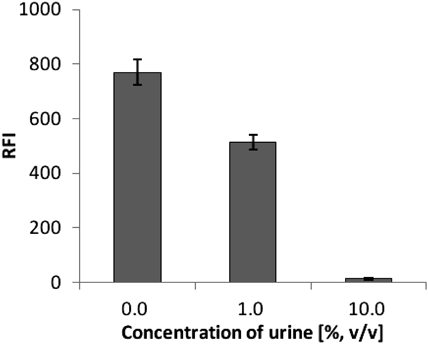
Optimum Concentration of Urine Samples for Fluorescence ReactionA urine sample contains numerous compounds, some of which may inhibit the uracil-specific FL reaction. First, we investigated the effect of urine on the FL intensity of uracil. Different volumes of untreated urine were mixed with 1 µM of pure uracil, and the mixtures were used for the FL reaction according to the previously reported procedure.18) The resulting FL intensities were measured at 330/410 nm. The presence of urine clearly inhibited the FL reaction (Fig. 3). The presence of urine clearly inhibited the FL reaction (Fig. 3). The presence of 1% urine (10 µL urine in 1 mL of reaction mixture) in the reaction diminished the FL intensity by 60%, and complete inhibition was observed when 10% urine was added into the mixture. Although slight inhibition occurred with 1% urine, the FL from uracil was sufficiently strong to detect urinary uracil. It seemed that the presence of urine did not affect the derivatization rate, and the reaction time of 5 min was adopted for the derivatization of urinary uracil.18)
Fluorescence Detection and Quantitation of Urinary Uracil Using HPLCNext, we investigated whether urinary uracil can be directly detected using a HPLC equipped with an FL detector after the FL reaction. The product of the uracil-specific FL reaction is very hydrophobic,19) and an organic solvent was mandatory when a general octadecylsilyl (ODS) silica-gel column was used for the detection of the FL product. An Isocratic elution with 30% methanol was enough in order to detect the FL product as a single peak with the retention time of 16.8 min (Fig. 4A). Next, the FL reaction was conducted using 1% urine, and the reaction mixture was injected to the HPLC without further purification. The FL peak from uracil appeared at the same retention time, indicating that urinary uracil could be detected by the present method (Fig. 4B). Although several fluorescent-active materials were present in the urine samples, these appeared to be hydrophilic and were eluted immediately after the dead volume. In addition, no fluorescent-active peaks other than uracil appeared on the chromatogram and no fluorescent impurities overlapped with the desired peak. These characteristics could be advantageous for the quantification of urinary uracil. When a 2 nmol uracil was spiked to the urine sample, the peak area of the FL product increased (Fig. 4C). Since the present FL reaction is highly specific for uracil, the difference between the peaks from before and after the uracil spike should correspond to the quantity of uracil spiked. This calculation allowed the formation of a calibration curve for uracil in urine, leading to the quantification of uracil concentration before spiking. A good linearity (Y = 2.134 × 10⁵X + 372.9, r2 = 0.9998; Y is the area of the FL product of uracil and X is the concentration of uracil) was obtained up to 10 µM with the lower quantification limit of 50 nM (see supplementary materials). The lower detection limit of urinary uracil by the present method was found to be approximately 25 nM (S/N = 3). The recovery rates from a spike and recovery test were 104.5% with 0.2 nmol uracil and 101.4% with 2 nmol uracil, respectively (see supplementary materials). These results proved that the preciseness of the present method would be satisfactory for the quantification of urinary uracil concentration.
Comparisons between the Present Method and the Column-Switching MethodQuantification of urinary uracil by the present FL method was performed using 16 urine samples, including 9 samples from healthy volunteers and 7 samples from cancer patients, taken before 5-FU chemotherapy. In each experiment, 2 reaction mixtures were prepared with the reaction volume of 1.0 mL in 1.5 mL tubes. One tube contained 1% urine and the reagents for FL reaction, and the other contained 1% urine, the reagents and 2 nmol of standard uracil. The accuracy of the present FL method was investigated by comparing the results with those obtained using the conventional column-switching method with UV detection (see supplementary materials). In every chromatogram obtained using the FL method, urinary uracil was separated and detected as a single peak. Analysis performed in triplicate demonstrated the high reproducibility of the method (Table 1).
Table 1. Urinary Uracil Concentration of 16 Urine Samples Obtained by the Present Method (Left Column: FL) and the Conventional Column-Switching Method (Right Column: UV) (
n = 3)
| Entry | Donor | FL (mM ± S.D.) | UV (mM ± S.D.) |
|---|
| 1 | Volunteer # 1 | 102.3 ± 2.1 | — |
| 2 | Volunteer # 2 | 75.5 ± 3.1 | 50.7 ± 12.7 |
| 3 | Volunteer # 3 | 14.5 ± 4.2 | 10.3 ± 0.1 |
| 4 | Volunteer # 4 | 40.3 ± 1.2 | 44.7 ± 13.5 |
| 5 | Volunteer # 5 | 18.3 ± 0.7 | 7.1 ± 1.3 |
| 6 | Volunteer # 6 | 42.2 ± 5.9 | 27.3 ± 2.2 |
| 7 | Volunteer # 7 | 91.4 ± 4.7 | 84.4 ± 19.7 |
| 8 | Volunteer # 8 | 90.3 ± 6.4 | 45.5 ± 22.0 |
| 9 | Volunteer # 9 | 42.6 ± 3.1 | 27.5 ± 6.5 |
| 10 | Cancer patient # 1 | 5.7 ± 0.2 | 6.1 ± 1.3 |
| 11 | Cancer patient # 2 | 58.6 ± 5.5 | 54.0 ± 3.1 |
| 12 | Cancer patient # 3 | 89.5 ± 5.9 | 59.7 ± 1.6 |
| 13 | Cancer patient # 4 | 198.9 ± 17.6 | 193.4 ± 25.8 |
| 14 | Cancer patient # 5 | 48.8 ± 4.9 | 29.4 ± 4.9 |
| 15 | Cancer patient # 6 | 17.2 ± 5.9 | 23.5 ± 3.4 |
| 16 | Cancer patient # 7 | 32.8 ± 3.0 | 17.8 ± 1.7 |
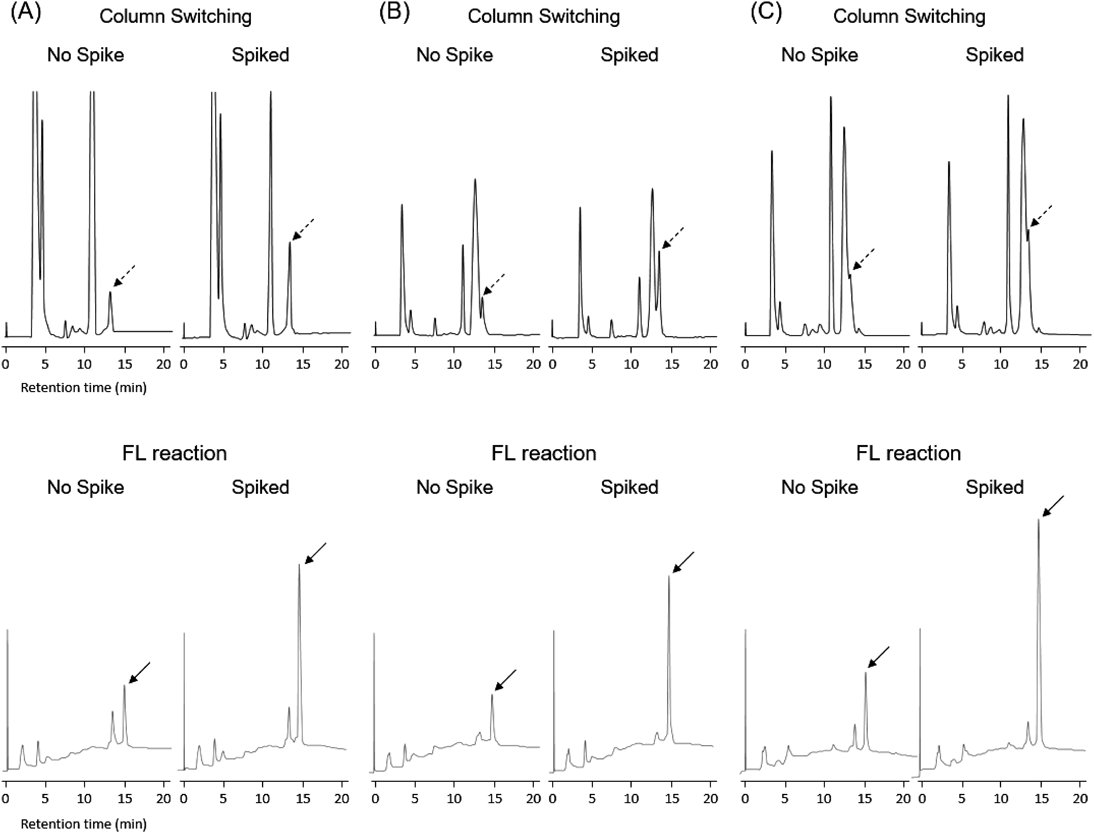
In the case of the column-switching UV method, the uracil peak appeared at 13.2 min. It was found that the efficacy of urinary uracil quantification depended significantly on the impurity peak appearing immediately before the uracil peak. When no UV-active impurity peaks appeared in proximity to the uracil peak (Fig. 5A), urinary uracil could be quantified precisely, and values obtained from such chromatograms were similar to those obtained using the FL method. However, the impurity peaks, especially the peak appearing at 12.4 min, posed a significant problem and overlapped with the uracil peak in many cases (Fig. 5B); this affected the accuracy of the uracil quantification. A similar chromatogram in which the majority of the uracil peak was obscured by impurities has been reported previously.20) The uracil concentration derived from the UV method tended to be low in comparison with that from the FL method, which implied that high concentrations of impurities could cause significant discrepancies in uracil quantification between the two methods. An unexpected chromatogram was obtained for one of the sixteen samples. The uracil peak was completely obscured by the impurity peak (Fig. 5C), which made it impossible to quantify the urinary uracil. It should be noted that the urinary uracil concentration of this sample was unambiguously quantified by our FL method.
Conclusion
In this study, the uracil-specific FL reaction has been applied to determine the urinary uracil concentration. Since numerous components coexist in a urine sample, the conventional HPLC method utilizes a column-switching technique. In contrast, the uracil-specific FL reaction allowed simple quantification of urinary uracil using a single reversed-phase HPLC method. Another advantage of this method is that deproteination prior to HPLC analysis is not necessary. The urinary uracil peaks in the chromatograms obtained using the column-switching method were partially obscured by peaks attributed to UV-active impurities in many cases, which complicated the quantification of urinary uracil. For one of the sixteen urine samples the impurity peak completely overlapped the uracil peak. These urinary uracil concentrations were typically calculated to be lower than those obtained by our method. This indicates that the column-switching method may underestimate the urinary uracil concentration depending on the quantity of impurity. Underestimation of urinary uracil might lead to a false-negative diagnosis of DPD deficiency. In France, the measurement of uracil concentration in plasma is legally required prior to the fluoropyrimidine treatment.21) We believe that our FL method allows the precise determination of uracil levels in biological samples, which could be useful for 5-FU cancer chemotherapy.
Experimental
General Remarks3-MBAO was purchased from Sigma-Aldrich (St. Louis, U.S.A.). K3[Fe(CN)6], KOH, phosphoric acid and triethylamine were obtained from Nacalai Tesque (Kyoto, Japan). Methanol was purchased from Kanto Chemical Co. (Tokyo, Japan). All chemicals were of analytical or guaranteed reagent grade and were used without further purification. Water was purified using a Milli-Q systemWR600 A from Millipore (Molsheim, France).
Urine SamplesThis study was approved by the Ethical Review Board of the Institutional Ethical Committee of the Japanese Red Cross Society Narita Hospital (No. 278), Nagasaki University (No. 36) and Gunma University (HS2019-195). All volunteers signed the informed consent form. Urine samples were collected from 9 healthy volunteers at Nagasaki University and 7 cancer patients not undergoing fluoropyrimidine treatment at the Japanese Red Cross Society Narita Hospital. These samples were stored at −80 °C until analysis. On the day of analysis, the urine samples were defrosted and filtered through a cellulose acetate membrane filter of 0.45 µm pore size (Tosoh, Tokyo, Japan). The filtrate was diluted 10 times with water. The urinary creatinine level was measured with a LabAssay™ creatinine quantification kit (WAKO, Osaka, Japan).
Fluorescence Detection of Uracil Using a Reversed-Phase HPLC SystemThe reagents for the fluorogenic reaction were dissolved in water to make stock solutions of 4 mM 3-MBAO, 8 mM K3[Fe(CN)6] and 4 M KOH. A 400 µM uracil standard solution was prepared and was further diluted for the standard addition experiment as appropriate. Each urine sample was filtered through a cellulose acetate membrane filter of 0.45 µm pore size (Tosoh, Tokyo, Japan). The filtrate was diluted 10 times with water, and 100 µL of the resulting 10% urine was placed in a 1.5 mL tube. To this was added 150 µL of uracil standard solution, 250 µL of 4 mM 3-MBAO, 250 µL of 8 mM K3[Fe(CN)6] and 250 µL of 4 M KOH. In case of the standard addition method, 100 µL of 20 µM uracil solution and 50 µL of water were used. The tube was placed in a dry block bath MG-2200 (EYELA, Tokyo, Japan) preheated to 100 °C. After a reaction time of 5 min, the solution was cooled in an ice bath to stop the reaction. Separation of the fluorescent uracil derivative was performed by reversed-phase HPLC using a Jasco FP-2020 fluorescence detector (Tokyo, Japan) equipped with a Jasco PU-2089 gradient pump and a Nacalai Tesque Cosmosil 5C18-MS-II column (4.6 mm I.D. × 150 mm). Fluorescence was monitored at Ex/Em = 330/410 nm.
UV Detection of Uracil Using a Column-Switching HPLC SystemThe conventional UV detection of urinary uracil was conducted on a column-switching HPLC system according to the previously reported method12) with slight modifications. A Jasco PU-980 pump with a Jasco LG-980-02 gradient unit and a Jasco DG-980-50 degasser were connected to a Jasco UV-970 UV/VIS detector and Jasco 807-IT integrator. The first column was a Nacalai Tesque Cosmosil 5C18-MS-II (4.6 mm I.D. × 150 mm) reversed-phase column and the second column was a Tosoh (Tokyo, Japan) TSKgel SCX (H+) (7.8 mm I.D. × 300 mm) cation exchange column. Prior to the analysis, the urine samples were diluted 7 times with deproteination solution obtained from WAKO. After brief centrifugation, the supernatant was analyzed by HPLC. The urine sample was introduced to the first column, and the fraction containing uracil (4.0–5.0 min) was delivered to the second column. The eluent was 10 mM triethylammonium phosphate (pH 3.0), and isocratic elution was employed at a flow rate of 1.0 mL/min.
Acknowledgments
This research was partly supported by Grants-in-Aid for Scientific Research from the Japan Society for the Promotion of Science (JSPS), partly supported by the Center for Clinical and Translational Research of Kyushu University, and partly supported by a research grant from the Astellas Foundation for Research on Metabolic Disorders.
Conflict of Interest
The authors declare no conflict of interest.
Supplementary Materials
The online version of this article contains supplementary materials.
References
- 1) Longley D. B., Harkin D. P., Johnston P. G., Nat. Rev. Cancer, 3, 330–338 (2003).
- 2) Lamont E. B., Schilsky R. L., Clin. Cancer Res., 5, 2289–2296 (1999).
- 3) Kobuchi S., Ito Y., Okada K., Imoto K., Kuwano S., Takada K., Biol. Pharm. Bull., 36, 907–916 (2013).
- 4) van Kuilenburg A. B., Klumpen H. J., Westermann A. M., Zoetekouw L., Van Lenthe H., Bakker P. J., Richel D. J., Guchelaar H. J., Eur. J. Cancer, 43, 459–465 (2007).
- 5) Yoshida Y., Ogura K., Hiratsuka A., Aisu N., Yamada T., Kojima D., Tanimura S., Ogata K., Hara S., Mogi A., Takamatsu Y., Tamura K., Mishima H., Yamashita Y., Anticancer Res., 35, 4881–4887 (2015).
- 6) Mercier C., Ciccolini J., Clin. Colorectal Cancer, 6, 288–296 (2006).
- 7) Niwa T., Shiraga T., Ohno Y., Kagayama A., Biol. Pharm. Bull., 28, 1071–1074 (2005).
- 8) van Kuilenburg A. B., Eur. J. Cancer, 40, 939–950 (2004).
- 9) Mazur A., Figurski S., Płoskoń A., Meijer J., Zoetekouw L., Watróbska S., Sykut-Cegielska J., Gradowska W., van Kuilenburg A. B., Acta Biochim. Pol., 55, 787–790 (2008).
- 10) Bakkeren J. A., De Abreu R. A., Sengers R. C., Gabreëls F. J., Maas J. M., Renier W. O., Clin. Chim. Acta, 140, 247–256 (1984).
- 11) Vidotto C., Fousert D., Akkermann M., Griesmacher A., Müller M. M., Clin. Chim. Acta, 335, 27–32 (2003).
- 12) Jiang H., Jiang J., Hu P., Hu Y., J. Chromatogr. B Analyt. Technol. Biomed. Life Sci., 769, 169–176 (2002).
- 13) Ohba S., Kidouchi K., Katoh T., Kibe T., Kobayashi M., Wada Y., J. Chromatogr. A, 568, 325–332 (1991).
- 14) Sumi S., Kidouchi K., Ohba S., Wada Y., J. Chromatogr. B Biomed. Appl., 672, 233–239 (1995).
- 15) Alsharhan H., Alharbi H., Priestley J., Ganetzky R., He M., Clin. Chem., 66, 988–989 (2020).
- 16) Jiang H., Lu J., Ji J., Br. J. Pharmacol., 141, 616–623 (2004).
- 17) Kim K., Lee J., Park J., Kim M., Kim J., Shin H., Kang N., Cho H., Yoon I., Kim D., Chem. Pharm. Bull., 64, 1582–1588 (2016).
- 18) Shibata T., Kawasaki S., Fujita J., Kabashima T., Kai M., Anal. Chim. Acta, 674, 234–238 (2010).
- 19) Kai M., Shibata T., U.S. Patent 8 871 520 B2 (2014).
- 20) Ciccolini J., Mercier C., Evrard A., Dahan L., Boyer J. C., Duffaud F., Richard K., Blanquicett C., Milano G., Blesius A., Durand A., Seitz J. F., Favre R., Lacarelle B., Ther. Drug Monit., 28, 678–685 (2006).
- 21) Marin C., Krache A., Palmaro C., Lucas M., Hilaire V., Ugdonne R., De Victor B., Quaranta S., Solas C., Lacarelle B., Ciccolini J., Clin. Transl. Sci., 13, 761–768 (2020).