Abstract
The dissolution behaviors of base excipients from sustained-release formulations have been investigated using various methodologies. However, the dissolution of polymers has not been fully evaluated because differences between formulations are still verified only by the release of active pharmaceutical ingredients (APIs). In our previous study, we proposed a quick and simultaneous analysis of dissolved APIs and water-soluble polymers by ultra HPLC using charged aerosol and photodiode array detectors. The purpose of this study was to verify whether the analysis system could be adapted to other water-soluble polymers. Dissolution tests were conducted using matrix model tablets prepared from three polymers and three APIs (propranolol, ranitidine, and cilostazol) with different solubilities. The dissolution profiles of the polymers and APIs were determined using the proposed analysis system and compared. The results clarified differences in the dissolution behaviors of the APIs and polymers. The polymers, especially hydroxypropyl cellulose, exhibited the dissolution properties characteristic of each model formulation. Propranolol and ranitidine showed the diffusion type, while cilostazol showed the erosion type release mechanism due to their different solubilities. The release of cilostazol was delayed in all models compared to the polymer, which may be due to the aggregation of cilostazol in the gel layer. This analytical method can be used to study the dissolution behavior (diffusion or erosion) of APIs from matrix tablets containing various polymers. This method will provide useful information on release control, which will make it easier and more efficient to design appropriate formulations and analyze the release mechanisms.
Introduction
Owing to active research on sustained-release formulations (SRFs) conducted over the last four decades, a variety of SRFs have been developed.1) Even when pharmaceutical industries shift their attention to new drug modalities, a number of SRFs continue to play major roles in improving patient QOL, and oral solid SRFs are the most popular for patients and physicians.2) This is why oral SRFs still represent some of the most important formulations in terms of life cycle management. In oral solid SRF systems, the matrix formulation, osmotic controlled release oral delivery system, and polymeric coating on nucleated tablets and granules are included, among which, the matrix formulation is the most popular because of the availability of information concerning the sustained-release mechanism and ease of manufacture.
Various grades of water-soluble, water-insoluble, and pH-responsive polymers, which have been supplied by various manufacturers, are used as the base excipients for matrix formulations. Among these, water-soluble polymers such as hypromellose (HPMC), hydroxypropyl cellulose (HPC), and polyethylene oxide (PEO) are highly versatile for matrix formulations because of their safety, applicability, and compatibility with many drugs.3–5) For matrix formulations utilizing water-soluble polymers, the key factors for the release mechanism of the active pharmaceutical ingredient (API) are the polymer concentration (the amount of polymer), API loading, API-polymer interaction, tablet shape (diameter and dimensions), and the dissolution test medium.6) Adjustment of the polymer grade and quantity is a major issue in designing formulations using these agents, which is usually achieved through the investigation of API release profiles.
The well-studied mathematical model by Peppas and colleagues regarding the design principle allows the elucidation and prediction of the release of APIs and the mechanisms involved.7–9) They are convenient and useful for formulation design to achieve the desired API release. However, even if the desired release of APIs is obtained, a discrepancy is often observed between in vitro drug release and in vivo absorption. The elucidation of the cause for this discrepancy is one of the hurdles faced by formulation engineers.10) However, in many cases, the mechanism is related to the physical properties of the API (solubility and membrane permeability), and the condition of the formulation in the gastrointestinal tract can also significantly affect API release. Consequently, the release behavior of the base excipient is also very important.
The dissolution behavior of the base excipients from SRF has been investigated using various methodologies. For example, Nunthanid and colleagues evaluated the swelling behavior of spray-dried chitosan acetate in buffers using magnetic resonance imaging.11) Melia and colleagues examined the profile of polymer hydration and growth of the gel layer during the early stage of layer formation by confocal laser scanning microscopy to verify the percolation theory.12) In addition, various techniques, including differential refractometry, optical microscopy, fluorometry, gravimetry, interferometry, and Fourier transform IR imaging, have been applied to characterize the swelling behavior of polymers.13) However, the dissolution of polymers from SRFs has not been fully evaluated because differences involving SRFs are still verified only by the release of APIs. Nevertheless, the dissolution behavior of the polymers provides important information. For example, Kojima et al. determined PEO in matrix bases by gravimetry and clarified that the release mechanism of APIs is the diffusion type. Based on these findings, they proposed a prescription design to improve API release.14) Utilizing gravimetry, Chaerunisaa et al. reported a modification to the release of two APIs with different solubilities in a combined matrix tablet as a fixed-dose combination for extended release.15) In gravimetry, tablets must be removed from the dissolution test machine, resulting in the termination of the dissolution test. Additionally, it takes considerable time to dry wet tablets. Ohara et al. assayed the concentrations of HPMC in dissolution samples using gel permeation chromatography with a refractive index detector and discussed the amount of HPMC evaluated in the solid dispersion to improve solubility.16) Determination using conventional gel permeation chromatography is time-consuming.
Therefore, in our previous study, we proposed a rapid and simultaneous analysis of dissolved APIs and water-soluble polymers in samples from dissolution tests using ultrahigh-performance liquid chromatography (UHPLC) with charged aerosol detector (CAD) and photodiode array (PDA) detector.17) After the validation of the method, analysis of matrix model formulations using low-viscosity grade PEO was successfully conducted to confirm the basic performance of the method.
The purpose of this study was to verify whether the analysis system could be adapted to other water-soluble polymers, such as high-grade PEO, HPMC, and HPC. Initially, matrix model tablets using the three polymers and three APIs with different solubilities, propranolol hydrochloride (PRO), ranitidine hydrochloride (RAN), and cilostazol (CLZ), were prepared. The dissolution profiles of the polymers and APIs were determined using the analysis system and compared. Then, in order to discuss the obtained dissolution behavior in detail, CLZ models were subjected to photographic observation and component analysis.
Experimental
MaterialsPRO, RAN, and acetonitrile (Acetonitrile-Plus-) were purchased from Tokyo Chemical Industry Co., Ltd. (Tokyo, Japan). CLZ was synthesized by Otsuka Pharmaceutical Co., Ltd. (Tokushima, Japan). Polyethylene oxide (PEO-18NF), HPMC (METOLOSE 90SH-100000SR), and HPC (HPC-H) were obtained from Sumitomo Seika Chemicals Co., Ltd. (Tokyo, Japan), Shin-Etsu Chemical Co., Ltd. (Tokyo, Japan), and Nippon Soda Co., Ltd. (Tokyo, Japan), respectively. Magnesium stearate and light anhydrous silicic acid (Adsolider 101) were purchased from Taihei Chemical Industrial Co., Ltd. (Osaka, Japan) and Freund Corporation (Tokyo, Japan), respectively. Trifluoroacetic acid was obtained from FUJIFILM Wako Pure Chemical Corporation (Osaka, Japan). Cetyltrimethylammonium bromide (CTAB) was purchased from Shimadzu Corporation (Kyoto, Japan). All other chemicals and solvents were of analytical reagent grade, and distilled water was used throughout the study.
Preparation of the Model Matrix TabletsModel sustained-release tablets were prepared using polyethylene oxide (PEO-18NF), HPMC (METOLOSE 90SH-100000SR), and HPC (HPC-H). The formulations of each tablet are presented in Table 1. All materials were passed through a sieve (500 µm) before mixing to avoid aggregation. The mixing weight ratio of the polymers and the APIs (free molecules) was fixed at 1 : 1. The APIs were manually mixed with each polymer, light anhydrous silicic acid, and magnesium stearate. The tablets were punched at a pressure of 8 kN using a CRUX 033 L (KIKUSUI, Kyoto, Japan) with an 8-mm pestle. After preparation, all tablets were stored at 25 °C.
Table 1. Formulations of Model Matrix Tablets Containing PRO, RAN, and CLZ
| PEO PRO | HPMC PRO | HPC PRO | PEO RAN | HPMC RAN | HPC RAN | PEO CLZ | HPMC CLZ | HPC CLZ |
|---|
| Propranolol hydrochloride | 114 | 114 | 114 | — | — | — | — | — | — |
| Ranitidine hydrochloride | — | — | — | 112 | 112 | 112 | — | — | — |
| Cilostazol | — | — | — | — | — | — | 100 | 100 | 100 |
| PEO-18NF | 100 | — | — | 100 | — | — | 100 | — | — |
| METOLOSE 90SH-100000SR | — | 100 | — | — | 100 | — | — | 100 | — |
| HPC-H | — | — | 100 | — | — | 100 | — | — | 100 |
| Light anhydrous silicic acid | 1 | 1 | 1 | 1 | 1 | 1 | 1 | 1 | 1 |
| Magnesium stearate | 2 | 2 | 2 | 2 | 2 | 2 | 2 | 2 | 2 |
| Total (mg) | 217 | 217 | 217 | 215 | 215 | 215 | 203 | 203 | 203 |
A dissolution experiment was utilized to evaluate the in vitro release properties of the APIs and polymers from the matrices. The studies were carried out at 37 °C using the U.S. Pharmacopeia (USP) <711> DISSOLUTION apparatus II (paddle method) with a paddle speed of 150 rpm in 900 mL of medium (n = 3). To prevent the formulations from sticking to the vessel bottom and to allow three-dimensional matrix swelling, stainless steel sinkers (mesh aperture of 3.0–3.5 mm, as listed in USP <711>) were used. Dissolution media were distilled water for the formulations of PRO and RAN and 0.3% CTAB aqueous solution for CLZ to increase the solubility of CLZ and to achieve sink conditions. At predetermined time intervals (every 2 h for the initial 12 h, every 3 h thereafter to 24 h, and every 2 or 3 h up to the complete polymer dissolution after the last sampling for dissolution tests), aliquots of 5 mL were withdrawn from the dissolution vessel using an autosampler (DS-3000; Dainippon Seiki Co., Ltd., Kyoto, Japan). Samples were filtered through a syringe membrane filter (0.22-µm hydrophilic HDPE filter; Shimadzu Corporation). The concentrations of the APIs and polymers dissolved from the tablet were determined using the UHPLC system as described below.
Analytical MethodLevels of APIs and polymers were determined simultaneously using an UHPLC system (UltiMate 3000; Thermo Fisher Scientific, MA, U.S.A.) equipped with two size exclusion chromatography (SEC) columns (ACQITY UPLC Protein BEH125Å SEC guard column, 1.7 μm, 4.6 × 30 mm and ACQITY UPLC Protein BEH450Å SEC guard column, 2.5 μm, 4.6 × 30 mm; Waters, MA, U.S.A.) for the separation of the APIs and polymers. A PDA detector and CAD (Corona; ESA Biosciences, MA, U.S.A.) were used to determine the API and polymer levels, respectively. Acetonitrile/water/trifluoroacetic acid (500 : 500 : 1) was used as the mobile phase. The flow rate was 0.2 mL/min. PRO, RAN, and CLZ were detected at wavelengths of 290, 315, and 254 nm, respectively. APIs and polymers were quantified from PDA and CAD chromatograms, respectively.
Calculation of the Amounts of Dissolved APIs and Polymers Derived from the Matrix TabletsThe dissolution of APIs and polymers was calculated using Eq. (1)18):
 | (1) |
An, V0, VS, and Am are the peak areas of the nth sample, the initial volume of the dissolution medium (900 mL), the sampling volume, and the peak area of the final sample (mth sample), respectively. Based on Eq.(1), the precise dissolution (%) can be calculated by correcting the volume change due to sampling.
Degradation of the polymer backbone during storage may change the molecular size distribution of the polymer, resulting in changes to the shape and area of the polymer CAD peak. Consequently, evaluation using a fresh polymer as a standard may be misleading. The complete dissolution of both the API and polymer should refer to the final sample at complete dissolution. Therefore, additional samples were taken after the end of the test to confirm the complete dissolution of APIs and polymers.
Photographic ObservationsChanges in the appearance of all the model tablets were observed over time. Tablets trapped in a sinker were removed from the vessel and placed on a glass Petri dish. Photographs were taken using a digital camera (TG-6; Olympus, Tokyo, Japan). For the CLZ model, a digital microscope (VHX-7000; Keyence, Osaka, Japan) was used to measure the size of the aggregates in the gel layer.
Raman SpectroscopyRaman spectra of the component in the gel layer during the dissolution test of CLZ formulations were recorded using an inVia Raman microscope system (Renishaw Plc., Gloucestershire, U.K.) equipped with a Leica microscope and a 785 nm excitation laser with 300 mW power. An objective lens (20 ×) was used for recording.
Particle Size Measurement of MaterialsEach material (10 mg of PEO, HPMC, and HPC) was dispersed in hexane to which 1% lecithin was added to avoid aggregation of materials. Mean particle sizes were measured using a laser diffraction particle distribution meter (SALD-3000; Shimadzu).
Analysis of Similarities of Dissolution ProfilesDifferences in the dissolution profiles were analyzed based on the similarity factor f2, defined in Eq. (2)19–21):
 | (2) |
Rt and Tt are the mean dissolution ratios of the reference and test formulations at each time point, respectively. n is the number of time points at which the mean dissolution rates were compared. f2 between 50 and 100 suggests the similarity of the two dissolution profiles. In this study, f2 was calculated from the sampling points for which the dissolution was <85%, and the single point at which the dissolution first exceeded 85%.
Results
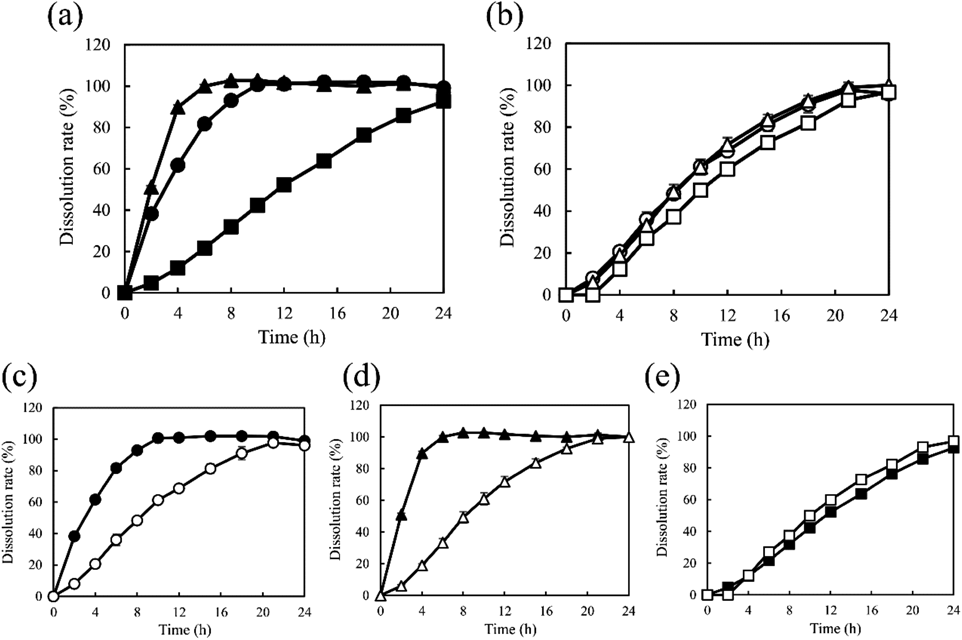
Dissolution Profiles of APIs and Polymers from PEO-Based Model TabletsFigure 1 presents the dissolution profiles of the APIs and PEO from the model tablets. All formulations exhibited a sustained-release profile. As shown in Fig. 1(a), the release of PRO and RAN from the tablets was completed within 8 and 10 h, while CLZ was continuously released for 24 h. As indicated in Fig. 1(b), the dissolution profiles of PEO from PEO PRO and PEO RAN were similar (f2 = 82). Dissolution reached 100% within 21 h. Although the release of PEO from PEO CLZ was likely slower than those from PEO PRO and PEO RAN, the f2 value of 51 (between PEO PRO and PEO CLZ) indicated the similarity of the profiles. According to the release profiles of the two components from each model tablet (Figs. 1(c) and (d)), the dissolution of PRO and RAN was more rapid than that of PEO. In contrast, according to the results for PEO CLZ shown in Fig. 1(e), the dissolution of PEO was slightly faster than that of CLZ, but the dissolution behaviors of both were similar (f2 = 60). The differences in the dissolution behaviors of the APIs and PEO from the three model tablets could be clarified.
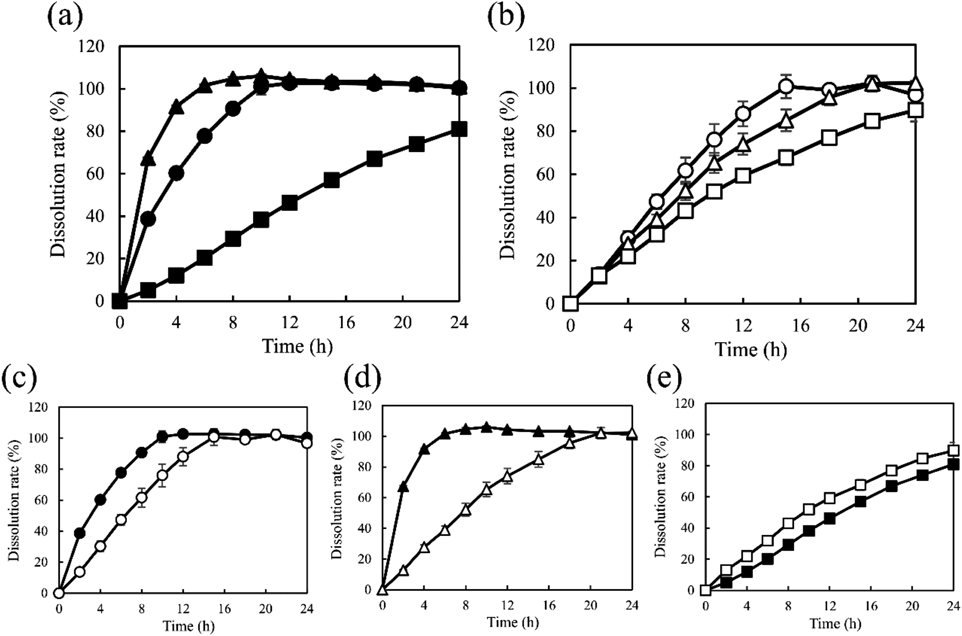
Dissolution Profiles of APIs and Polymers from HPMC-Based Model TabletsDissolution profiles of the APIs and HPMC from the model tablets are shown in Fig. 2. All formulations showed a sustained-release profile, as observed for the PEO model tablets. As shown in Fig. 2(a), the release of PRO and RAN was completed by 8 and 15 h, respectively, while CLZ was continuously released for >24 h. As shown in Fig. 2(b), the dissolution profiles of HPMC for all model formulations were the same (f2 = 67 between HPMC RAN and HPMC PRO, f2 = 74 between HPMC RAN and HPMC CLZ). According to Figs. 2(c) and (d), PRO and RAN underwent faster dissolution compared to HPMC. In contrast, the release of CLZ was consistent with that of HPMC (f2 = 69) (Fig. 2(e)).
Dissolution Profiles of APIs and Polymers from HPC-Based Model TabletsDissolution profiles of the APIs and HPC from the model tablets are shown in Fig. 3. All formulations showed a sustained-release profile similar to that of the above two models. As shown in Fig. 3(a), the release of PRO and RAN was completed by 6 and 10 h, whereas CLZ was continuously released for >24 h. As indicated in Fig. 3(b), the dissolution of HPC from HPC PRO and HPC RAN was completed by 15 and 18 h, respectively (f2 = 49). The release of HPC from HPC CLZ was continued for 24 h (up to the end of the dissolution test) and was slower than that observed for the other HPC formulations (f2 = 45 between HPC RAN and HPC CLZ). According to the release profiles of the two components (Figs. 3(c) and (d)), the dissolution of PRO and RAN was faster than that of HPC. In contrast, as shown in Fig. 3(e), the dissolution of CLZ was slower than that of HPC (f2 = 47).
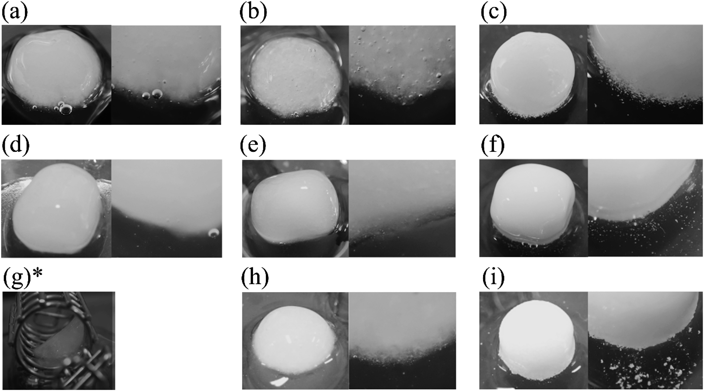
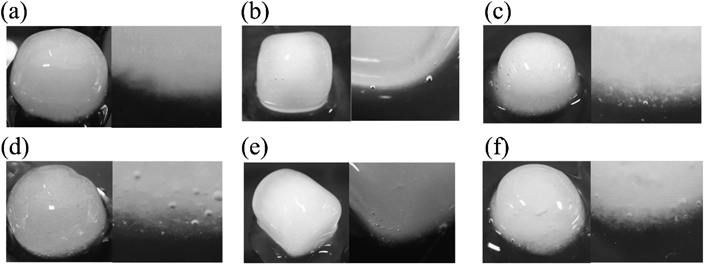
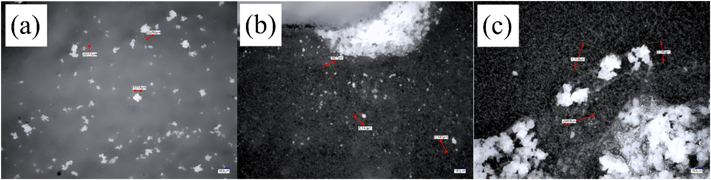
Analysis of the Components in the Gel Layer of CLZ ModelsAs mentioned above, the dissolution of the polymer from the CLZ models was faster than or equal to that of CLZ. To analyze the dissolution behavior of the CLZ model, changes in the appearance of all model tablets were observed over time. The appearance of each tablet 8 h after the start of the dissolution test is shown in Fig. 4. The model tablets containing PRO and RAN showed no white component at the tablet interface (within the gel layer), as shown in Figs. 4 (a), (b), (d), (e), (g), and (h), whereas white components were observed in all CLZ model tablets. PEO CLZ and HPC CLZ showed relatively large aggregates (Figs. 4 (c) and (i)), while those of HPMC CLZ were fine (Fig. 4 (f)). As shown in Fig. 5, no aggregate was observed in model formulations of PRO and RAN at 3 h, when approximately 30% of PRO and RAN was dissolved.
The sizes of the aggregates were determined based on a digital scale of the microscope. The confirmed sizes of the aggregates observed for PEO CLZ, HPMC CLZ, and HPC CLZ were approximately 296, 140, and 704 μm, respectively (Fig. 6).
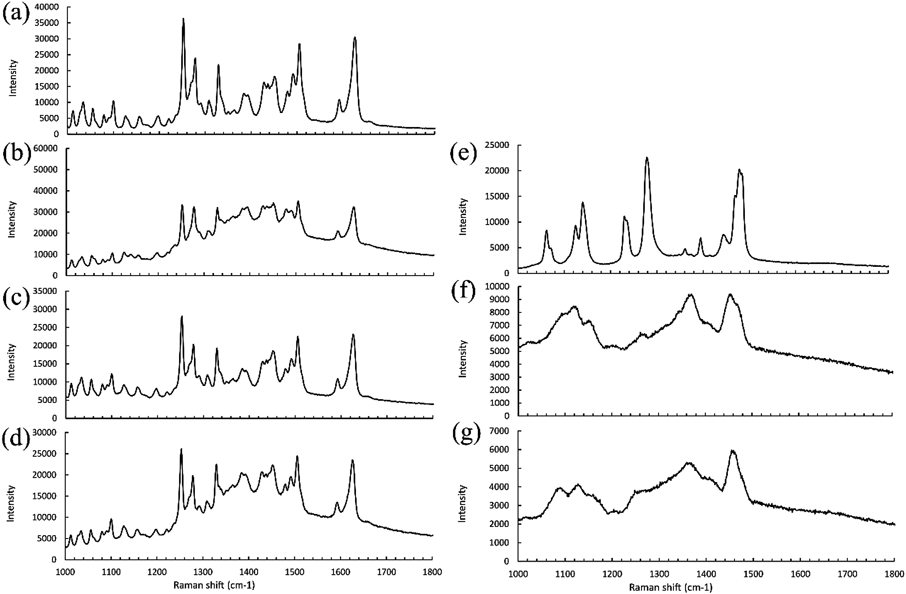
Raman spectra were obtained by Raman microscopy to analyze the white components in the gel layer. As shown in Fig. 7, all white components presented the same spectrum as CLZ, indicating that the white components were undissolved CLZ.
Particle Sizes of Materials Used in the CLZ ModelsParticle sizes are presented in Table 2. The mean particle sizes of PEO, HPMC, and HPC were 133, 90, and 196 µm, respectively.
Table 2. Particle Sizes of Polymers Bulk Powders
| Sample | Mean particle size (μm) |
|---|
| PEO | 133 |
| HPMC | 90 |
| HPC | 196 |
Discussion
The dissolution of base excipients, in addition to APIs, is important information for the development of SRFs, especially those prepared from water-soluble polymer matrices. However, few studies have reported the dissolution of the polymer excipients,14–16) because conventional analytical methods are usually labor-intensive and time-consuming. With an appropriate analytical method, much information can be made available concerning the dissolution behaviors of APIs and polymers to aid formulation design. In our previous study, we developed a rapid method and simultaneous analysis of dissolved APIs and water-soluble polymers in samples from dissolution tests by employing UHPLC using a CAD and PDA detector.17) In this study, three APIs with different solubilities and three versatile extended-release base excipients were used to validate the applicability of the developed analytical method. PRO, RAN, and CLZ are APIs categorized as BCS (Biopharmaceutical Classification System) Class 1, 3, and 2, and their solubilities in water (around 20 °C) are 0.1 g/mL, 1.0 g/mL and 3 μg/mL, respectively.22–24) PEO, HPMC, and HPC were selected as sustained-release base agents. Because the three polymers used in the study were non-ionized, the dissolution of the API and polymers was not affected electrically.
Exposure to water triggers the release of APIs from water-soluble polymer matrix tablets. Such release is controlled by interactions involving water, polymers, and APIs. API release from matrix tablets is classified into two types. The main mechanisms for water-soluble and water-insoluble drugs are diffusion and erosion, respectively.15) The dissolution results clarified differences in the dissolution behaviors of the APIs and water-soluble polymers from the three model tablets.
According to the results of the PEO models (Fig. 1(a)), the release of RAN was fastest among all APIs, and the next was that of PRO. RAN and PRO dissolved easily and diffused in the gel layer because of their high solubility in water. The dissolution of RAN was faster than that of PRO because the rates of diffusion and dissolution were dependent on aqueous solubility. On the other hand, CLZ exhibited slow dissolution due to its low solubility. The release of PEO was slightly slower from PEO CLZ than that from the other models (Fig. 1(b)), indicating that the penetration of water into the tablet containing low-solubility CLZ was slower than that into the tablets containing highly soluble PRO and RAN, and consequently, the erosion of the gel layer was delayed. The similar dissolution profiles of PEO from PEO PRO and PEO RAN suggested that the highly soluble APIs did not affect water penetration into PEO. As indicated in Fig. 1(c), the release of PRO was faster than that of PEO. Similar findings were observed for RAN (Fig. 1(d)). The faster release of the APIs compared to the polymer indicates more rapid diffusion of the APIs in the gel layer. Regarding the comparison of dissolution properties of the APIs and PEO, the difference in the dissolution of RAN and PEO was the greatest, suggesting that RAN was diffused fastest. On the other hand, the dissolution of PEO was slightly more rapid than that of CLZ (Fig. 1(e)), indicating that CLZ was released by the erosion of the gel layer.
Regarding the HPMC formulations, similar to the PEO models, APIs were released according to the rank order of their solubility (Fig. 2(a)). The release of PRO and RAN was diffusion type, and that of CLZ was erosion type (Figs. 2(c), (d), and (e)). It required >24 h for HPMC to be completely dissolved, and thus showed the slowest dissolution rate compared to those of the other polymers. According to Fig. 2 (b), a slight difference was observed in the dissolution of HPMC later than 6 h, with the rank order being PRO model > RAN model > CLZ model. However, this difference was not statistically significant.
With respect to the HPC formulations, the dissolution profiles of the APIs were similar to those observed for other models in which dissolution increased with increasing API solubility (Fig. 3(a)). Similarly, PRO and RAN showed the diffusion type release behavior, and CLZ showed an erosion type (Figs. 3(c), (d), (e)). However, the three formulations exhibited different dissolution profiles compared to HPC from an early stage. The rank order of dissolution was PRO model > RAN model > CLZ model. Dissolution of HPC from the RAN model was delayed compared to that from the PRO model. In contrast to the RAN model, from which RAN is diffused so quickly that the dissolution was completed, PRO was present in the gel layer of the PRO model formulation. The finding suggests that HPC was eroded easily by the decrease in the gel strength of HPC.
As mentioned above, the release behavior of CLZ from the three model tablets was likely the erosion type. The polymer release rate was the same or higher than that of CLZ. Although the same release profiles of the APIs and polymers were initially assumed when the release mechanism was erosion, the dissolution of the polymers was unexpected. The mechanism underlying this result was likely the formation of gel clusters, as pointed out by Kojima et al.14) However, according to the results from photographic observations and component analysis, this was likely due to the aggregation of CLZ in the gel layer. API aggregates were observed only in the model formulations of CLZ (Figs. 4(c), (f), and (i)). The sizes of the aggregates were different, but all of them were larger than the particle size of the CLZ bulk powder (average particle size: 23 µm). The large particle size of the bulk polymer is the reason for the formation of the aggregates. Because CLZ formulations were prepared from polymers with large particle sizes, CLZ was separated from the polymer in a narrow space between the particles in the tablet. After the tablets were introduced into the dissolution medium, large aggregates of CLZ were formed in the gel layer. The surfaces of the aggregates were poorly wettable due to the low solubility,23) resulting in a delayed dissolution of CLZ. This delay in CLZ release may be due to the protracted time for aggregated CLZ to be completely dissolved after release from the gel layer into the dissolution medium. Differences in dissolution between CLZ and the polymers were correlated with the particle sizes of the polymers. The mean particle sizes of PEO, HPMC, and HPC were 133, 90, and 196 µm, respectively, and the dissolution of the polymers from the CLZ formulations at 15 h was 9, 4, and 11% higher than that of CLZ, respectively. According to studies by Shojaee et al. regarding the effect of the particle size of the sustained-release base polymer on API release, it is an important factor in the dissolution of API, because the formation of the gel layer is affected by polymer particle size.25) Additionally, poorly soluble APIs may also affect aggregate formation.
From the results of this study, it was confirmed that our analysis system can be applied to SRFs using various water-soluble polymers, and that the dissolution behavior of APIs and polymers can be determined simultaneously. Additionally, this analytical method allows for an easy clarification of time-dependent changes in the dissolution of polymers and APIs and the mechanisms underlying sustained release (diffusion or erosion).
Conclusion
In this study, the applicability of our previously developed analysis system to other water-soluble polymers, such as high-grade PEO, HPMC, and HPC, was confirmed. This analytical method allows the investigation of the dissolution behavior (diffusion or erosion) of APIs from matrix tablets containing various polymers, and provides useful information concerning release control, making appropriate formulation design and release mechanism analysis easy and efficient. In future studies, this method is expected to be applied to other formulations such as solid dispersions prepared from water-soluble polymers in order to help analyze the release mechanisms involved.
Acknowledgments
We would like to thank Mr. Nishibayashi, Mr. Jinno, Mr. Kiba, and Mr. Yoshimura for giving us the opportunity to carry out this research and Mr. Mizunaga for technical advice.
Conflict of Interest
The authors declare no conflict of interest.
References
- 1) Ratnaparkhi M. P., Gupta J. P., Int. J. Pharma Res. Rev., 2, 11–21 (2013).
- 2) De Robertis S., Bonferoni M. C., Elviri L., Sandri G., Caramella C., Bettini R., Expert Opin. Drug Deliv., 12, 441–453 (2015).
- 3) Ebube N. K., Jones A. B., Int. J. Pharm., 272, 19–27 (2004).
- 4) Kim C. J., J. Pharm. Sci., 84, 303–306 (1995).
- 5) Kim C. J., Drug Dev. Ind. Pharm., 24, 645–651 (1998).
- 6) Kelly S. M., Upadhyay A. K., Mitra A., Narasimhan B., Ind. Eng. Chem. Res., 58, 7428–7437 (2019).
- 7) Ritger P. L., Peppas N. A., J. Control. Release, 5, 23–36 (1987).
- 8) Ritger P. L., Peppas N. A., J. Control. Release, 5, 37–42 (1987).
- 9) Colombo P., Bettini R., Santi P., Peppas N. A., Pharm. Sci. Technol. Today, 3, 198–204 (2000).
- 10) Sako K., Nakashima H., Sawada T., Fukui M., Pharm. Res., 13, 594–598 (1996).
- 11) Huanbutta K., Sriamornsak P., Limmatvapirat S., Luangtana-anan M., Yoshihashi Y., Yonemochi E., Terada K., Nunthanid J., Eur. J. Pharm. Biopharm., 77, 320–326 (2011).
- 12) Mason L. M., Campiñez M. D., Pygall S. R., Burley J. C., Gupta P., Storey D. E., Caraballo I., Melia C. D., Eur. J. Pharm. Biopharm., 94, 485–492 (2015).
- 13) Miller-Chou B. A., Koenig J. L., Prog. Polym. Sci., 28, 1223–1270 (2003).
- 14) Kojima H., Yoshihara K., Sawada T., Kondo H., Sako K., Eur. J. Pharm. Biopharm., 70, 556–562 (2008).
- 15) Chaerunisaa A. Y., Ali R., Dashevskiy A., AAPS PharmSciTech, 20, 142 (2019).
- 16) Ohara T., Kitamura S., Kitagawa T., Terada K., Int. J. Pharm., 302, 95–102 (2005).
- 17) Kimoto M., Sakane T., Katsumi H., Yamamoto A., AAPS PharmSciTech, 22, 262 (2021).
- 18) Jain A. K., Söderlind E., Viridén A., Schug B., Abrahamsson B., Knopke C., Tajarobi F., Blume H., Anschütz M., Welinder A., Richardson S., Nagel S., Abrahmsén-Alami S., Weitschies W., J. Control. Release, 187, 50–58 (2014).
- 19) FDA Guidance for industry, “Immediate release solid oral dosage forms scale-up and post-approval changes: Chemistry, manufacturing, and controls, in vitro dissolution testing, and in vivo bioequivalence documentation.”: ‹https://www.fda.gov/regulatory-information/search-fda-guidance-documents/supac-ir-immediate-release-solid-oral-dosage-forms-scale-and-post-approval-changes-chemistry›, cited 1 November, 1995.
- 20) FDA Guidance for industry, “SUPAC MR: Modified release solid oral dosage forms: Scale-up and post-approval changes: Chemistry, manufacturing and controls, in vitro dissolution testing, and in vivo bioequivalence.”: ‹https://www.fda.gov/regulatory-information/search-fda-guidance-documents/supac-mr-modified-release-solid-oral-dosage-forms-scale-and-postapproval-changes-chemistry›, cited 6 October, 1997.
- 21) FDA Guidance for industry, “Dissolution Testing of Immediate Release Solid Oral Dosage Forms.”: ‹https://www. fda.gov/regulatory-information/search-fda-guidance-documents/dissolution-testing-immediate-release-solid-oral-dosage-forms›, cited 25 August, 1997.
- 22) delMoral-Sanchez J. M., Gonzalez-Alvarez I., Gonzalez-Alvarez M., Navarro A., Bermejo M., Pharmaceutics, 11, 567 (2019).
- 23) Shimizu T., Osumi T., Niimi K., Nakagawa K., Arzneimittelforschung, 35 (7A), 1117–1123 (1985).
- 24) “The United States Pharmacopeia and The National Formulary,” 42th ed. (USP42-NF37), United States Pharmacopeial Convention, Rockville, MD, 2019, pp. 6257, 6259.
- 25) Shojaee S., Emami P., Mahmood A., Rowaiye Y., Dukulay A., Kaialy W., Cumming I., Nokhodchi A., AAPS PharmSciTech, 16, 1281–1289 (2015).