Notes
LC-MS/MS Assay for the Measurement of Cannabidiol Profiling in CBD Oil from Japanese Market and Application for Convertible Tetrahydrocannabinol in Acetic Acid Condition
2022 年 70 巻 2 号 p. 169-174
詳細
2022 年 70 巻 2 号 p. 169-174
Cannabidiol (CBD), a major non-psychoactive cannabinoid, has a lot of attention due to its potential relaxing properties and led the trend in commercial CBD aroma/oral hemp seed oil from the Japanese market. In this study, a routine assay for evaluating CBD oil samples was performed using LC coupled with tandem mass spectrometry (LC-MS/MS) and was used to apply the convertible tetrahydrocannabinol (THC) in acetic acid conditions. Based on the electrospray positive ion mode, the detection of cannabidiolic acid (CBDA; m/z 359 > 219), cannabigerolic acid (CBGA; m/z 361 > 343), cannabigerol (CBG; m/z 317 > 193), CBD (m/z 315 > 193), THC (m/z 315 > 193) and cannabinol (CBN; m/z 311 > 223) was performed by satisfying separation with high density of C18 column. Oil samples (50 mg) were diluted with isopropanol (5 mL), to which stable isotope internal standards were added by dilution with methanol/water (50/50), and accuracy rates ranged from 97.8 to 102.2%. This method was used to evaluate the CBD oil products (5 kinds) from the Japanese market. Our survey found obvious counterfeit (non-detectable CBD) CBD oil from Japanese market. Following that, we investigated the conversion of THC in CBD oil samples in simple conditions such as 10% acetic acid and 70 °C for 6 h and discovered that converts THC proportions are approximately 5% ((THC content/CBD content) × 100) and <1.0%. Thus, our developed LC-MS/MS assay could be applied to monitor the CBD concentration and convertible THC from CBD oil.
Recently, the fashioning trends of cannabis (Cannabis sativa L.), specifically cannabidiol (CBD), containing natural health cosmetics and supplements in Asia-Pacific (Japan, Australia and New Zealand) markets from increasing import growth.1) On the other hand, in Japanese markets, CBD-containing products are not widely available in general stores. However, specific/internet retailers selling natural health cosmetics also do business in various aspects of CBD products, such as hemp seed oil and related items advertised to help with anxiety, relaxation, restful sleeping, and anti-aging. CBD products have been appeared to be imported from the United States and other countries. In addition, the presence of the psychoactive/illegal tetrahydrocannabinol (THC) and impurity from these products have been assessed before being available to the market in Japan.2) However, in terms of important conditions, ingredients, and storage period from common markets, it has remained insufficient that this quality evaluation of THC and/or impurity is recognized in circulated CBD products. As a result, we should investigate the possibility of impurity-containing products under a variety of conditions, including additive interaction, acid-catalyzed reaction, and unknown phenomenon. Thus, it is needed to develop the useful and simple assay for the evaluation of CBD products in Japanese markets.
The cyclization reaction of CBD seems to occur following an acid-catalyzed activation of a specific double bond.3,4) The main products of this cyclization are Δ9-THC (trans-Δ9-tetrahydrocannabinol) and Δ8-THC (trans-Δ8-tetrahydrocannabinol). Recently, Marzullo et al. investigated the susceptibility and selectivity of CBD cyclization, different reactions, including the use of Lewis and protic acids in different solvents and varying the temperature and reaction time, concluded that CBD is a difficult substrate to exploit the chemical reactivity of natural alkenes and phenols.5) Pratap Singh et al. reported that acidic cannabinoids decarboxylation kinetics in hemp seed oil based on various antioxidants.6) Moreover, Kiselak et al. investigated to utilize a weaker acid, such as vinegar (5.4% acetic acid) to isomerize CBD to Δ9-THC, Δ8-THC, and other impurity chemicals from original simulated-foods.7) Unfortunately, it is impossible to obtain the useful, veridical, and reliable information about impurity-containing CBD oil from potential conditions such as coexistence in these conditions regarding to Japanese markets. Thus, we examined a LC-tandem mass spectrometry (LC-MS/MS) assay to assess the quality evaluation of CBD and cannabinoids profiles in hemp seed oil products from Japanese markets, as well as apply convertible THC in acetic acid conditions. The most frequently reported generic methods are applied with chromatographic separation such as LC-MS/MS for screening assay of CBD and other cannabinoids in various products.8–12) In this study, we used the previous LC-MS/MS assay to measure CBD, THC, and other cannabinoids in hemp seed oil products.13)
Δ9-THC (1.0 mg/mL) was obtained from Sigma-Aldrich Co. (St. Louis, MO. U.S.A.). CBD (1.0 mg/mL), cannabinol (CBN) (1.0 mg/mL), cannabigerol (CBG) (1.0 mg/mL), cannabidiolic acid (CBDA) (1.0 mg/mL), cannabigerolic acid (CBGA) (1.0 mg/mL), CBD-d3 (100 µg/mL), and Δ9-THCA-d3 (100 µg/mL) were obtained from Cerilliant (St. Texas, TX. U.S.A.). FUJIFILM Wako Pure Chemical Corporation (Osaka, Japan) provided methanol, acetonitrile, isopropanol, acetic acid, and formic acid. The mobile phase was purified water, and sample preparation was accomplished using a PURELAB Flex 5 system (ELGA, U.K.). Methanol was used to adjust a stock solution of analytes (50 µg/mL), which was then stored at −80 °C. In 2021, CBD products were purchased from the Japanese market (via online shopping).
LC-MS/MS Instrument and ConditionThe LC system was a Waters Acquity H Class Plus (Waters Co., Milford, MA, U.S.A.). An RP analysis was performed via an Inertsil ODS-HL column (3 µm, 2.1 × 150 mm, GL Sciences, Inc., Tokyo, Japan) at 40 °C. For the optimal separation, the TSKgel ODS-100V (3 µm, 2.0 × 150 mm, Tosoh Co., Tokyo, Japan), InerSustain AQ-C18 (1.9 µm, 2.1 × 150 mm, GL Sciences, Inc.), TSKgel ODS-120H (3 µm, 2.0 × 150 mm, Tosoh Co.), Acquity UPLC BEH C18 (1.7 µm, 2.1 × 150 mm, Waters, MA, U.S.A.), TSKgel ODS-100Z (3 µm, 2.0 × 150 mm, Tosoh Co.) and Atlantis T3 (3 µm, 2.1 × 150 mm, Waters) were used. The injection volume was set at 5 µL. The mobile phase was delivered at a flow rate of 0.2 mL/min and consisted of solvent A (0.1% formic acid in water) and solvent B (0.1% formic acid in acetonitrile). The linear gradient elution was as follows: 75% solvent B at 0 min, 75% solvent B at 9 min, 98% solvent B at 9 min, 98% solvent B at 19 min, 75% solvent B at 19.1 min, and 75% solvent B at 25 min. A Waters Xevo TQD triple quadrupole mass spectrometer was operated with an electrospray ionization (ESI) source in the positive mode. The following ionization source conditions were used: capillary voltage of 2.0 kV; extractor voltage of 3 V; RF lens voltage of 2.5 V; cone voltage of 15–40 V; collision energy of 15–30 eV; source temperature of 150 °C and desolvation temperature of 400 °C. The cone and desolvation gas flows were 50 and 800 L/h, respectively, which were obtained using a nitrogen source (N2 Supplier Model 24S, Anest Iwata Co., Yokohama, Japan).
Accuracy and PrecisionOlive oil (0.05 g) samples were diluted by adding 5 mL of isopropanol. Then, 1.0 mL was diluted by adding water/methanol (1000 times dilution), added with 100 µL of a mixed internal standard (detected level of 10 ng/mL) and 1 mL of mixed standard solution (detected level of 500 ng/mL). The accuracy value was defined as follows: F/(F0 + A) × 100 (%), where F and F0 are the concentrations of the analytes in the spiked and unspiked samples, respectively, and A is the spiked concentration. Using olive oil, it is the F0 = 0. For the precision, the same procedure was repeated for intra-day (three replicates for one day, n = 3 for standard deviation, ±S.D., %).
Application for Convertible THC in Acetic Acid ConditionThe 0.1 mL of acetic acid was added into CBD oil (1.0 g) samples, and the sample was heated to 70 °C on a heat block for 6 h. After that, 50 mg of samples were diluted with 5 mL of isopropanol. The 1.0 mL was diluted 1000 times with water/methanol before being mixed with 20 µL of a mixed internal standard (detected level of 100 ng/mL) for LC-MS/MS assay.
Quantitative ProcedureFixed concentrations of the standard solutions (LOQ – 1000 ng/mL) were prepared by sequential dilutions of the stock solutions. The LOD and LOQ values were evaluated based on the signal-to-noise ratio (S/N) obtained while detecting the concentration of analytes and indicated S/N = 3 and S/N > 10. The calibration curves were built from eleven different concentrations to assess the linearity at each concentration level by plotting the peak-area ratio of the standard solutions: internal standard (y) vs. each concentration of the adjusted standard solution (x) (curve typesetting; linear, origin: exclude, weighting: 1/x, axis: none).
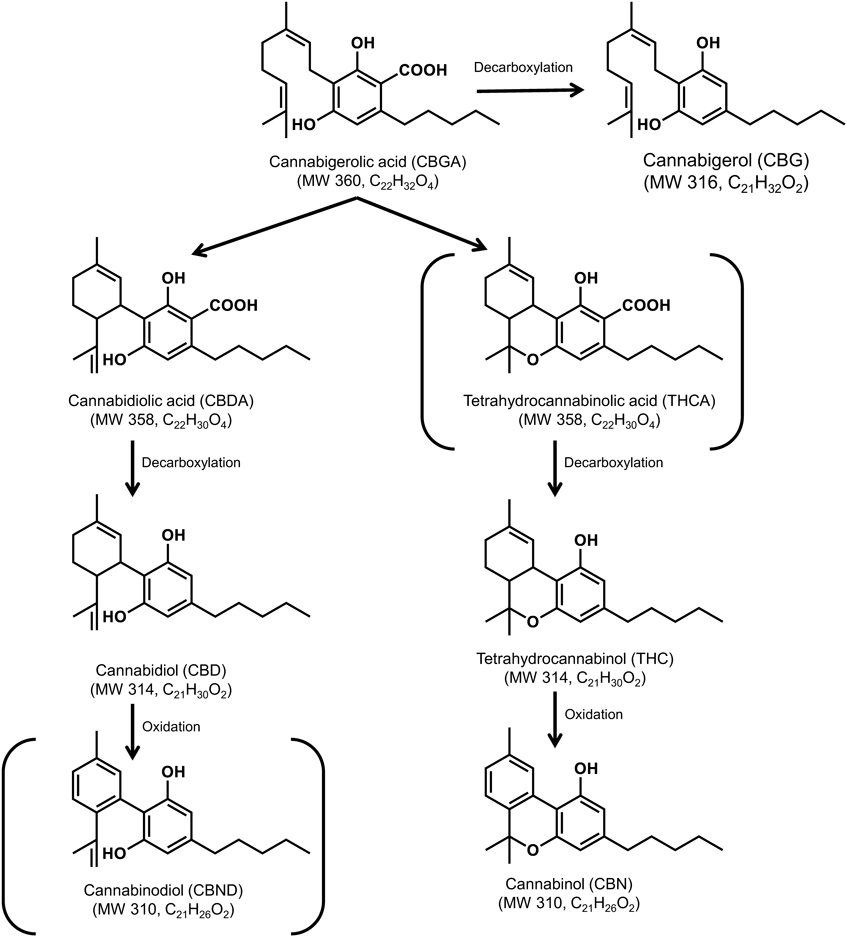
In this study, the targeted CBD profiling was shown in Fig. 1 and selected 6 chemicals. In this profiling, the psychoactive/illegal cannabinoids are THC and THCA in Japan. According to drug law, the THC standard solution was legally obtained from the imported U.S.A. However, due to a procedural issue that is monitored to the SRM with the same molecule weight of CBDA (m/z 359 > 219), we are unable to obtain the THCA standard in the study.11) In addition, the minor oxidized CBD (CBND) standard was not obtained from common route and monitored to the SRM with the same molecule weight of CBN (m/z 311 > 223). Supplementary Table S1 shows the MS conditions such as monitoring ion, cone voltage, and collision energy. Following that, it was determined that the resolution in SRM chromatograms of CBG (m/z 317 > 193), CBD (m/z 315 > 193), and THC (m/z 315 > 193) should be examined using RP columns. Specifically, these resolution values (Rs) of CBG/CBD are performed such as TSKgel ODS-100 V (Rs = 0.41), InerSustain AQ-C18 (Rs = 0.60), TSKgel ODS-120H (Rs = 0.70), Acquity UPLC BEH C18 (Rs = 0.86), TSKgel ODS-100Z (Rs = 1.33), Atlantis T3 (Rs = 1.49) and Inertsil ODS-HL (Rs = 1.56), respectively. As a result of this study, the Inertsil ODS-HL column was found to be a valid and feasible column for LC-MS/MS analysis of CBD profiling. Figures 2-a)–f) and Supplementary Table S1 shows the SRM chromatograms and quantitative performance.
Non-targeted chemicals are shown in parentheses.
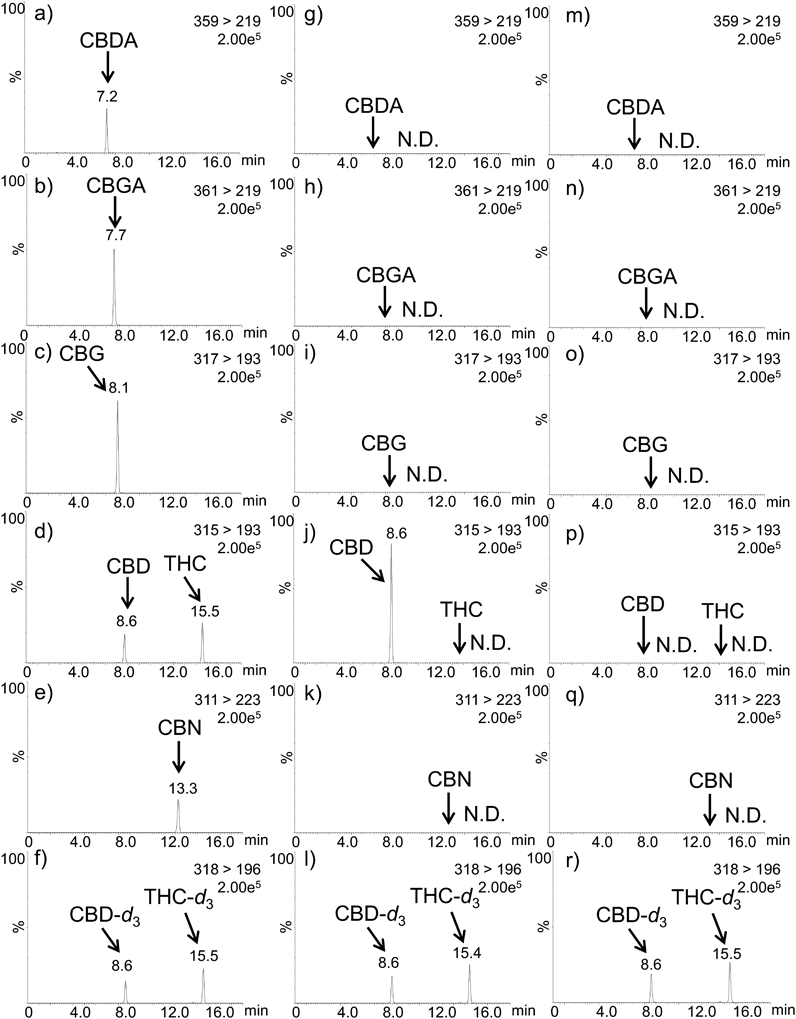
a)–f) Standard solution (125 ng/mL). g)–l) CBD oil (No. 1). m)–r) CBD oil (No. 5).
For the validation test, the standard solutions were spiked in an olive oil sample (n = 3). The spiked olive oils were pretreated and subjected to internal standard and absolute calibrations (Table 1). These accuracy and precision values were also presented in our previous report.13) In addition, a similar preparation using isopropanol revealed that the accuracy values of CBD, THC, and CBN in olive oil ranged from 92.2 to 108.7%.14) Secondly, the labeled CBD oil (65.6 mg/g) was analyzed that the detectable level of CBD (57.8 mg/g, 88.1%) was evaluated. Using this procedure, these CBD oil samples (n = 5) from Japanese markets were evaluated (Table 2). Figures 2-g)–l) and m)–r) show typical SRM chromatograms of CBD oils (Nos. 1 and 5). CBDA, CBGA, CBG, THC, and CBN were not detected, and CBD was not found in one sample (No. 5) with the default label. According to the previous report, it is critical to monitor improper CBD labeling through routine assays.15)
| Accuracy ± S.D. (%) | ||
|---|---|---|
| Analytes | Stable isotope calibration | Absolute calibration |
| CBDA | 99.7 ± 2.4 | 100.1 ± 3.4 |
| CBGA | 99.6 ± 2.3 | 100.2 ± 1.5 |
| CBG | 100.3 ± 2.7 | 102.2 ± 1.2 |
| CBD | 99.9 ± 7.1 | 98.2 ± 2.0 |
| THC | 99.7 ± 3.2 | 101.0 ± 0.8 |
| CBN | 99.1 ± 5.8 | 97.8 ± 3.4 |
For the precision, the same procedure was repeated for intra-day (three replicates for one day, n = 3 for standard deviation, ±S.D., %).
| Sample No. | Labeled value of CBD (mg/g) | Detectable value of CBD (mg/g) |
|---|---|---|
| 1 | 72.1 | 60.6 |
| 2 | 55.6 | 43.9 |
| 3 | 76.5 | 66.0 |
| 4 | 65.6 | 57.8 |
| 5 | 32.8 | N.D. (<2.0) |
Based on Japanese cannabis control law, it is illicit hemp that the THC is detected in CBD oil.16) Thus, our developed LC-MS/MS assay is needed to indicate the application of detectable THC in CBD oil for the quality control. Since the 1940 s, it has been studied in a chemical reaction that converts CBD to THC that acid would catalyze a chemical change of partial CBD to other cannabinoids.17) Subsequently, it is indicated that CBD would convert to Δ9-THC, Δ8-THC, and CBN when adding acid to the CBD in a chemical reaction with H2SO4 or BF3.3,4) Kiselak et al. reported whether a weaker acid, such as vinegar (5.4% acetic acid) could be used to convert CBD to THC from original simulated-foods.7) In the application for chromatographic detection of THC, we look at this conversion with simple acetic acid in CBD oil samples (No. 1–4) from Japanese market. First, the LC-MS/MS method was used to determine the optimal conditions for convertible THC from CBD standard (detectable 750 ng/mL) based on acetic acid and temperature. In this result, a higher concentration of acetic acid and temperature offered the conversion of THC (Figs. 3-a)–c)). Thus, the useful and simple condition such as 10% acetic acid and 70 °C for 6 h was performed to monitor convertible THC from CBD oil. This result showed that two patterns of convertible THC are about 5% ((THC content/CBD content) × 100, 4.6% for No. 2 and 6.6% for No. 3) and <1.0% (0.5% for No. 1 and 1.3% for No. 4). In addition, convertible THC from CBD oil was not detected in room temperatures for several hours. Figures 3-d), e) shows typical SRM chromatograms (m/z 315 > 193 for analytes and m/z 318 > 196 for internal standard) of CBD oil (No. 2) at room or high temperature (70 °C) for 6 h. Positively, standard matching estimates the peak (retention time; 15.4 min) at Δ9-THC. In addition, the developed LC-MS/MS assay could separate Δ9-THC and Δ8-THC (retention time; 15.9 min). Furthermore, based on the previous report regarding retention times and MS/MS fragmentation compared with CBD, these peaks (retention time; 5.2 min and 6.1 min) are expected of 11-5″-dihydroxy-CBD (m/z 315 > 193) and 8-OH-iso-cannabicyclohexanol (m/z 315 > 193).7) These contents were stable in the presence of acetic acid in CBD oil for several days. The minuscule quantities of convertible THC and other cannabinoids could be separated and detected in CBD oil using developed LC-MS/MS assay. We advise that this reaction of convertible THC from CBD oil is inefficient and impurity process for abusable use. However, it is possible using LC-MS/MS assay to occur a tough decision of THC content in deteriorated CBD oil and/or various products included with food materials/additives based on the criterion value such as “not detectable THC in CBD products.”
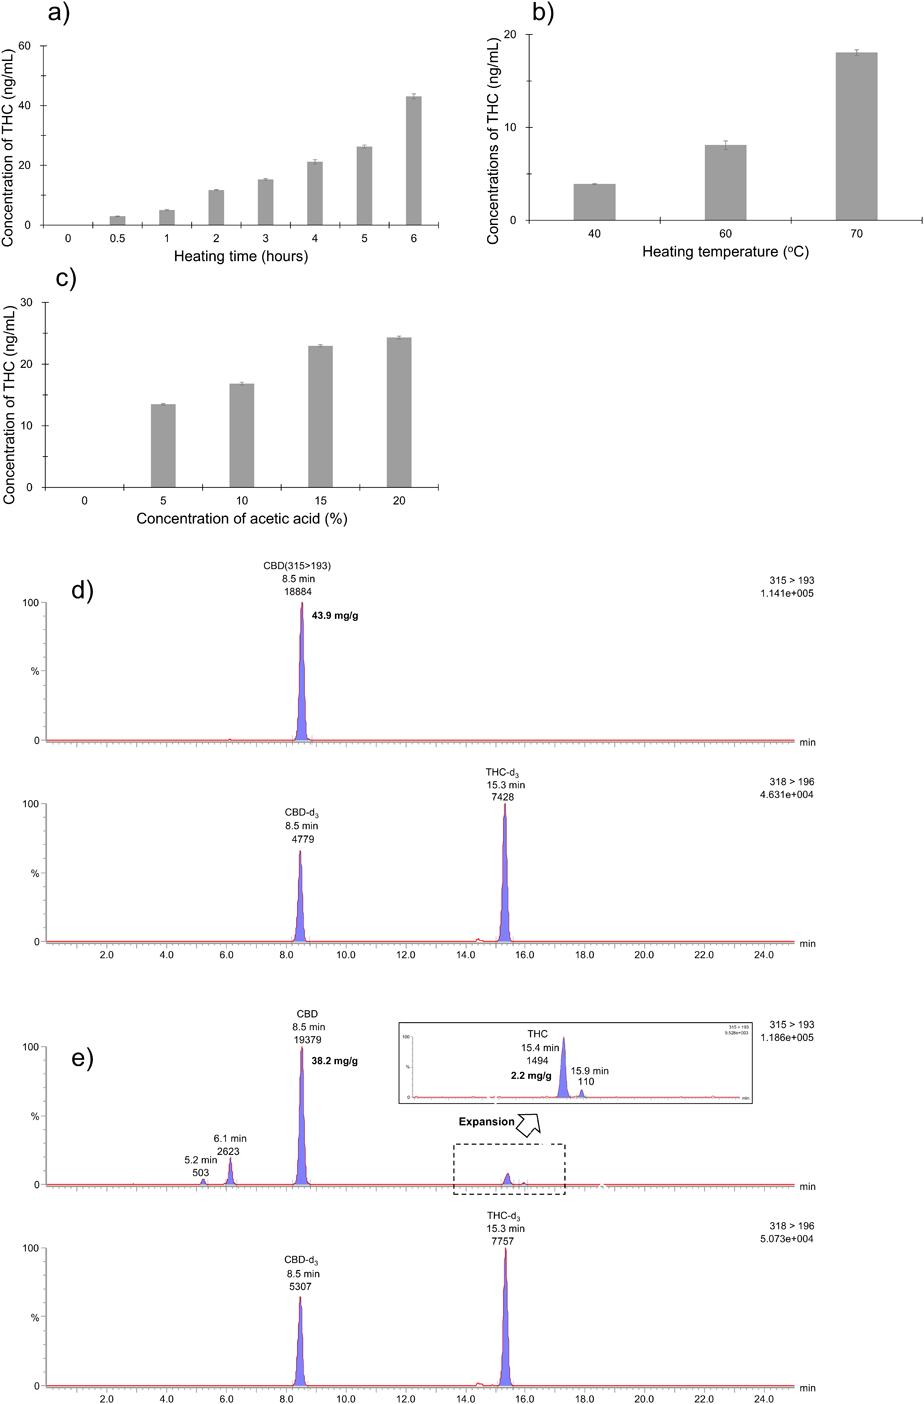
a) Investigation of heating time for convertible THC (three replicates for one day). b) Investigation of heating temperature for convertible THC (three replicates for one day). c) Investigation of acetic acid for convertible THC (three replicates for one day). d) SRM chromatograms (upper m/z 315 > 193 for analytes and lower m/z 318 > 196 for IS) of CBD oil (No. 2) with 10% acetic acid at room temperature for 6 h. e) SRM chromatograms (upper m/z 315 > 193 for analytes and lower m/z 318 > 196 for IS) of CBD oil (No. 2) with 10% acetic acid at high temperature (70 °C) for 6 h.
The LC-MS/MS assay was performed for the measurement of cannabidiol profiling in CBD oil from the Japanese market and applied for the evaluation of CBD oil and convertible THC in acetic acid conditions. For the market survey of CBD oil, our result showed that the CBD oil contained with none of CBD is found in Japanese market. Besides, there may be no or rare case of THC content in CBD oil from Japanese market. In addition, we indicated that the minuscule quantities of convertible THC and other cannabinoids from CBD oil in acetic acid and high temperature could be separated and detected using developed LC-MS/MS assay. Future analytical research should show the useful evaluation for regulatory discussion of the quality control of CBD oil and/or various products in Japanese market.
The authors declare no conflict of interest.
This article contains supplementary materials.