Regular Articles
Characterization of Novel Paclitaxel Nanoparticles Prepared by Laser Irradiation
2022 年 70 巻 4 号 p. 269-276
詳細
2022 年 70 巻 4 号 p. 269-276
The antitumor drug paclitaxel has low water solubility, and its bioavailability is limited by the dissolution rate. To overcome this low water solubility, the currently marketed drug, Taxol, is formulated in a vehicle including Cremophor EL and ethanol mixture (1/1, v/v). However, Cremophor EL has been shown to have serious adverse side effects, such as hypersensitivity reactions and neurotoxicity. Improving the solubility of paclitaxel makes it possible to reduce side effects and enhance drug efficacy during antitumor therapy. One way to improve the solubility of poorly soluble drugs is to decrease their particle size to the nano-range to increase the surface area and dissolution rate. In the present study, we aimed to develop a new method for paclitaxel nanoparticle production. Polymeric nanoparticles of paclitaxel were prepared by laser irradiation at 1064 nm, which is the wavelength in the near-IR region. The prepared nanoparticles had a mean size of 57.9 nm and were spherical in shape. X-ray powder diffraction analysis showed that paclitaxel in the nanoparticles was in an amorphous state. These results demonstrate that the preparation of nanoparticles by laser irradiation is effective in improving the solubility of paclitaxel. Furthermore, the nanoparticles had an equivalent efficacy to Taxol in cell growth inhibition against breast cancer MCF-7 cells and drug efficacy in MCF-7 tumor-bearing mice as determined using positron emission tomography. Our method for preparing paclitaxel nanoparticles may be more effective in treating tumors with fewer adverse side effects than conventional Taxol.
Paclitaxel is an antitumor agent extracted from the bark of the Pacific yew tree1) and has been used clinically for the treatment of a variety of tumors, such as ovarian, breast, and non-small lung carcinoma.2) The antitumor action of paclitaxel is due to the inhibition of cellular growth through the promotion and stabilization of the microtubule assembly by non-covalent interaction with tubulin.3) Additionally, paclitaxel induces tumor cell apoptosis by accelerating the production of reactive oxygen species and hydrogen peroxide.4,5) Paclitaxel is highly hydrophobic, and previous reports have shown an aqueous solubility of less than 0.01 mg/mL.6) To overcome its low water solubility, the commercial formulation Taxol is formulated in a vehicle including Cremophor EL (polyoxyethylated castor oil derivatives) and ethanol mixture (1/1, v/v), and is primarily administered intravenously. However, Cremophor EL has been shown to have serious adverse side effects, including hypersensitivity reactions, neurotoxicity, nephrotoxicity, and hypotensive vasodilation.7–9) In clinical therapy, high doses of antihistamines and glucocorticoids must be co-administered, and longer infusion times are required to avoid these adverse side effects.10,11)
Nanoparticle formulations are known to increase the solubility and bioavailability of drugs with low water solubility.12) Reducing the particle size to the nano-range facilitates dissolution of compounds in water by increasing the specific surface area and dissolution rates according to the Noyes–Whitney equation.13) Various nanoparticle formulations of paclitaxel have been developed. Albumin-bound paclitaxel nanoparticles (nab-paclitaxel, Abraxane) were the first nanoparticle formulation approved by the U.S. Food and Drug Administration.14) In addition, polymeric micelles (Cynviloq, Paclical) have been launched in some countries.15) Moreover, peptide-conjugated nanoparticles (ANG1005),16) liposome formulation (LEP-ETU)17) and polymeric micelles (Paxceed)18) have been used in clinical trials. However, long-term toxicity and survival remain unclear, and these drugs are expensive; therefore, alternative paclitaxel formulations are still in demand.19) Various methods have been used for the preparation of drug nanoparticles, such as solvent evaporation, nanoprecipitation, dialysis, high-pressure homogenization, and media milling.20) Among them, media milling is the most practical method because the equipment has been developed up to the production scale.
The purpose of this study was to develop a novel method for the preparation of paclitaxel nanoparticles. Previously, we reported a cyclosporin nanoparticle formulation technique using laser irradiation.21) This method uses a pulsed laser at wavelengths in the near-IR region. Energy from the laser was used to produce small particles from the bulk materials. As we used IR light at 1064 nm, which is poorly absorbed by most organic compounds, drugs were assumed not to be degenerated. In this study, we applied this method to prepare paclitaxel nanoparticles. For paclitaxel nanoparticles prepared by this laser irradiation, their physical properties were characterized, and their drug efficacy was evaluated using in vitro cell imaging and in vivo animal imaging with positron emission tomography (PET).
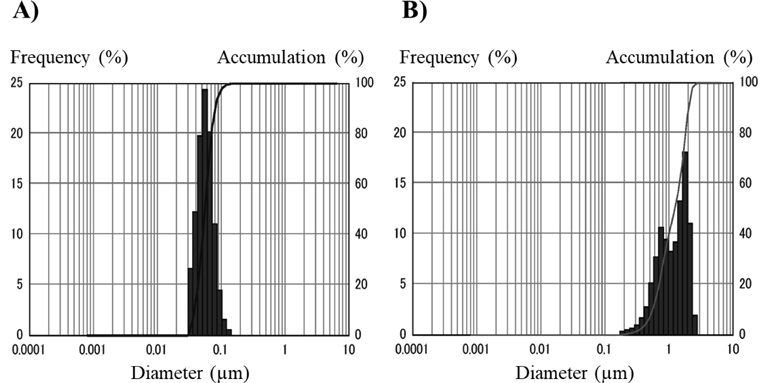
We first compared the properties of paclitaxel nanoparticles prepared by laser irradiation (laser-NPs) with those of nanoparticles prepared by the conventional wet milling method (milling-NPs), which has generally been used for nanoparticle formulation. The dispersion of laser-NPs was clear and homogeneous, whereas that of the milling-NPs was uniformly cloudy. The amount of paclitaxel in laser-NPs was quantified by HPLC analysis, showing a sharp and symmetric peak for paclitaxel (data not shown). The average concentration of paclitaxel in laser-NPs was 9.14 mg/mL, and that in milling-NPs was 7.35 mg/mL (n = 3). Scanning eletron microscope (SEM) images of the laser-NPs and milling-NPs are shown in Fig. 1. The laser-NPs appeared to be spherical and uniform in size. On the other hand, milling-NPs existed predominantly in needle shapes. The particle sizes of the paclitaxel nanoparticles measured by dynamic light scattering are shown in Fig. 2. The laser-NP particles had a mean diameter of 57.9 nm ranging from 40 to 150 nm. These results were in agreement with the SEM images (Fig. 1). When wet milling was used, the nanoparticles had a mean diameter of 1250 nm, ranging from 200 to 3000 nm. However, in the SEM images, there were few microparticles, and the nanoparticles were agglomerated. It was conjectured that the particle size distribution displayed larger sizes that were not representative of what existed in actuality. In comparison with the characteristics of milling-NPs, laser-NPs had a small diameter, narrow distribution, and uniform spherical shapes. When we used different kinds of additive agents and changed the volume of zirconium balls or grinding time, the size of the milling-NPs was not altered. In addition, the shape of the milling-NPs remained predominantly needle-or plate-like (Fig. 1B). These results indicate that the wet milling process is significantly different from the laser irradiation process, and the laser method can prepare smaller nanoparticles. These differences may be attributed to the starting materials. The components of the starting materials used in the laser irradiation method were mixed homogeneously, whereas in the wet milling method, the drug components remained in their bulk states. Therefore, the frequency of milling ball impacts with paclitaxel could also be non-uniform, and the milling-NPs would show inhomogeneous shapes. In addition, it seemed that drug and additive agents for laser-NPs were dissolved from the drug-additive mixture by laser irradiation and formed spherical nanoparticles that were in a thermodynamically stable state,21) although evidence for this is still lacking.
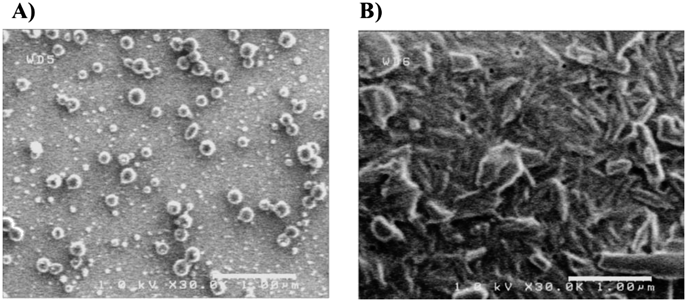
Scale bar is 1 µm.
The physical states of the nanoparticles were examined using XRPD (Fig. 3). In intact paclitaxel, characteristic high-intensity diffraction peaks were detected at 2θ = 5.6, 9.0, 12.3 (Fig. 3A). In physical mixture (PM), characteristic high-intensity diffraction peaks were detected at 2θ = 4.6, 5.6, 9.0, 11.5, and 21.0° (Fig. 3B). The diffraction angles observed in PM were in good agreement with those observed for the drug and additive agent crystals. Broad diffuse diffraction patterns were observed in the laser-NPs (Fig. 3C). Peaks derived from crystalline paclitaxel appeared to be absent in the laser-NPs. In milling-NPs, the diffraction patterns were slightly diffused and characteristic peaks were detected at 2θ = 5.5, 11.5, 21.3 (Fig. 3D). These results show that the degree of crystallinity of paclitaxel was reduced in the nanoparticles. These results suggest that a part of the drug in milling-NPs and all the drugs in the laser-NPs existed in amorphous states.
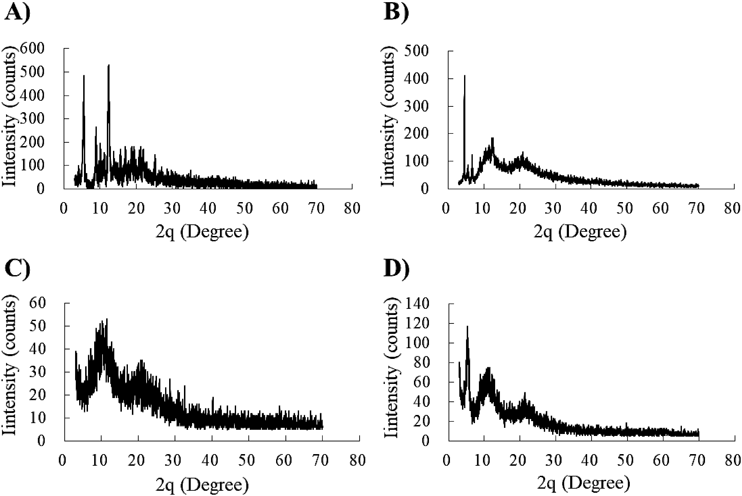
Paclitaxel alone (A), PM (B), laser-NPs (C), and milling-NPs (D).
The results of paclitaxel release profiles from PM, laser-NPs, and milling-NPs are shown in Fig. 4. Ninety percent of the paclitaxel was released from laser-NPs over a 15-min period, whereas the same amount of paclitaxel was released from milling-NPs over a 60 min period. Only 60% of paclitaxel was released from the PM over a 180-min period. The initial release rate of paclitaxel from laser-NPs was the highest. This result shows that the solubility of paclitaxel was significantly improved, and that the laser irradiation method was more effective in improving solubility than the wet milling method. The release profile study showed that the cumulative release of paclitaxel from laser-NPs and milling-NPs was dramatically increased compared to that of the PM. This result can be attributed to the particle size. Reducing the particle size of paclitaxel to the nanoscale increases solubility by increasing the specific surface area and dissolution rates, according to the Noyes–Whitney equation.13) Paclitaxel was released more rapidly from laser-NPs than from milling-NPs. It was thought that the rate of dissolution was influenced not only by particle size, but also by the state of crystallinity. An amorphous drug has a higher water solubility than a crystalline drug because the amorphous form requires less energy to break up the crystal lattice during the dissolution process.22) Some parts, but not all, of the crystalline structures were included in the milling-NPs, so these nanoparticles showed a slower dissolution release rate than laser-NPs.

Each point represents the mean ± standard deviation (n = 3).
We showed that nanoparticle preparation by laser irradiation was more effective in improving the solubility of paclitaxel than wet milling. We performed an in vitro study to confirm whether laser-NPs maintained its pharmacological activity.
Paclitaxel induces cell death by binding to tubulin and stabilizing the microtubule spindle. To examine whether laser-NPs have such pharmacological effects, we performed a transient transfection of pTagRFP-tubulin and compared the microtubule dynamics of TagRFP-tubulin-expressing cells after exposure to Taxol and laser-NPs. Some cells did not express TagRFP-tubulin in the field of view, because of low gene expression efficiency and diminishment of the expression of the transgene over time. However, the microtubules of these cells were also thought to have changed morphologically. Before treatment with Taxol or laser-NPs, microtubules showed a network structure (Fig. 5). After 2 h of Taxol or laser-NP treatment, the structure of the microtubules began to change. After 5 h of treatment, microtubules were completely aggregated to form a fibrous structure under both conditions. This morphological change was due to the effects of paclitaxel in these formulations. Laser-NPs affected the microtubule structure in the same manner as Taxol, indicating that paclitaxel in laser-NPs retained the pharmacological activity of paclitaxel.
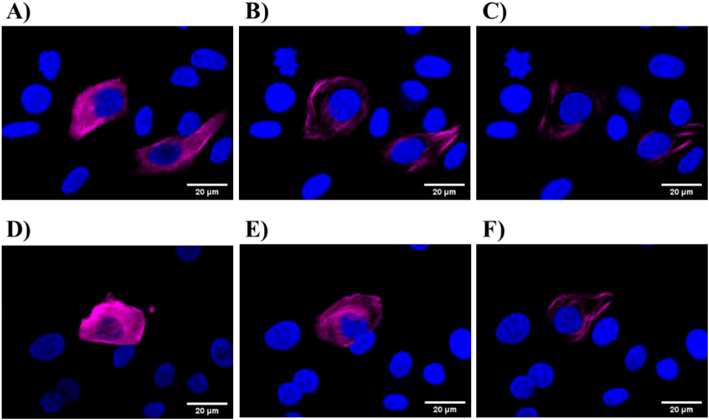
Cells were treated with Taxol (B and C) laser-NPs (E and F) for 2 h (B and E) and 5 h (C and F), respectively. The scale bar corresponds to 20 µm.
Furthermore, the pharmacological activity of laser-NPs was quantitatively measured by the 3-(4,5-dimethylthiazol-2-yl)-2, 5-diphenyltetrazolium bromide (MTT) assay. Figure 6 shows the in vitro viability of MCF-7 cells treated with Taxol, laser-NPs, and the corresponding vehicles. Taxol and laser NPs showed dose-dependent cytotoxicity in MCF-7 cells (Fig. 6A). Taxol showed a higher cytotoxicity than laser-NPs at lower paclitaxel concentration (0.01–1 nM). At higher concentrations (10–1000 nM), both drugs exhibited similar levels of cytotoxicity. Subsequently, we evaluated the toxicities of the vehicles of Taxol and laser-NPs alone, without paclitaxel. The vehicle of Taxol (Cremophor EL (CreEL)/ethanol (EtOH) mixture [1/1, v/v]) showed dose-dependent cytotoxicity. Moreover, the vehicle had a marked effect on cytotoxicity similar to that of Taxol, ranging from 1 to 1000 nM. Conversely, the vehicle of laser-NPs (aqueous solution of PVP K30 and SDS [5/0.2, v/v]) exhibited low toxicity to MCF-7 cells (Fig. 6B). These results indicated that part of the Taxol toxicity was caused by the vehicle CreEL and EtOH. However, the toxicity of laser-NPs may be attributed to the paclitaxel present in the nanoparticles.

Each point represents the mean ± standard deviation (n = 5).
We evaluated the in vivo antitumor efficacy of Taxol and laser-NPs in MCF-7 tumor-bearing mice. These formulations (2, 6, and 20 mg/kg) and saline were administered to mice via the tail vein once a week for 3 weeks (day-0, 7, and 14). As shown in Fig. 7, the relative tumor volumes in the saline group increased rapidly and reached 1000% on day-21. In contrast, groups receiving Taxol and laser-NPs at 20 mg/kg significantly delayed tumor growth compared to the corresponding saline group (p < 0.05). Groups receiving Taxol and laser-NPs at 2 and 6 mg/kg tended to slow, but not significantly, growth of tumor size compared to the corresponding saline group. There was no significant difference in the relative tumor volume between the Taxol and laser-NP treatments at the same dose (p > 0.05). This result showed that dose-dependent inhibition of tumor growth induced by Taxol and laser-NPs was observed in MCF-7 tumor-bearing mice. As a result of tumor size measurement over 21 d, it was confirmed that laser-NPs have antitumor activity resembling Taxol. To evaluate the adverse side effects of drug administration, we compared body weight changes in mice treated with high doses (20 mg/kg) of Taxol, laser-NPs, and saline. As shown in Fig. 8, there were no significant differences in body weight changes among these mice. However, mice treated with Taxol showed clinical symptoms such as crouching and dyspnea, while mice treated with laser-NPs did not have such symptoms. This result demonstrated a superiority of laser-NPs to Taxol even from the viewpoint of adverse effects.
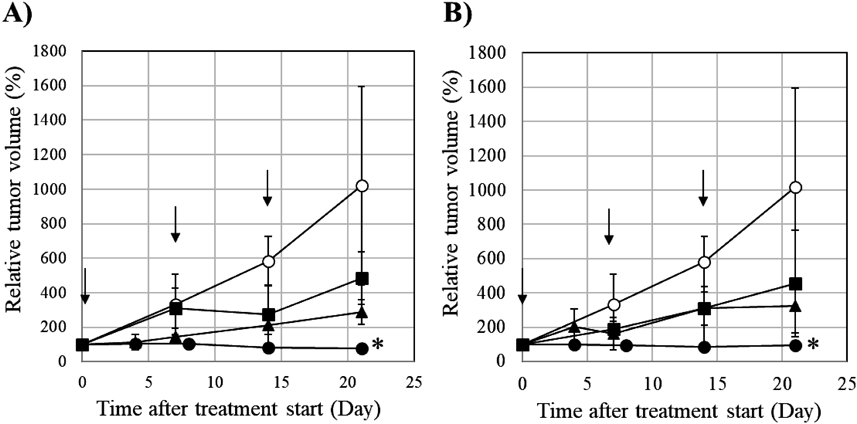
Each point represents the mean standard deviation (n = 3). * p < 0.05 compared with saline.
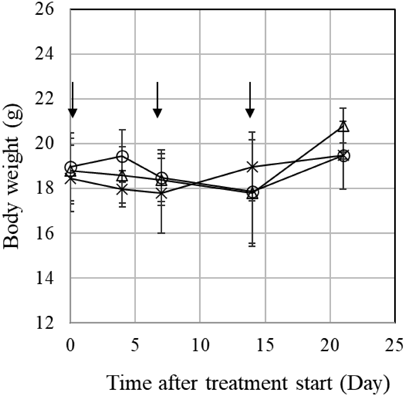
Each point represents the mean standard deviation (n = 3).
PET is a non-invasive imaging technique for the quantitative measurement of tumor activity. PET can predict the efficacy of drug treatment before tumor regression.23,24) To clarify the difference in the pharmacological effects of tumor treatment due to the difference in dosage form, PET measurements were performed on day 14 after treatment with saline, Taxol, and laser-NPs at 6 or 20 mg/kg. Summation PET images from 40–60 min after injection of D-isomer of 4-borono-2-18F-fluoro-phenylalanine (D-18F-FBPA) in MCF-7 tumor-bearing mice are shown in Fig. 9. The tumor uptake of D-18F-FBPA was reduced after treatment with Taxol and laser NPs. The mean standard uptake value (SUV) values and T/M ratio at 40–60 min after injection of D-18F-FBPA were calculated (Fig. 10). A significant decrease in tumor uptake of D-18F-FBPA was observed after treatment with 20 mg/kg of Taxol and laser-NPs, showing decreased SUV in the tumor region by 58.4% in Taxol and by 45.9% in laser-NPs compared to saline (p < 0.05). The T/M ratio of saline, 20 mg/kg of Taxol, and laser-NPs were 5.60 ± 0.59, 2.75 ± 0.48 and 2.11 ± 0.59, respectively. The T/M ratio of Taxol and laser-NPs was also significantly lower than that of saline (p < 0.05). SUV in the tumor region and T/M ratio after treatment with Taxol and laser-NPs at 6 mg/kg tended to be lower than those in the control. No significant differences were found in the SUV in the tumor region and T/M ratio treated with Taxol or laser-NPs. These results showed that Taxol and laser-NPs exhibited similar in vivo antitumor activity in terms of amino acid transport as well as tumor size measurement.
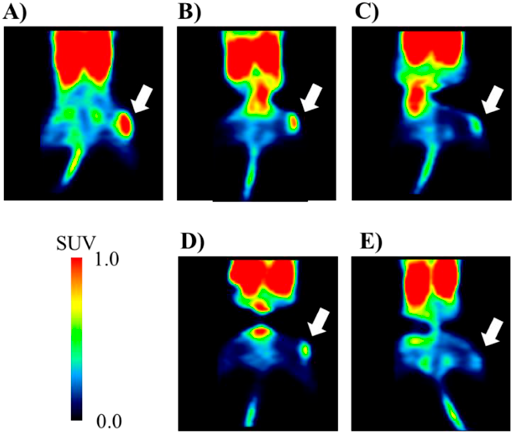
PET scanning was conducted for 60 min following injection of D-18F-FBPA, and summation images were created 40–60 min after the injection. The white arrows point to the tumor regions.
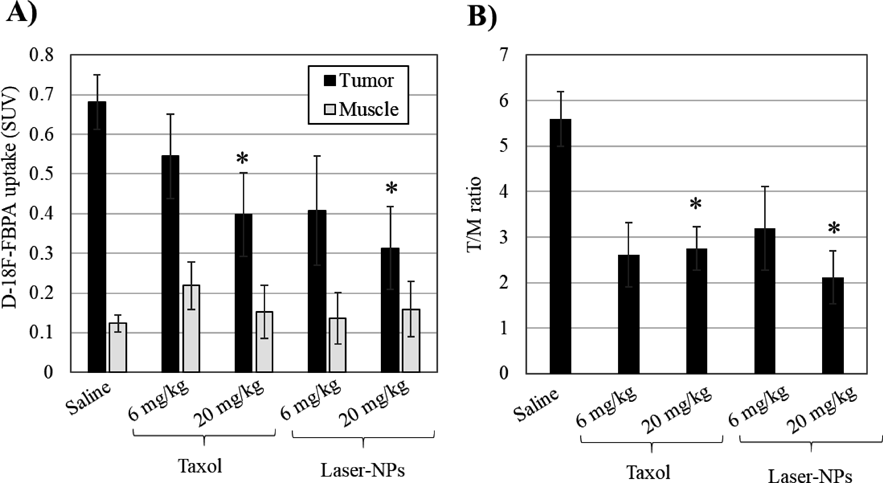
Averaged SUV values from 40–60 min after the injection (A), and the ratio of mean SUVs of tumor to muscle (B). Each column represents the mean ± standard deviation (n = 3). * p < 0.05 compared with saline.
In the present study, we succeeded in formulating novel paclitaxel-containing nanoparticles (laser-NPs) by laser irradiation, thereby improving the solubility of paclitaxel. Laser-NPs used a low-toxicity vehicle and exhibited antitumor efficacy equivalent to that of commercially available Taxol. Therefore, we believe that laser-NPs have the potential to be a novel paclitaxel formulation. There is a possibility that the administration route of paclitaxel could be changed by altering the formulation, and it is necessary to further evaluate the pharmacokinetics in the future. We expect that the laser irradiation method will be applied not only to paclitaxel but also to various drugs that are difficult to dissolve in water.
Taxol and paclitaxel were purchased from Bristol-Myers Squibb (Princeton, NJ, U.S.A.) and Tokyo Chemical Industry (Tokyo, Japan), respectively. Polyvinylpyrrolidone K30 (PVP K30) and sodium dodecyl sulfate (SDS) were purchased from FUJIFILM Wako Pure Chemical Corporation (Osaka, Japan). All other chemicals and solvents used were of analytical grade.
Methods of Preparation of NanoparticlesNanoparticles containing paclitaxel were formulated using a laser irradiation technique, as previously described,21) and a conventional milling method. In brief, 50 mg of PVP K30, 2 mg of SDS, and 10 mg of paclitaxel were dissolved in 1 mL of methanol, and methanol was removed under reduced pressure conditions. The mixture was sealed with 1 mL of water. The test tube was irradiated with neodymium-doped yttrium aluminum garnet (Nd:YAG) pulsed laser light. The irradiation conditions were as follows: 1064 nm wavelength, 0.61 J/cm2/pulse irradiation light intensity, 5–7 ns pulse width and 10 Hz repetition frequency. After 10 min of irradiation at room temperature, an aqueous dispersion of paclitaxel nanoparticles (laser-NPs) was formulated.
To prepare another form of nanoparticles (milling-NPs), paclitaxel and additive agents were milled at room temperature. Briefly, 200 mg of PVP K30, 8 mg of SDS, 40 mg of paclitaxel, and 20 g of 0.6 mm-diameter zirconium balls were weighed into the vessel of a wet milling mixer (Pulverisette 7, Fritsh, Idar Oberstein, Germany), and 4 mL of water was added. The dispersion was then mixed for 1 h at 500 rpm.
Characterization of the NanoparticlesThe morphologies of the nanoparticles were observed using a scanning electron microscope (SEM; S-4200, Hitachi High-Technologies, Tokyo, Japan). Samples of laser-NPs were prepared using an electro-spraying method with a SEM/TEM sample preparation device (Hamamatsu Nano Technology Inc., Hamamatsu, Japan). Samples of milling-NPs were captured by passing the suspensions through a filter with 200-nm pores. The filter was then dried and observed using an SEM.
Particle size analysis was performed by dynamic light scattering (Nanotrac UPA-UT151, Nikkiso Co., LTD., Tokyo, Japan) using a 5-mW semiconductor laser at 780 nm. The measurements were carried out at room temperature using undiluted nanoparticle dispersions.
The amount of paclitaxel in the nanoparticle dispersion was measured using HPLC (LC10-AD, Shimadzu Corp., Kyoto, Japan). To remove paclitaxel that was not reduced in size, laser-NPs and milling NPs prepared at a dose of 10 mg/mL were allowed to stand at room temperature for 10 min and the supernatants were analyzed using HPLC. The mobile phase was acetonitrile/water (1/1, v/v) and the column was a reversed-phase ODS-80Ts C18 column (4.6 × 150 mm, Tosoh Corp., Tokyo, Japan). The flow rate was 1.0 mL/min, the detection wavelength was 227 nm (SPD-M10A UV detector, Shimadzu Corp.), and the column temperature was maintained at 37 °C. The injected volume of each sample was 20 µL.
XRPD was performed using a RINT1100 instrument (Rigaku Corp., Tokyo, Japan) with Cu Kα radiation (λ = 0.1541 nm) at 30 kV and 10 mA. We examined the physical states of intact paclitaxel, a physical mixture of paclitaxel/PVP K30/SDS (1/5/0.2, v/v/v) (PM), laser-NPs, and milling NPs. Nanoparticle dispersions were flash-frozen in liquid nitrogen and lyophilized to produce a dry powder. The powders were compressed into a sample holder, and the surface was smoothed using a flat block. The measurements were carried out over a range of 2θ from 3 to 70°.
In Vitro Release of PaclitaxelThe in vitro release properties of paclitaxel from the PM and the lyophilized powders of laser-NPs and milling-NPs were determined as previously reported with a slight modification.25,26) Briefly, the PM or nanoparticles containing 10 mg of paclitaxel were dispersed in 1 L of 1 M sodium salicylate at 37 °C and incubated under agitation at 100 rpm. At 5, 10, 15, 20, 30, 60, 90, 120, and 180 min, 1 mL of sample buffer was filtered through a filter with 0.2-µm pores (Millipore, Billerica, MA, U.S.A.). Paclitaxel concentrations were determined using HPLC, as described above.
In Vitro CytotoxicityMCF-7 breast cancer cell lines were provided by DS Pharma Biomedical Co., Ltd. (Osaka, Japan). Cells were grown in a medium consisting Dulbecco’s modified Eagle’s medium supplemented with 10% fetal bovine serum, 1% nonessential amino acids, 1% L-glutamine, penicillin (100 IU/mL), and streptomycin (100 IU/mL). The cultures were maintained at 37 °C in a humidified atmosphere containing 5% CO2. At 80% confluence, the cells were passaged using 0.25% trypsin/ethylenediaminetetraacetic acid solution. MCF-7 cells were seeded into a 96-well plate at a volume of 100 µL (1 × 10³ cells/well) and incubated at 37 °C in a humidified atmosphere containing 5% CO2. Cells were exposed to Taxol, laser-NPs, vehicle of Taxol (Cremophor EL [CreEL] /ethanol [EtOH] mixture [1/1, v/v]), and vehicle of laser-NPs (aqueous solution of PVP K30 and SDS [5/0.2, v/v]) at different concentrations (n = 5). Vehicles were diluted in media to match the CreEL, EtOH, PVP K30, and SDS amounts used in Taxol and laser-NPs. After 96 h of incubation with each drug, the percentage of viable cells was determined by MTT colorimetric assay using a Cell Proliferation Kit (Sigma-Aldrich Japan, Tokyo, Japan). The absorbance was measured at a wavelength of 570 nm (using 700 nm as the reference wavelength) on a plate reader (SpectraMax i3x, Molecular Devices, San Jose, U.S.A.).
Live Cell Imaging in VitroIn vitro live cell imaging was used to study microtubule dynamics. MCF-7 cells were transfected with pTagRFP-tubulin (Invitrogen, Moscow, Russia) using FuGENE 6 (Roche Applied Science, Basel, Switzerland). Cells were grown in Dulbecco’s modified Eagle’s medium (DMEM) supplemented with 10% fetal bovine serum, 1% nonessential amino acids, 1% L-glutamine, penicillin (100 IU/mL), streptomycin (100 IU/mL), and G418 (500 µg/mL, Promega Corp., Madison, U.S.A.). After 4 d, the concentration of G418 was increased to 700 µg/mL. The cells were synchronized using the double thymidine block method.27) When cells grew to 60–70% confluence in a 25-cm2 flask, 2 mM thymidine was added to the medium. After 24 h of culture, the culture medium was replaced with fresh medium. After 9 h of culture, the cells were treated with 2 mM thymidine. After 24 h of culture, the culture medium was replaced with fresh medium. The cells were plated on a glass-bottom dish. Taxol and laser-NPs were added to the culture medium at a final paclitaxel concentration of 10 µM. Nuclear morphology was investigated by Hoechst 33342 staining (Dojindo Laboratories, Kumamoto, Japan). Time-lapse images were acquired with a 63 × 1.40 NA oil immersion HCX PLAPO CS objective on a confocal microscope every 10 min (TCS SP8, Leica, Wetzlar, Germany). Images were acquired as Z-stacks at 0.5 µm intervals and compiled as maximum projections. Figures were assembled, and the final brightness and contrast of images were obtained using ImageJ.
In Vivo Antitumor EfficacyAll animal studies (pilot number: HPK-2014-25, 2018-03, 2018-10, 2019-05) in this report were approved by the ethical committee of the Central Research Laboratory, Hamamatsu Photonics K.K. (Shizuoka, Japan). MCF-7 tumor-bearing mice (BALB/cSlc-nu/nu, female, 7 weeks old) were purchased from Japan SLC (Shizuoka, Japan). These mice were implanted subcutaneously with an estrogen pellet (0.72 mg/60 d, Innovative Research of America, Sarasota, FL, U.S.A.). The mice were housed in a satellite animal facility under controlled temperature and humidity, a 12 h light–dark cycle environment, and ad libitum access to food and water. The mice were randomly assigned to seven groups (n = 4 each). Taxol, laser-NPs (2, 6, and 20 mg paclitaxel/kg), and saline were administered by tail vein injection once a week for 3 weeks (days 0, 7, and 14). Tumor sizes were measured using a caliper and estimated using the following equation: tumor volume = length × width × depth ×3.14/6.
PET MeasurementsWe selected D-isomerization of 4-borono-2-[18F]fluoro-phenylalanine (D-18F-FBPA) for PET and imaging of MCF tumors, because previous research demonstrated that D-18F-FBPA is a better tumor imaging PET probe than other tyrosine-based probes for glioma detection in the rat brain.28)
On day 14 after initiation of treatment with 6 or 20 mg/kg of Taxol, laser-NPs, and saline, the in vivo uptake of D-18F-FBPA in MCF-7 tumor-bearing mice was determined by PET measurements. D-18F-FBPA was produced as previously reported (Kanazawa et al.).28) Mice were anesthetized with 1.5–2.0% isoflurane in O2, positioned prone on a fixation plate, and placed in the gantry hole of the PET scanner (SHR-38000, Hamamatsu Photonics, Shizuoka, Japan). After a transmission scan for 15 min using a 68Ga rotation rod source, D-18F-FBPA at 5 MBq was intravenously injected into mice through the tail vein, followed by an emission scan for 60 min with D-18F-FBPA. The body temperature of each animal was monitored throughout the study using a Thermo-Hygro Recorder (TR-72Ui, T&D Corporation, Nagano, Japan). PET data were reconstructed using the dynamic row-action maximum likelihood algorithm with a Gaussian filter of 1.0 mm full width at half-maximum and attenuation correction using transmission scan data.29) Images were acquired every 5 min, and summation images from 40 to 60 min after D-18F-FBPA injection were reconstructed. The standard uptake value (SUV) was calculated using the following equation: SUV = Ct × Ws / Dinj, where Ct is the tissue radioactivity (Bq/mL) obtained from PET images, Ws is the body weight (g), and Dinj is the injected dose (Bq) of D-18F-FBPA. Volumes of interest were defined from summation images and set on the tumor region in the right hind leg and the muscle region in the left hind leg as a control. The T/M ratio is defined as the ratio of the mean SUV of the tumor to the muscle.
Statistical AnalysisResults are presented as the mean ±standard deviation. Student’s t-test was used to evaluate the significance of differences between groups. Differences were considered statistically significant at p < 0.05.
The authors thank Messrs. Takeharu Kakiuchi, Dai Fukumoto, Dr. Shigeyuki Yamamoto, and Shigetoshi Okazaki (Hamamatsu Photonics K.K.) for technical support in animal care and data analysis of PET imaging.
The authors declare no conflict of interest. This research did not receive any specific grant from funding agencies in the public, commercial, or not-for-profit sectors.