Abstract
Evaluation of endogenous melatonin (MEL) secretion using its urinary metabolites is useful for the treatment of circadian rhythm sleep disorders. The primary melatonin metabolites excreted in the urine are 6-hydroxymelatonin (6-O-MEL) sulfate (S-O-MEL) and 6-O-MEL glucuronate, which result from sequential MEL metabolism by phases I and II drug metabolizing enzymes. To determine the accurate MEL secretion level, these urinary metabolites should be enzymatically deconjugated and converted into MEL. Furthermore, the use of LC–tandem mass spectrometry (LC–MS/MS) is preferable for the precision of this determination. Therefore, as part of our ongoing efforts to ultimately determine the level of MEL secretion, we herein aimed to develop an LC–MS/MS-based quantification method for 6-O-MEL and optimize deconjugation conditions. We determined the LC–MS/MS conditions of 6-O-MEL measurement and optimized the conditions of enzymatic reactions. The most efficient S-O-MEL deconjugation (102.1%) was achieved with Roche Glucuronidase/Arylsulfatase (from Helix pomatia) at 37 °C, pH-4.0 reaction buffer, and 60 min of reaction time. For human urine samples, the minimum amount of the enzyme required was 5944 units. Under these conditions, the accuracy and precision values of the 6-O-MEL determination (relative errors and standard deviation) were −3.60–−0.47% and <6.80%, respectively. Finally, we analyzed the total amount of MEL metabolites excreted in 24-h urine samples; it was 6.70–11.28 µg in three subjects, which is comparable with the values reported till date. Thus, we have established a new method of measuring the total 6-O-MEL in human urine samples using an LC–MS/MS coupled with the prerequisite deconjugation reaction.
Introduction
Melatonin (MEL) is a low-molecular weight hormone that is synthesized in the pineal gland from tryptophan.1) MEL has been reported to have various physiological activities, including antioxidant, anti-inflammatory, immunomodulatory, and anticancer effects,2–5) through which it is expected to contribute to treatment of several diseases, such as psychic derangement, respiratory diseases, and viral infections.6–8) However, the most prominent effect is sleep induction.9,10) The secretion of MEL from the pineal gland is stimulated by external light, and its plasma concentration increases at night to induce sleep. Therefore, MEL plays a critical role in maintaining the circadian rhythm, and disruption of its secretion pattern can result in sleep disorders, like delays in falling asleep or waking up.11–13) Such disturbed sleep behavior is particularly detrimental to children for their growth and development.
In patients who suffer from sleep disorders, MEL replacement therapy is an important treatment option, where appropriate evaluation of endogenous MEL secretion level is essential for deciding its proper dosage.14–16) In such evaluations, nocturnal MEL plasma concentration can be a primary indicator,17) but it has not yet been widely used in clinical practice. This is due to necessity of invasive blood sampling accompanied by significant burdens on both medical staffs and patients during nigh time.
Another way to evaluate MEL secretion is the use of urinary 6-sulfatoxymelatonin (S-O-MEL), one of the major MEL metabolites.18–20) After its secretion, MEL is mostly metabolized to 6-hydroxymelatonin (6-O-MEL) by CYP1A2 in a phase I reaction. The 6-O-MEL is further converted to the sulfate conjugate (6-sulfatoxymelatonin, S-O-MEL) (60–90%) or the glucuronate conjugate (10–30%) by phase II reactions, and almost all of them are excreted into the urine21–24) (Fig. 1). It has been reported that the relative ratio of sulfate and glucuronate conjugates is different between individuals,24) resulting in a concern that S-O-MEL measurement alone is not sufficient for accurate evaluation of MEL secretion. Collectively, development of a new less-invasive MEL evaluation method using urine samples is desirable.
One possible way to address the issue is determination of the total 6-O-MEL excreted in the urine, which can be obtained by enzymatic deconjugation reaction (namely, hydrolysis of all the sulfate and glucuronate conjugates into 6-O-MEL). Consistently, the phase II metabolite deconjugation has been used to measure the total excretion of 6-O-MEL in the urine.24,25) In these reports, GC–MS was used. However, utilization of LC–tandem mass spectrometry (LC–MS/MS) would be more preferable. One reason is because of its higher sensitivity and specificity. Furthermore, compared with GC–MS analysis, LC–MS/MS requires a shorter analytic time and is not accompanied by a derivatization step. Albeit these beneficial points, LC–MS/MS has yet to be utilized in urinary 6-O-MEL quantification.
As parts of our ongoing efforts to ultimately establish a more accurate and convenient evaluation method for MEL secretion, in the present study, we aimed at developing a LC–MS/MS-based method for measuring 6-O-MEL total urinary excretion amount. To this end, we also sought to optimize experimental conditions for deconjugation reaction.
Results and Discussion
In the previous reports describing a urinary 6-O-MEL evaluation method,24,25) the deconjugation reaction conditions for urine 6-O-MEL metabolites were not firmly optimized. In particular, the method requires long reaction time (3–18 h), which may undermine its clinical applicability. Furthermore, it can be expected that using LC–MS/MS, instead of GC–MS, will provide higher accuracy in the measurement of 6-O-MEL.
Therefore, we first developed LC–MS/MS measurement conditions for the 6-O-MEL standard and subsequently tried to optimize deconjugation reaction conditions of MEL metabolites. Finally, we evaluated MEL secretion levels using human urine samples.
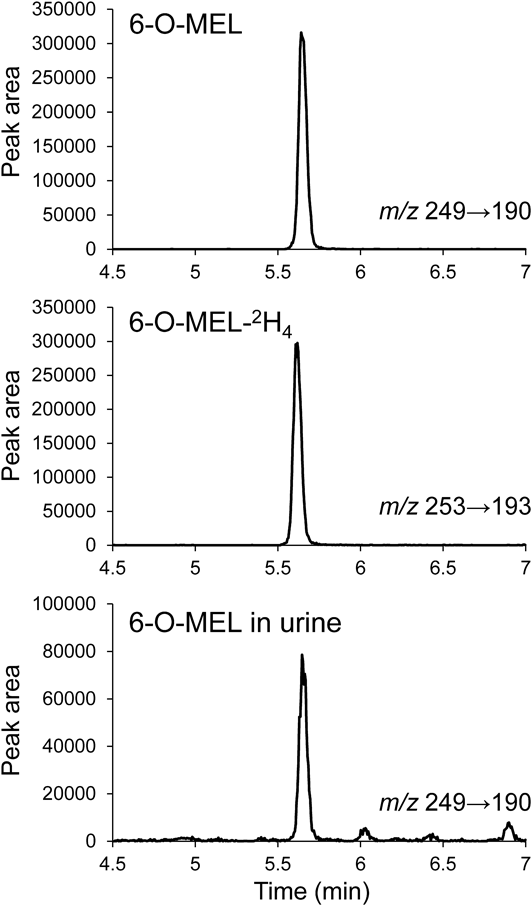
Development of LC–MS/MS-Based Analytical Method for 6-O-MEL DeterminationFirst, we developed a method for the determination of 6-O-MEL and 6-O-MEL-2H4 using LC–MS/MS. As a result, the precursor ions were 249.1 for 6-O-MEL and 253.1 for 6-O-MEL-2H4, and the product ions were 190.1 and 158.1 for 6-O-MEL, and 193.1 and 161.1 for 6-O-MEL-2H4. Among them, the precursor and the product ions (collision energy) were selected to be m/z 249.1 and 190.1 (12 eV) for 6-O-MEL and m/z 253.1 and 193.1 (12 eV) for 6-O-MEL-2H4. Under these conditions and using the mobile-phase conditions described in Materials and Methods, peaks of 6-O-MEL and 6-O-MEL-2H4 appeared at approximately 5.65 min (Fig. 2).
Optimization of Deconjugation Reaction ConditionsEnzymesTo determine the enzyme to be used for deconjugation, we prepared the following six glucuronidase or sulfatase enzymes from different origins based on the report of Azuma et al.26): Sigma-Glu H1, Sigma-Glu VIIA, Wako-Glu 1, Wako-Glu 2, Sigma-Sul, Roche-Glu/Sul. Generally, β-glucuronidase also has sulfatase activity and vice versa. The experiments began with the reaction time of 60 min, the enzyme amount of approximately 1000 units (1000–1250 units), and the reaction temperature of 37 °C. As for the pH, 5.0 was used for Sigma-Glu H1, Wako-Glu 1, and Sigma-Sul, 5.1 for Wako-Glu 2 and Roche-Glu/Sul, and 6.8 for Sigma-Glu VIIA according to the manufacturers’ recommendation. S-O-MEL was selected as the substrate because sulfate conjugates are generally more resistant to deconjugation than glucuronate conjugates.26) The amount of S-O-MEL was fixed at 30.1 ng, which is equivalent to the amount of urinary excretion used in the previous report.18,19)
Based on the above reaction conditions, the deconjugation experiments were performed and their rates (%) were calculated by dividing the amount of the resulting 6-O-MEL (mol) by the initial amount of S-O-MEL (mol) added. The highest S-O-MEL deconjugation rate was observed with Roche-Glu/Sul (86.00 ± 8.48%, Fig. 3a), followed by Sigma-Glu H1 (75.12 ± 6.07%). However, Sigma-Glu VIIA and Wako-Glu 2 showed almost no deconjugation activity. These enzymes lacking deconjugation activity were believed to have low substrate specificity for S-O-MEL. Therefore, we selected Roche-Glu/Sul for use in deconjugation of MEL metabolites.
Reaction ConditionsFirst, we tested various amounts of Roche-Glu/Sul (19 and 1486 units) to determine its minimum amount for full deconjugation of 30.1 ng of S-O-MEL in the above-described reaction conditions, and found it was 74 units (data not shown). With this enzyme amount, the reaction temperatures of 20, 37, and 50 °C were then evaluated. The deconjugation rates at each temperature were comparable, but the highest rate was observed at 37 °C. Therefore, we regarded it as the most suitable temperature (Fig. 3b).
Next, in order to identify the optimal pH, pH 3.0, 4.0, 5.1, and 6.0 were examined. The deconjugation rate was the lowest at pH 3.0, while reaching a maximum at pH 4.0 and then gradually decreasing as the pH became higher (Fig. 3c). Therefore, pH 4.0 was found to be appropriate for the deconjugation reaction. Since the pH of human urine usually ranges from 4.5 to 8.0, there is a possibility that the addition of a urine sample could change the pH of the reaction mixture. When the urine sample was added, the measured pH was 3.99 to 4.04 (n = 6), with almost no change.
Then we tried to shorten the reaction time as much as possible. As the results of examination with 10, 20, 30, 60, and 120 min, the deconjugation rates got higher as the reaction time increased, reaching 100% at 60 min or longer (Fig. 3d). The minimum requirement (60 min) is significantly shorter than those in the previous methods (3 and 18 h24,25)), indicating that our method is less time-consuming.
Collectively, the optimized enzymatic reaction conditions for achieving most efficient S-O-MEL deconjugation were 37 °C temperature, reaction buffer of pH 4.0, and reaction time of 60 min.
Optimization of Enzyme Amount for MEL Metabolites Deconjugation in Human Urine SamplesBecause urine contains a variety of endogenous substances, such as other sulfate and glucuronide conjugates in addition to MEL metabolites, there is a concern that competitive inhibition toward the S-O-MEL deconjugation reaction may occur in use of human urine samples. If it is the case, excess amount of the enzyme is necessary for full deconjugation even under the above-determined reaction conditions. Therefore, we explored the amount of enzyme required for the reaction with urine samples. We recruited three healthy male adults (subject 1–3) to collect urine samples every 8 h from 6:00 to 14:00, 14:00 to 22:00, and 22:00 to 6:00. The enzyme amounts were set to 74, 2972, 4458, 5944, and 7429 units, and the urine volume tested were designated as 100, 200, and 300 µL depending on the total urine volume (≤225 mL, 225 to 375 mL, and ≥375 mL, respectively). The deconjugation reaction is likely to be completed when generation of 6-O-MEL reaches plateau, which is thus set at 100%. Based on this benchmark, each relative value was calculated. As shown in Figs. 4a–4c, the average deconjugation rate at 74 units was 17.0%, but it got higher as the units were increased (92.02, 98.35, and 98.13% for 4458, 5944, and 7429 units, respectively) (Fig. 4d). The p-values for a two-sample t-test assuming equal variances based on 7429 units were 0.0068 and 0.8562 for 5944 and 4458 units, respectively, suggesting that the deconjugation reaction can be completed at 5944 but not at 4458 units. Therefore, the minimum required amount of enzyme for urine MEL conjugates was 5944 units. Sulfate conjugate levels were monitored under these conditions, and no peaks were observed in urine samples. This indicates that all sulfate conjugates in urine were deconjugated.
Extraction MethodSince it is important to minimize loss of samples during pretreatment as much as possible, we tested a liquid–liquid extraction method and several solid-phase extraction (Oasis HLB, Oasis MAX, Oasis MCX, and Sep-Pak C18 Plus) methods in order to reduce sample loss for improvement of measurement sensitivity of LC–MS/MS. We first tested an Oasis MAX and Oasis MCX with 6-O-MEL standard solution (4.9 ng/mL in distilled water) and extraction solvents of methanol and acetonitrile. Additionally, we tested a liquid–liquid extraction method with 100% ethyl acetate. Assuming that the area obtained with Oasis HLB was 100%, the obtained peak areas were 2.30 and 0.71% for 100% methanol and 2%-formic acid/acetonitrile, respectively, in Oasis MAX; 0.46% and not detected for 100% methanol and ammonia/acetonitrile, respectively, in Oasis MCX; and 0.34% for liquid–liquid extraction. The low extraction rate was probably due to the fact that the target component was eluted during washing or not desorbed by the eluting solvent. In contrast, an Oasis HLB method with 100% methanol and a Sep-Pak C18 Plus method with 100% ethyl acetate yielded a measurable 6-O-MEL peak. In general, methanol is used for the elution of Sep-Pak C18 Plus; our laboratory examined eluents for the steroids of the same neutral substance and found that the highest extraction rate was obtained with ethyl acetate.27) Therefore, ethyl acetate was also used for the elution of Sep-Pak C18 Plus in this study. The reason for the large detected peaks with Oasis HLB and Sep-Pak C18 Plus was that 6-O-MEL is a neutral compound. We calculated the extraction rates of these two methods as 81.9 and 66.8%, respectively. Therefore, we concluded that the Oasis HLB method with methanol-based extraction solvents (hereafter referred to as the Oasis HLB method) was most suitable for 6-O-MEL extraction. The reason for the higher extraction rate with Oasis HLB may be that Sep-Pak C18 is an octadecylsilyl (ODS) column (C18), whereas Oasis HLB is a polymer system with higher adsorption performance. We confirmed the validity of this method using a urine sample, where the 6-O-MEL peak was detected at the same time (5.65 min) as that of the authentic 6-O-MEL (Fig. 2).
Method ValidationExtraction RecoveryTo determine the amount of sample lost during pretreatment, the extraction rate was calculated using the Oasis HLB method with the 6-O-MEL standard at three concentration levels (n = 6). The results were 67.40 ± 2.78, 81.87 ± 3.22, and 71.97 ± 1.72% for low, middle, and high concentration levels, respectively (Table 1). At low concentrations, the percentage loss of 6-O-MEL, which was probably due to adsorption during the extraction process, was relatively large, resulting in a slight decrease in the extraction rate. However, stable isotope-labeled compounds were used as the internal standard, and the measured values could be corrected even if the extraction rate was low; therefore, the extraction rates were sufficient for quantitative measurement.
Table 1. Extraction Rate from Oasis HLB at Three Concentrations of 6-O-MEL Standards
| Individual values (%) | Mean ± S.D. | RSD (%) |
|---|
| Lowa) | 69.26 | 66.71 | 62.51 | 70.03 | 66.68 | 69.22 | 67.40 ± 2.78 | 4.12 |
| Middleb) | 79.84 | 79.74 | 79.02 | 81.39 | 87.47 | 83.73 | 81.87 ± 3.22 | 3.93 |
| Highc) | 70.18 | 70.63 | 72.67 | 74.94 | 72.12 | 71.30 | 71.97 ± 1.72 | 2.39 |
6-O-MEL, 6-hydroxymelatonin; S.D., standard deviation; RSD, relative standard deviation. a) Low concentration: 0.735 ng. b) Middle concentration: 4.90 ng. c) High concentration: 24.5 ng.
The LLOD and LLOQ were determined by calculating the signal-to-noise (S/N) ratios using the 6-O-MEL sample starting at 8.575 pg/injection and gradually diluting by 2.5-fold. The results showed that 0.137 pg/injection was the LLOD (S/N ratio >3) and 3.43 pg/injection was the LLOQ (S/N ratio >10), which is equivalent to 1.715 ng/mL in urine concentration. Six repeated measurements were performed to confirm the LLOQ, and the relative error (RE) and relative standard deviation (RSD) were 0.82 and 3.62%, respectively (Supplementary Table S1). Considering that urinary 6-O-MEL excretion amount was reported to be as low as 1.3 µg/12 h (12:00 to 24:00),24) the LLOQ (1.715 ng/mL) from our method is sufficiently low for 6-O-MEL detection at clinical setting.
LinearityThe calibration curve was obtained using with six standard concentrations of 6-O-MEL mixed with 6-O-MEL-2H4, and its linearity was tested by repeating the preparation 10 times. The results showed that the slope and the intercept were 0.437 ± 0.023 and −0.012 ± 0.027, respectively, and that the correlation coefficient was 0.99971 ± 0.00020, indicating that the calibration curve has good linearity with high reproducibility (Table 2). Furthermore, a calibration curve was drawn by adding a 6-O-MEL sample to the urine sample of a healthy subject. Consequently, a calibration curve of y = 0.447x + 0.024, r = 0.999 was obtained, and the curve was confirmed to be within the range of variation of the normally prepared calibration curve.
Table 2. Calibration Curve of 6-O-MEL
a)| Concentration (ng) | Correlation coefficient (mean ± S.D.) | Slope (mean ± S.D.) | Intercept (mean ± S.D.) |
|---|
| 0.490–6.125 | 0.99971 ± 0.00020 | 0.437 ± 0.023 | −0.012 ± 0.027 |
6-O-MEL, 6-hydroxymelatonin; S.D., standard deviation. a) Calibration curve was prepared 10 times. Correlation coefficient, slope, and intercept were calculated as the mean ± S.D.
Since endogenous urinary substances may compromise the sensitivity of LC–MS/MS measurements, the matrix effect was examined by comparing the standard with the urine sample. The results showed that the matrix effect was nearly 100% (99.75 ± 12.48%) and the RSD was 12.51%, indicating that the effect of exogenous substances can be negligible (Supplementary Table S2).
Accuracy and PrecisionThe quantitative accuracy and precision of the 6-O-MEL determination method were examined using urine samples from one healthy subject collected between 6:00 and 14:00. In total, 18 urine samples (200 µL/sample) were divided into the following three groups (n = 6 in each), depending on different 6-O-MEL addition manners: to the first group, no 6-O-MEL was added, and to the second and the third groups, 1.225 ng and 2.450 ng of 6-O-MEL were added, respectively. The intraday and the interday accuracy and precision were examined in 1 d and in 6 d, respectively. As a result, the REs ranged from −3.60 to −0.47% and the RSDs were within 6.80% (Table 3). From these results, the present method has sufficient accuracy and precision quality for measurements of 6-O-MEL in urine samples.
Table 3. Accuracy and Precision of Urine Samples Measured after the Deconjugation Reaction
a)| Added (ng/mL) | Expected (ng/mL) | Found (ng/mL) | Mean ± S.D. | RE (%) | RSD (%) |
|---|
| Intraday | | | | | | | | | | |
| 0 | | 11.28 | 10.46 | 10.39 | 9.84 | 10.51 | 10.45 | 10.49 ± 0.46 | — | 4.40 |
| 6.13 | 16.57 | 16.69 | 16.12 | 15.36 | 15.62 | 16.04 | 15.99 | 15.97 ± 0.45 | −3.60 | 2.84 |
| 12.25 | 22.69 | 22.47 | 22.82 | 22.44 | 22.33 | 22.70 | 21.52 | 22.38 ± 0.46 | −1.37 | 2.04 |
| Interday | | | | | | | | | | |
| 0 | | 12.31 | 13.20 | 12.24 | 13.24 | 13.06 | 11.28 | 12.56 ± 0.76 | — | 6.09 |
| 6.13 | 18.69 | 19.29 | 20.23 | 17.84 | 19.29 | 18.22 | 16.69 | 18.59 ± 1.26 | −0.47 | 6.80 |
| 12.25 | 24.81 | 25.75 | 27.12 | 24.16 | 25.05 | 23.50 | 22.47 | 24.67 ± 1.66 | −0.53 | 6.73 |
S.D., standard deviation; RE, relative error; RSD, relative standard deviation. a) In the accuracy and precision, intraday and interday measurements were performed in three groups (6 samples each).
To analyze freeze–thaw and storage stabilities after sample preparation in the mobile-phase solvent, we prepared 6-O-MEL standard samples at three concentrations (low: 4.9 ng/mL, middle: 9.8 ng/mL, high: 14.7 ng/mL) (6 replicates each). With respect to the freeze–thaw stability of 6-O-MEL, it ranged from 96.22 to 105.45% (Table 4). Then the stability storage was evaluated at 4 °C for 24 h (short-term) and for 7 and 15 d (long-term). The short-term stability was 93.83–95.05%, and the long-term stabilities were 79.45–88.84% after 7 d and 65.01–89.84% after 15 d (Table 4). The lower stability of 6-O-MEL on day 7 at low concentrations is suggested to be due to the lower pH caused by 10 mM ammonium acetate–0.2% formic acid solution used for sample preparation. This may be because 6-O-MEL, as a neutral compound, decomposes gradually in the acidic mobile layer. These results indicate that the measurement should be done as soon as possible to avoid substantial 6-O-MEL degradation. The long-term stability (3 months) of the urine samples was also examined. The results illustrated that the residual percentage after 3 months was 99.55 ± 17.16%. This indicates that the concentrations of 6-O-MEL and its conjugates are stable in urine samples for at least 3 months.
Table 4. Stability of 6-O-MEL
a)| Storage period and storage condition | Percentage of concentration to the spiked value (%) |
|---|
| Lowb) (mean ± S.D.) | Middlec) (mean ± S.D.) | Highd) (mean ± S.D.) |
|---|
| Freeze–thaw, three cycles (−80 °C to room temperature) | 96.22 ± 3.52 | 103.57 ± 1.67 | 105.45 ± 2.58 |
| Short-term storage (4 °C, 24 h) | 93.83 ± 7.72 | 95.05 ± 2.28 | 94.02 ± 2.85 |
| Long-term storage (4 °C, 7 d) | 79.45 ± 13.21 | 87.03 ± 7.16 | 88.84 ± 5.48 |
| Long-term storage (4 °C, 15 d) | 65.01 ± 27.00 | 85.34 ± 12.15 | 89.84 ± 12.63 |
6-O-MEL, 6-hydroxymelatonin; S.D., standard deviation. a) Stability in freeze–thaw, short-term storage (24 h), and long-term storage (7 and 15 d) were investigated in three concentration levels of 6-O-MEL standard (n = 6). b) Added of low concentration: 4.9 ng/mL. c) Added of middle concentration: 9.6 ng/mL. d) Added of high concentration: 14.7 ng/mL.
Under the above-described measurement conditions for MEL metabolites, urine samples from three healthy subjects (Subject 1–3) were assessed to evaluate MEL secretion. The results showed that the total amount of MEL excreted by each subject in 24 h was estimated to be 11.28 µg (Subject 1), 9.13 µg (Subject 2), and 6.70 µg (Subject 3). These values are comparable to those reported by Tetsuo et al. (from 6.2 to 18.8 µg in 14 individuals).24)
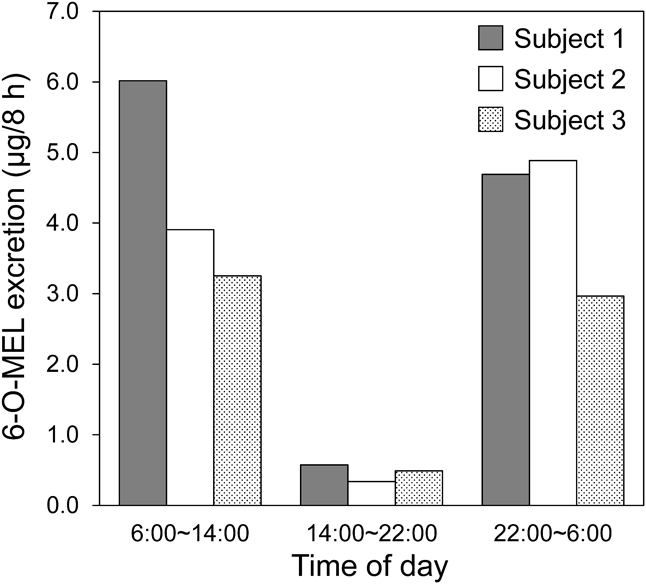
In clinical settings, it is difficult to collect all urine from patients, and; therefore, it is important to obtain a representative urine sample for which concentration is closely related to overall 6-O-MEL excretion profile. In order to explore such optimal samples, we plotted the 6-O-MEL excretion levels at 8-h intervals in three healthy subjects as shown in Fig. 5. The lowest excretion level was found at the interval 14:00 to 22:00 h in all subjects, which is consistent with the previous report.24) Since MEL secretion increases at the time of sleep, the urinary excretion of MEL is also expected to increase during the 22:00 to 6:00 h. However, there was no significant difference between the levels at the 6:00 to 14:00 h and the 22:00 to 6:00 h. The reason for this unexpected result is currently unclear, but this may result from a time lag between MEL secretion and metabolism/excretion. Therefore, further investigation will be necessary to identify the most suitable time point to collect urine samples.
Conclusion
In this study, together with identification of the optimal conditions for the deconjugation reaction of MEL metabolites as well as a suitable extraction device, we have developed an LC–MS/MS-based measurement method for evaluation of 6-O-MEL levels in human urine. Based on the validation of data, the method has appropriate sensitivity, linearity, accuracy, and precision qualities for 6-O-MEL quantification. The matrix effect is unlikely to be a major concern, and there is no problem with the 6-O-MEL stability in sample solutions. Furthermore, the deconjugation reaction time of our method is significantly shorter than those reported previously. Although this method requires time and cost for the deconjugation reaction, it offers a more convenient and sophisticated quantification of 6-O-MEL in human urine than the method that measures all conjugates. In addition, our method is expected to contribute to clinical MEL excretion evaluation in patients. To that end, it will be absolutely necessary to accumulate more data on urine samples from healthy subjects in the next study.
Experimental
Chemicals and AgentsN-[2-(6-Hydroxy-5-methoxy-1H-indol-3-yl)ethyl]acetamide (6-O-MEL), N-[2-[5-Methoxy-6-(sulfooxy)-1H-indol-3-yl]ethyl]acetamide Sodium (S-O-MEL) and 6-O-MEL-2H4 were purchased from Toronto Research Chemicals (Toronto, ON, Canada). All other chemicals and solvents, including LC–MS grade methanol, distilled water, and ammonium acetate, were purchased from Kanto Chemical (Tokyo, Japan). Regarding deconjugation enzymes, β-glucuronidase Type H-1 from Helix pomatia (Sigma-Glu H1), β-glucuronidase from Escherichia coli (Sigma-Glu VIIA), and sulfatase from Helix pomatia (Sigma-Sul) were purchased from Sigma-Aldrich (St. Louis, MO, U.S.A.). β-Glucuronidase solution from Helix pomatia (Wako-Glu 1) and β-glucuronidase solution from Ampullaria (Wako-Glu 2) were obtained from FUJIFILM Wako Pure Chemical Corporation (Osaka, Japan). β-Glucuronidase/arylsulfatase from Helix pomatia (Roche-Glu/Sul) was purchased from Roche Diagnostics (Basel, Switzerland).
Urine Sample CollectionThree healthy adult subjects were recruited in this study, and their individual profiles were as follows: Subject 1: 46 years-old, male, 62 kg; Subject 2: 21 years-old, male, 64 kg; and Subject 3: 21 years-old, male, 60 kg. A total of nine urine samples were collected from these subjects between 6:00 to 14:00, 14:00 to 22:00, and 22:00 to 6:00 h. The urine was collected in bottles, then the volume (mL) was measured and immediately frozen (−20 °C). Urine sample collection and their use in this study had been approved by the Human Subjects Review Board of the Tokyo University of Pharmacy and Life Sciences and written informed consent was obtained from each participant (approval number: 18-02).
Preparation of StandardsA stock solution of 6-O-MEL was prepared at 24.5 µg/mL using methanol. This solution was further diluted with methanol to prepare standard solutions ranging from 24.5 to 245 ng/mL. A stock solution of 6-O-MEL-2H4 was prepared at 6.7 µg/mL using methanol, which was further diluted to 67 ng/mL with methanol.
Deconjugation ReactionSeveral deconjugation reaction conditions, including enzyme selection (from Sigma-Glu H1, Sigma-Glu VIIA, Wako-Glu 1, Wako-Glu 2, Sigma-Sul and Roche-Glu/Sul), temperature (20–50 °C), time (10–120 min), and buffer pH (3.0–6.0), were examined as described in detail in Results, and other procedures were the followings. First, urine samples stored at −20 °C (described in the “Urine sample collection” section) were thawed and centrifuged at 800 × g for 15 min. Then, the deconjugation enzyme, 800 µL of distilled water, and 200 µL of supernatant of the urine sample were added to 1 mL of acetate buffer in that order, followed by incubation for determined time. The reaction was stopped by rapid cooling on ice and then 6-O-MEL-2H4 (3.35 ng) was added as an internal standard.
Extraction and Sample PreparationSeveral extraction methods (liquid–liquid extraction and solid-phase extraction using either one of Oasis MAX, Oasis MCX, Oasis HLB, or Sep-Pack C18 Plus [Waters, Milford, MA, U.S.A.]) were tested and eventually the highest extraction rate was obtained with Oasis HLB (refer to the “Extraction method” section).
After deconjugation, the urine samples were injected into an Oasis HLB cartridge (1 cc Vac Cartridge, 30 mg Sorbent) that had been pre-activated with 0.5 mL of methanol and 0.5 mL of distilled water according to the manufacturer’s instruction. The cartridge was washed with a 5% methanol solution and then eluted with 6-O-MEL, and IS were eluted with 0.5 mL of methanol. After extraction, the solvent was removed under a stream of nitrogen. The residue was dissolved in 200 µL of 10 mM ammonium acetate–0.2% formic acid solution : methanol (3 : 7, v/v) by stirring and ultrasonication (5 min). The solution was filtered through Nanosep MF centrifugal devices containing a 0.45 µm wwPTFE membrane (Nihon Pall, Tokyo, Japan). Finally, 2 µL of the filtrated sample was injected to LC–MS/MS.
Chromatography and Mass Spectrometry ConditionsLC–MS/MS analyses were performed using an ACQUITY UPLC H-class and Xevo TQD triple quadrupole mass spectrometer (Waters, Milford, MA, U.S.A.). Chromatographic separations were done with an ACQUITY UPLC BEH C18 1.7 µm (2.1 × 100 mm) with an ACQUITY UPLC BEH C18 1.7 µm VanGuard Pre-column (2.1 × 5 mm). The sample manager temperature was 15 °C and the column temperature was 35 °C. The mobile-phase solvent consisted of 10 mM ammonium acetate–0.2% formic acid solution and methanol, and the gradient was set at 10% (0 min), 90% (10–13 min), and 10% (13.1–18 min) of methanol. The flow rate was 0.2 mL/min, and the total run time was 18 min. Electrospray ionization mode was used and the source temperature was set to 500 °C. Positive ion mode for MRM was selected for quantitative analysis. Precursor ion and product ion of 6-O-MEL and 6-O-MEL-2H4 were at m/z 249.1→190.1 and 253.1→193.1 with 12 eV collision energy, respectively.
LLOD and LLOQThe LLOD was designated as the lowest detectable concentration of 6-O-MEL standard with a signal-to-noise ratio (S/N ratio) >3. The LLOQ was designated as the lowest measurable concentration of 6-O-MEL standard with an S/N ratio >10. The accuracy (RE) of measuring 6-O-MEL in LLOQ concentration (n = 6) was confirmed to be within 20%.
LinearityThe calibration curves were obtained using the following six concentrations of 6-O-MEL dissolved in methanol: 0.490, 1.225, 2.450, 3.675, 4.900, and 6.125 ng. 6-O-MEL-2H4 (3.35 ng) was added to each standard as an internal standard. The calibration curves were depicted using unweighted least-squares linear fit of the peak-area ratios for 6-O-MEL and 6-O-MEL-2H4 versus the expected analyte concentrations of 6-O-MEL. The calibration curves of the same concentration range were repeatedly prepared on 10 sequential days, and the mean value with standard deviation (S.D.) of the slope, intercept, and correlation coefficient were calculated.
Extraction RateThe extraction rate was calculated using low, medium, and high concentrations for 6-O-MEL (0.735, 4.90, and 24.5 ng, six samples each). The samples were divided into two groups: a pre-addition and a post-addition group. The 6-O-MEL standard solution was added to 1 mL of distilled water before extraction and one the other a group added after extraction, and they were subjected to LC–MS/MS analysis. The mean ± S.D. values were calculated, and the RSD values were obtained by dividing the area ratio obtained from the pre-addition group by that obtained from the post-addition group.
Matrix EffectThe matrix effect associated with 6-O-MEL analysis in urine was examined. After deconjugation, the urine samples (n = 6) were divided into two groups: in one group, 6-O-MEL was extracted “as is,” whereas 6-O-MEL was extracted after adding 1.225 ng of 6-O-MEL standard in the other group. The peak area per 1 ng of 6-O-MEL was calculated from the difference of the obtained peak areas. Next, the water samples (n = 6) were prepared by dissolving 6-O-MEL (1.225 ng) in distilled water (500 µL). The extraction was performed, and the peak area per 1 ng of 6-O-MEL was calculated as above. The matrix effect of the mean value with S.D., and its RSD were calculated by dividing the urine sample data by the water sample data.
Accuracy and PrecisionThe intra- and inter-day accuracy and precision were determined by assaying 18 preparations of urine (200 µL each) collected between 6:00 and 14:00 h from the subject 1. The urine samples were divided into three groups, each containing six preparations, and then subjected to the deconjugation reaction. While one group was not spiked, the other two groups were spiked with a known amount of 6.13 or 12.25 ng of 6-O-MEL. An internal standard, 6-O-MEL-2H4 (3.35 ng), was added to all samples. These samples were assessed in 1 d for the intraday accuracy and precision evaluation. As for the interday evaluation, the sample determinations were successively performed for 6 d. The RSD and the relative errors (RE) were calculated and used as indicators in these evaluations.
StabilityFreeze–thaw stability and storage stability of 6-O-MEL after sample preparation in the mobile-phase solvent were determined at three concentrations (4.9, 9.6, and 14.7 ng/mL; six samples each). To ensure complete freezing/thawing, freezing was performed by storing the samples at −80 °C for >12 h and then thawing at room temperature, which was repeated three times. Storage stability was tested with the samples stored at 4 °C for 24 h (short-term storage stability) or 7 and 15 d (long-term storage stabilities) under the same condition as that of the actual sample used for measurement. These samples were subjected to LC–MS/MS analyses as described above.
ApplicationThe urine sample preparation is described in the “Urine sample collection” section. The 6-O-MEL concentration of these urine samples were measured by LC–MS/MS analysis after deconjugation of their conjugate metabolites as described above. The total amount of 6-O-MEL excreted in the urine every 8 h was calculated.
Conflict of Interest
The authors declare no conflict of interest.
Supplementary Materials
This article contains supplementary materials.
References
- 1) Ackermann K., Stehle J. H., Chronobiol. Int., 23, 369–379 (2006).
- 2) Zhang H. M., Zhang Y., J. Pineal Res., 57, 131–146 (2014).
- 3) Chang Y. S., Lin M. H., Lee J. H., Lee P. L., Dai Y. S., Chu K. H., Sun C., Lin Y. T., Wang L. C., Yu H. H., Yang Y. H., Chen C. A., Wan K. S., Chiang B. L., JAMA Pediatr., 170, 35–42 (2016).
- 4) Garcia-Mauriño S., Gonzalez-Haba M. G., Calvo J. R., Rafii-El-Idrissi M., Sanchez-Margalet V., Goberna R., Guerrero J. M., J. Immunol., 159, 574–581 (1997).
- 5) Pariente R., Bejarano I., Espino J., Rodríguez A. B., Pariente J. A., Cancer Chemother. Pharmacol., 80, 985–998 (2017).
- 6) Al-Aama T., Brymer C., Gutmanis I., Woolmore-Goodwin S. M., Esbaugh J., Dasgupta M., Int. J. Geriatr. Psychiatry, 26, 687–694 (2011).
- 7) Wu X., Ji H., Wang Y., Gu C., Gu W., Hu L., Zhu L., Oxid. Med. Cell. Longev., 2019, 4087298 (2019).
- 8) Anderson G., Maes M., Markus R. P., Rodriguez M., J. Med. Virol., 87, 537–543 (2015).
- 9) Cavallo A., J. Pediatr., 123, 843–851 (1993).
- 10) Reid K., Heuvel C. V. D., Dawson D., J. Sleep Res., 5, 150–154 (1996).
- 11) Zhdanova I. V., Wurtman R. J., Balcioglu A., Kartashov A. I., Lynch H. J., J. Gerontol. A Biol. Sci. Med. Sci., 53A, B293–B298 (1998).
- 12) Zisapel N., Br. J. Pharmacol., 175, 3190–3199 (2018).
- 13) Rahman S. A., St. Hilaire M. A., Lockley S. W., Physiol. Behav., 177, 221–229 (2017).
- 14) Gringras P., Nir T., Breddy J., Frydman-Marom A., Findling R. L., J. Am. Acad. Child Adolesc. Psychiatry, 56, 948–957.e4 (2017).
- 15) Yuge K., Nagamitsu S., Ishikawa Y., Hamada I., Takahashi H., Sugioka H., Yotsuya O., Mishima K., Hayashi M., Yamashita Y., BMC Psychiatry, 20, 445 (2020).
- 16) Lemoine P., Nir T., Laudon M., Zisapel N., J. Sleep Res., 16, 372–380 (2007).
- 17) Carter M. D., Calcutt M. W., Malow B. A., Rose K. L., Hachey D. L., J. Mass Spectrom., 47, 277–285 (2012).
- 18) Mahlberg R., Tilmann A., Salewski L., Kunz D., Psychoneuroendocrinology, 31, 634–641 (2006).
- 19) Fellenberg A. J., Phillipou G., Seamark R. F., Biomed. Mass Spectrom., 7, 84–87 (1980).
- 20) Sniecinska-Cooper A. M., Shah A. J., Dimitriou D., Iles R. K., Butler S. A., Bayford R., J. Chromatogr. B Analyt. Technol. Biomed. Life Sci., 978–979, 18–23 (2015).
- 21) Facciolá G., Hidestrand M., Bahr C. V., Tybring G., Eur. J. Clin. Pharmacol., 56, 881–888 (2001).
- 22) Webb S. M., Puig-Domingo M., Clin. Endocrinol. Rev, 42, 221–234 (1995).
- 23) Macchi M. M., Bruce J. N., Front. Neuroendocrinol., 25, 177–195 (2004).
- 24) Tetsuo M., Markey S. P., Colburn R. W., Kopin I. J., Anal. Biochem., 110, 208–215 (1981).
- 25) Francis P. L., Leone A. M., Young I. M., Stovell P., Silman R. E., Clin. Chem., 33, 453–457 (1987).
- 26) Azuma T., Ishida M., Hisamatsu K., Yunoki A., Otomo K., Kunitou M., Shimizu M., Hosomaru K., Mikata S., Mino Y., Chemosphere, 180, 476–482 (2017).
- 27) Suzuki A., Shibasaki H., Kasuya Y., Furuta T., J. Chromatogr. B Analyt. Technol. Biomed. Life Sci., 794, 373–380 (2003).