Regular Articles
Low-Field NMR to Characterize the Crystalline State of Ibuprofen Confined in Ordered or Nonordered Mesoporous Silica
2022 Volume 70 Issue 8 Pages 550-557
Details
2022 Volume 70 Issue 8 Pages 550-557
The crystalline state of ibuprofen (IBU) confined in mesoporous silica was characterized using low-field time-domain nuclear magnetic resonance (TD-NMR). IBU was loaded into ordered (Santa Barbara Amorphous-15 [SBA-15]; SBA) or nonordered mesoporous silica (Sylysia 320; SYL) using a well-known incipient wetness impregnation method. The dissolution profile of IBU from the silica was measured. The IBU-loaded SBA showed a relatively higher drug concentration at 10 and 20 min, which was typical of a supersaturated solution. However, it did not maintain that concentration. By contrast, the IBU-loaded SYL did not show such a dissolution profile in the early stage. To characterize the crystalline state of IBU confined in silica, the T1 relaxation time of IBU-loaded silica powder was measured and analyzed by curve fitting. Monophasic T1 relaxation was observed for IBU-loaded SBA. This may indicate that the amorphous phase, which has various molecular mobilities, was close to within the length of 1H spin diffusion. The TD-NMR technique, even if the sample is powder, can rapidly and easily measure NMR relaxation. Therefore, it can be useful toward fully characterizing the crystalline state of drugs confined in mesopores.
Mesoporous silicas have been applied to improve drug solubility because of their large surface area and mesopores. Drugs confined in the pores can be amorphous or in crystalline state different from the original.1–4) An amorphous drug is formed by dispersing on the surface of silica, which is the wall of the pores. In the pores, a spatial constraint confers good physical stability on a confined drug5); however, the interaction with a silica surface can make the drug chemically unstable.6,7) By contrast, a crystalline drug in the pores has been recognized, and is called nanocrystalline.6,8–10) We presumed that a nanocrystal could be dissolved rapidly due to its nanosized dimension, and may be more stable than the amorphous form because of its ordered structure.
To control the dissolution property and stability of a drug, it is crucial to fully characterize the crystalline state of the drugs confined in mesopores. Current techniques have provided valuable insights into confined drug molecules: for example, differential scanning calorimetry (DSC),11) Fourier transform IR spectroscopy (FTIR),12) NMR spectroscopy,1,13) broadband dielectric spectroscopy,14) and powder X-ray diffraction (PXRD) with pair distribution function analysis.15) Measuring 1H-NMR relaxation is valuable to characterize an amorphous and crystalline drug in porous silica using a high-power radio frequency NMR probe.9) However, the crystalline state of a drug in a porous silica has yet to be elucidated fully. To date, measuring NMR relaxation can evaluate the crystalline state of drug powder.16–19) While the drug molecule has protons, silica has few protons; therefore, the crystalline state of the drug-loaded silica can be evaluated by 1H-NMR relaxation. In the present study, NMR relaxation was measured using low-field time-domain NMR (TD-NMR). TD-NMR is a technique for measuring 1H-NMR relaxation of both solid and liquid materials and is not adequate for analysis of precise molecular structures. TD-NMR has been used widely in the pharmaceutical field; for example, not only to evaluate the crystalline state of a pure drug powder, but also to monitor the agglomeration process of nanosized drug in suspension,20) characterize the aggregation of protein in biologics,21) and analyze counterfeit drugs.22,23)
We sought to characterize the crystalline state of a drug confined in ordered or nonordered mesoporous silica using low-field TD-NMR. In particular, we sought to characterize drugs confined in ordered mesopores that generate a supersaturated profile. The study measured T1 relaxation time, which allowed us to evaluate not only an amorphous and crystalline phase qualitatively, but also to investigate the distance of their phases. As a model drug, ibuprofen (IBU) was used expecting an amorphous and crystalline state to coexist in the mesopores because of their low glass transition temperature (Tg). Silicas with ordered or nonordered mesopores were used in the expectation that their crystalline drug states differ, and nonporous silica was used as a control. To confirm the adsorption and crystalline state of a drug, nitrogen adsorption, modulated DSC (MDSC), and FTIR were used as conventional methods.
IBU (Hachidai Pharmaceutical Co., Osaka, Japan) was used for drug molecules. Santa Barbara Amorphous-15 (SBA-15; SBA) material with a pore diameter of 8 nm and a pore volume of 0.8–1.00 cm3/g was purchased from Sigma-Aldrich (St. Louis, MO, U.S.A.). Sylysia 320 (SYL) was kindly gifted by Fuji Silysia Chemical (Aichi, Japan). Aerosil 200 (AER) was kindly gifted by Nippon Aerosil (Tokyo, Japan). Dichloromethane (special grade reagent) was purchased from FUJIFILM Wako Pure Chemical Corporation (Osaka, Japan). For preparing fasted-state simulated gastric fluid (FaSSGF), ready-to-use powder and buffer concentrate were purchased from Biorelevant (London, U.K.). Other chemicals used for HPLC were of HPLC grade.
Preparation of Drug-Loaded Silica FormulationsDrug-loaded silica was prepared using an incipient wetness impregnation method in which void space is filled with a precise amount of highly concentrated organic drug solution. This process avoids time-consuming equilibration and filtration steps.3) A dichloromethane solution of IBU (500 mg in 10 mL) was added into 2 g of silica powder (SBA, SYL, and AER) using a syringe with a 22 G needle and mixed using a magnetic stirrer. The solvent was subsequently removed from the sample by drying in an oven at 40 °C for 24 h under reduced pressure. Silica powder was prepared in the same manner as drug-loaded silica. Dichloromethane was added into 2 g of silica powder using a syringe with a 22 G needle and a mixed magnetic stirrer. The solvent was subsequently removed in the same manner as the drug-loaded silica. As a control, the IBU powder purchased was used as a crystalline IBU, but an amorphous IBU could not prepared at ambient temperature because of its propensity to crystallize.24)
Nitrogen AdsorptionNitrogen adsorption measurements were recorded at −196 °C on a Belsorp-Mini X (MicrotracBEL, Osaka, Japan). All samples were degassed for 5 h at 40 °C before measurement using a Belsorp Vac III (MicrotracBEL). The low temperature during the degassing process was used to prevent drug degradation.3) The specific surface area was determined from the linear part of the Brunauer–Emmett–Teller method plot. The pore volume and pore diameter were determined from the Barrett–Joyner–Halenda method using the adsorption branch.
Sink Release and Dissolution ExperimentTo evaluate the drug content in loaded silica, a sink condition was installed as follows3): a FaSSGF without pepsin was prepared,25) and 0.5 wt% sodium lauryl sulfate was added to the FaSSGF. Drug-loaded silica (40 mg with approx. 8 mg of drug) was added to 20 mL of the medium. The suspension was stirred at room temperature for 24 h and centrifuged at 20600 × g for 10 min, and the supernatant was diluted with mobile phase and analyzed using HPLC.
To study the dissolution of drug-loaded silica, 20 mL of pH 1.2 medium (Japanese pharmacopoeia dissolution medium) was equilibrated in a shaking incubator (MSI-60; AS ONE, Osaka, Japan) at 37 °C. Drug-loaded silica (40 mg with approx. 8 mg of drug) was added to the dissolution medium and the suspension was shaken at 200 rpm. Dissolution was monitored over 120 min, and 0.2 mL sample aliquots were withdrawn at fixed time points, then 0.2 mL fresh pH 1.2 medium (preequilibrated to 37 °C) was added to dilute the dissolution medium. Samples were centrifuged at 20600 × g for 1 min (37 °C), and the supernatant was diluted with mobile phase and analyzed using HPLC. The dissolution profiles were compared by calculating the similarity factor (f2) using all sampling points. The f2 is a logarithmic, reciprocal, and square root transformation of the sum of the squared error, which measures the similarity in percent (%) dissolution between the two curves.26)
High-Performance Liquid Chromatographic AnalysisThe drug content was determined using an HPLC system (JASCO, Tokyo, Japan), which was equipped with a 4.6-mm diameter, 150-mm long Capcell Pak C18 MGII column (Osaka Soda, Osaka, Japan). The mobile phase comprised acetonitrile and 10 mM phosphoric acid buffer at a ratio of 60 : 40 (v/v). The other conditions were as follows: column temperature, 40 °C; flow rate, 1.0 mL/min; injection volume, 20 µL; and detector wavelength, 220 nm.
Modulated Differential Scanning Calorimetry (MDSC)MDSC curves were obtained using a Q2000 system (TA instruments, New Castle, DE, U.S.A.) under N2 flow. The sample was weighed on an aluminum pan and heated from −70 to 90 °C at 5 °C/min with an amplitude of ±1.0 °C and a period of 60 s.
Fourier Transform IR Spectroscopy (FTIR)FTIR spectra were obtained using an FT/IR-6600 (JASCO, Tokyo, Japan). The spectra of samples were collected using an attenuated total reflection accessory. Ten scans at 4-cm−1 resolution were averaged.
Time-Domain NMR (TD-NMR)1H T1 and 1H T2 relaxation behaviors of the samples were measured by TD-NMR using a Bruker Minispec mq20 apparatus (Bruker BioSpin, Billerica, MA, U.S.A.) at a 1H frequency of 20 MHz at 25 °C. A solid-echo sequence (90°–τ–90°) was used for the measurement.27,28) For the 1H T2 relaxation measurement, the following parameters were applied: scans = 64, recycle delay = 5 times of 1H T1 relaxation time (T1), and dummy scans = 2. 1H T2 relaxation time (T2) of drug-loaded silica was calculated from the decay according to biexponential curve fitting (Eq. 1) and that of drug powder was calculated according to Gaussian curve fitting (Eq. 2) using TD-NMR Analyze Software (Bruker BioSpin).
 | (1) |
 | (2) |
where M(t) and M0 are the transverse magnetization at times t and 0 with the decay, t is the acquisition time, and T2 is the T2 relaxation time. T2(short) and T2(long) are T2s that have fast or slow relaxation speeds, respectively. P2(short) and P2(long) are the proportions of protons that show T2(short) or T2(long), respectively.
After acquisition of the free induction decay using a solid-echo sequence with various recycle delays (20–2000 ms for IBU-loaded silica and 50–5000 ms for crystalline IBU powder), a saturation recovery curve of 1H T1 relaxation was obtained based on an average of the signal intensity at equilibrium, I0. 1H T1 was calculated according to Eq. 3 using TD-NMR Analyze Software.
 | (3) |
where I(t) and I0 are the signal intensities at time t and equilibrium, respectively, t is the time delay interval used during the NMR relaxation measurement, and T1 is the T1 relaxation time, which is a time constant that represents the recovery speed from the I(t) component to the equilibrium I0. Eq. 4 is a mathematical transformation of Eq. 3 for linearizing.
 | (4) |
When T1 relaxation behavior showed a biphasic character, the components were analyzed as follows: T1s and the proportion P were calculated using TD-NMR Analyze Software. T1 relaxation plotting data were analyzed by a least-squares exponential fitting procedure according to Eq. 5.
 | (5) |
where, for Eq. 5, I(t) and I0 are the signal intensity at time t and equilibrium, and t is the time delay interval used during the NMR relaxation measurement. T1(short) and T1(long) are T1s that have fast or slow relaxation speeds, respectively. P1(short) and P1(long) are the proportions of protons that show T1(short) and T1(long), respectively.
Unloaded SBA and SYL exhibited a type IV nitrogen adsorption isotherm, and AER exhibited a type II nitrogen adsorption isotherm. These results are consistent with SBA and SYL being mesoporous,29) and AER being nonporous silica30) (data not shown). The peak diameters of pore size distribution of unloaded SBA and SYL were 8 and 21 nm29) as nominal values, respectively, which are sufficiently large to incorporate IBU molecules.1,3) Table 1 shows a description of the specific surface area and pore volume. For the drug-loaded SBA and SYL, the surface area and pore volume were smaller than that before loading. For the loaded AER, the surface area was also smaller than that before loading. These results indicated that the drug was loaded in the SBA and SYL mesopores and was adsorbed on the AER surface.
| Samples | Specific surface area (m2/g) | Pore volume (cm3/g) |
|---|---|---|
| SBA | 702 | 0.96 |
| SYL | 269 | 2.20 |
| AER | 204 | Not available |
| IBU-loaded SBA | 277 | 0.65 |
| IBU-loaded SYL | 202 | 1.54 |
| IBU-loaded AER | 125 | Not available |
To determine whether the drug was adsorbed as a monolayer or multilayered, the theoretical monolayer coverage of loaded IBU was calculated using Eq. 6.1,31)
 | (6) |
where Xm is the quantity of adsorbate required for monolayer coverage of the adsorbent (g/g), SSA is the specific surface area estimated by N2 adsorption and the SSA values are described in Table 1, MW is the molecular weight of the adsorbate molecule (g/mol), Sc is the contact surface area for each adsorbate molecule (Å), and NA is Avogadro’s number. In the present study, it was assumed that a monolayer of IBU formed on the entire surface area, and that the area covered by an IBU molecule was roughly estimated at 50 Å2.1) In that assumption, the theoretical coverage of the IBU-loaded SBA, SYL, and AER was calculated as 0.473, 0.185, and 0.139 g per g of pure silica, respectively (i.e., 47.3, 18.5, and 13.9% (w/w)). In addition, the practical content of drug was confirmed using a sink release experiment. The IBU was loaded in SBA, SYL, and AER at a drug load of 23.8 ± 0.3, 25.3 ± 0.1, and 24.6 ± 0.6% (w/w) per pure silica, respectively, results consistent with the theoretical loading amount, 25%. The practical IBU content in SBA (23.8% (w/w)) was within the theoretical monolayer coverage (47.3% (w/w)), whereas the IBU content in SYL and AER (25.3 and 24.6% (w/w), respectively) was greater than the theoretical coverage (18.5 and 13.9% (w/w), respectively). That is, according to this model, the loaded IBU in SBA did not fully occupy the surface of silica, whereas that in SYL and AER was loaded as a multilayer adsorption.
Characterization of Drug-Loaded Silica by MDSC and FTIRThe MDSC curves of IBU-loaded SBA did not show a clear endothermic peak, while MDSC curves of IBU-loaded SYL showed a resolved endothermic peak of 68 °C with an unresolved shoulder at approx. 60 °C. The MDSC curve of IBU-loaded AER showed a resolved endothermic peak of 70 °C (Fig. 1). The discovery of these resolved endothermic peaks strongly supports the existence of crystalline IBU in drug-loaded SYL and AER. In contrast, the unresolved shoulder could indicate disordered IBU crystals in drug-loaded SYL.32) Nakai et al. reported DSC curves with two endothermic peaks of benzoic acid that were adsorbed on porous materials.33) In that study, benzoic acid was held in porous materials as crystal, disordered crystal, and in an amorphous state. The endothermic peaks of disordered crystal were lower than those of the crystals. In Fig. 1, the unresolved shoulder and resolved endothermic peak correspond to disordered crystalline and crystalline IBU, respectively. PXRD measurements indicate that IBU-loaded SBA showed a halo pattern. In contrast, IBU-loaded SYL and IBU-loaded AER showed diffraction patterns corresponding to crystalline IBU (Supplementary Fig. S1). These PXRD results are consistent with the results of the MDSC.

To investigate the molecular state of the loaded IBU, FTIR spectra were obtained (Fig. 2). All IBU-loaded silicas showed strong but relatively broad absorption associated with a carbonyl stretching vibration. These peaks were clearly different from the crystalline IBU peak. For example, drug-loaded SBA, SYL, AER, and crystalline IBU showed peaks of 1705, 1708, 1709, and 1698–1705 cm−1, respectively. The shift of the IBU carbonyl absorption band to the high-wavenumber region indicates that a strong IBU–IBU interaction corresponding to the crystalline form was broken.37) These FTIR results support the existence of amorphous IBU in drug-loaded silicas. The MDSC and FTIR results indicate that IBU-loaded SBA contains an amorphous IBU. In contrast, IBU-loaded SYL and IBU-loaded AER contain amorphous and crystalline (or disordered crystalline) IBU. 13C solid-state NMR spectra of IBU-loaded SYL and IBU-loaded AER showed characteristic signals derived from crystalline IBU, which indicate the existence of crystalline IBU in both IBU-loaded SYL and IBU-loaded AER (Supplementary Fig. S3).

The T1 and T2 relaxation behavior of the drug-loaded silicas was measured (Figs. 3, 4) and the values are summarized in Table 2. The TD-NMR technique used observes relaxation of 1H nuclei; thus, the possible sources of the NMR signal are adsorbed water and/or a drug. The theoretical 1H proportion of drug was calculated considering the following factors: proton mass, molecular weight, and the weight ratio of component. The weight ratio was calculated by the drug content and the water content, which were measured using a sink release experiment and volumetric Karl Fischer titration, respectively. The water content of the IBU-loaded SBA, SYL, and AER was 2.3, 1.5, and 1.0%, respectively. The theoretical 1H proportion of IBU was 85, 91, and 94% for the loaded SBA, SYL, and AER, respectively. Notably, it was confirmed that most of the observed 1H in Figs. 3 and 4 belonged to 1H of the drug. For other hypotheses, although the 1H of the silanol group of silica might be a source of the NMR signal, the silanol protons were ignored because the ratio of 1H to the mass of silica would be extremely small.
To visualize whether the curves were fitted to a monoexponential equation, the observed signals (a) were transformed (b) according to Eq. 5.
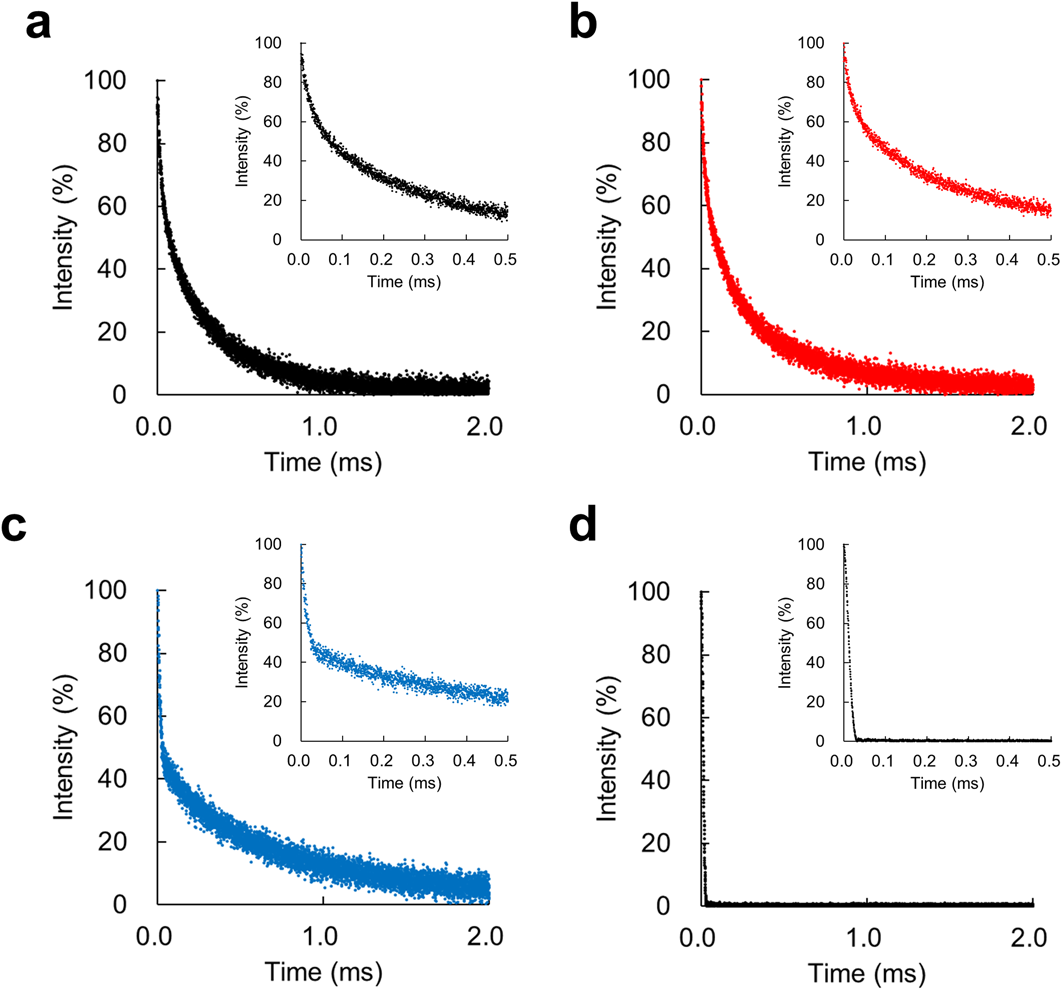
(a) IBU-loaded SBA-15, (b) IBU-loaded Sylysia 320, (c) IBU-loaded Aerosil 200, and (d) crystalline IBU powder. The inset is an enlarged view at short echo times.
| Samples | Single-component fitting analysisa) | Bicomponent fitting analysisb) | Single-component fitting analysisc) | Bicomponent fitting analysisd) | ||||||
|---|---|---|---|---|---|---|---|---|---|---|
| T1 (ms) | T1(short) (ms) | T1(long) (ms) | P1(short) (%) | P1(long) (%) | T2 (µs) | T2(short) (µs) | T2(long) (µs) | P2(short) (%) | P2(long) (%) | |
| IBU-loaded SBA | 107.0 ± 1.1 | Not fitted | Not fitted | Not fitted | Not fitted | Not fitted | 30.8 ± 0.9 | 304.1 ± 5.0 | 39.1 ± 0.4 | 60.9 ± 0.4 |
| IBU-loaded SYL | Not fitted | 60.0 ± 1.7 | 572.9 ± 104.2 | 87.4 ± 1.7 | 12.6 ± 1.7 | Not fitted | 35.5 ± 2.8 | 357.1 ± 4.7 | 41.6 ± 0.3 | 58.4 ± 0.3 |
| IBU-loaded AER | Not fitted | 92.2 ± 6.9 | 476.5 ± 14.6 | 64.4 ± 2.5 | 35.6 ± 2.5 | Not fitted | 14.2 ± 0.4 | 591.9 ± 18.9 | 57.4 ± 0.1 | 42.6 ± 0.1 |
| Crystalline IBU | 648.5 ± 0.4 | Not fitted | Not fitted | Not fitted | Not fitted | 10.7 ± 0.0 | Not fitted | Not fitted | Not fitted | Not fitted |
a), b), c), and d) calculated according to Eqs. 3, 5, 2, and 1, respectively. Each value represents the mean ± standard deviation (n = 3).
After the acquisition of free induction decay with various recycle delays of the T1 relaxation curve (Fig. 3a), these experimental points were transformed according to Eq. 4 to visualize T1 values and facilitate their interpretation (Fig. 3b). The inverse of the slope corresponds to the T1 value of each sample. T1 curves of IBU-loaded SYL and IBU-loaded AER exhibited biphasic behavior (Fig. 3b) and the curves were well fitted to biexponential Eq. 5. The T1(short) and T1(long) values were calculated using Eq. 5 and are summarized in Table 2. The T1(short) and T1(long) values likely correspond to amorphous and crystalline IBU phases, respectively (see Discussion). By contrast, the T1 relaxation curve of the IBU-loaded SBA was fitted to monoexponential Eq. 3, and a single T1 value was calculated for IBU-loaded SBA (Table 2). The monophasic behavior of IBU-loaded SBA may indicate that two or more phases were close within the length of 1H spin diffusion. Another point to observe in the T2 relaxation is that the decay did not exhibit monophasic behavior but exhibited biphasic or more behaviors (Figs. 4a–c), which may indicate that IBU exists in several crystalline states. In addition, T1 and T2 relaxation of the crystalline IBU powder were also measured as a control (Figs. 3, 4, and summarized in Table 2). The T1 value of crystalline IBU was close to the T1(long) values of IBU-loaded SYL and IBU-loaded AER and the T2 value of crystalline IBU was close to the T2(short) value of IBU-loaded AER.
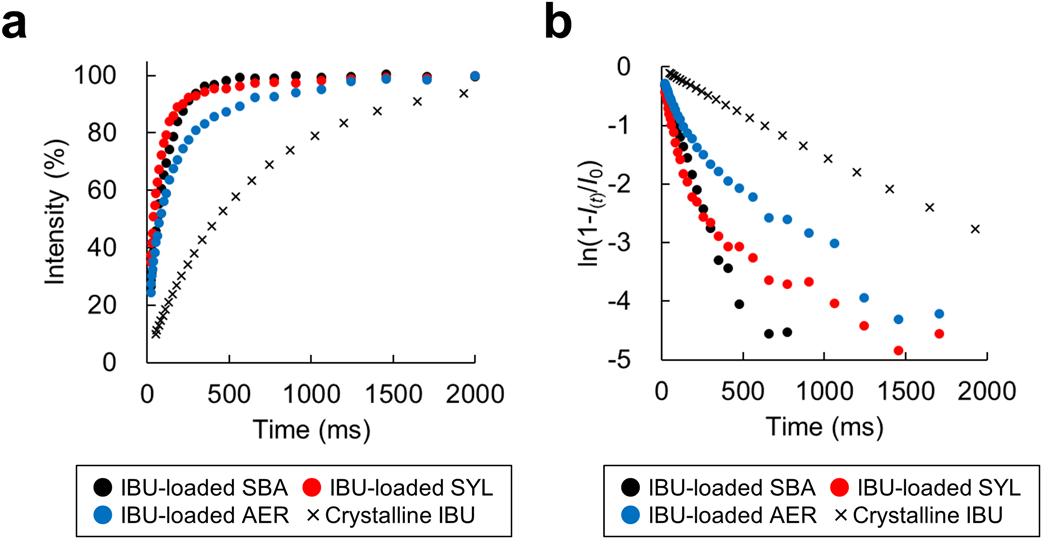
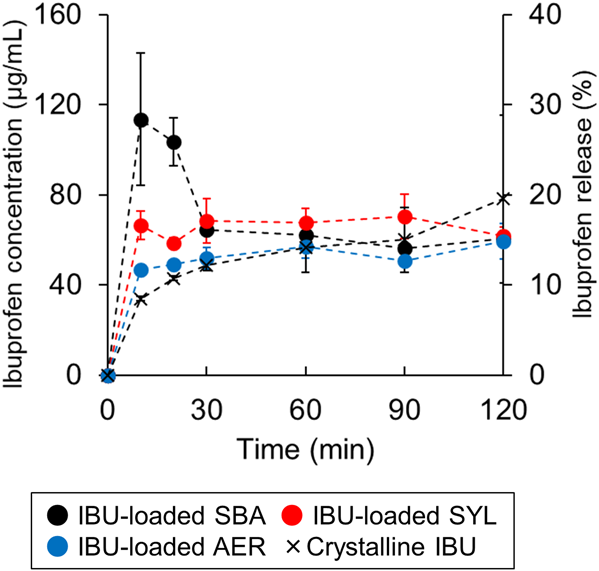
Dissolution Profile of IBU-Loaded SilicaThe dissolution profile of IBU from the silica was measured (Fig. 5). The IBU-loaded SBA showed a relatively higher drug concentration at 10 and 20 min, which was typical of supersaturated solution; however, it did not maintain that concentration. By contrast, the IBU-loaded SYL and loaded AER did not show such a dissolution profile in the early stage as loaded SBA did. To compare their dissolution profiles, a similarity factor (f2) was introduced. The f2 values between the crystalline IBU and loaded SBA, loaded SYL, and loaded AER were 49, 66, and 78, respectively. Generally, f2 values greater than 50 (50–100) ensure sameness or equivalence of the two profiles. Conversely, when f2 values are less than 50, those profiles are regarded as different.38,39) Thus, the dissolution profile of IBU-loaded SBA was regarded as distinct from the crystalline IBU.
Each value represents the mean ± standard deviation (n = 3).
As shown in Fig. 5, IBU-loaded SBA generated a supersaturated solution compared with IBU-loaded SYL and IBU-loaded AER. There are various methods to characterize drug-loaded mesoporous silica that exhibit high solubility. For example, Mellaerts et al. used 29Si NMR to investigate the cause of the higher solubility of itraconazole-loaded SBA-15 upon humid storage.13) While they found that hydroxylation of silanol groups on the surface of SBA-15 was the cause, the property of the drug was not evaluated directly. The FTIR spectra of etravirine-loaded SBA-15 was also measured to investigate the release process of the drug.12) In that study, the stretching vibration of the nitrile groups of etravirine was evaluated, which also allowed for in situ measurements in the silica suspension, but only for drugs with specific functional groups, such as a nitrile group. Only a few methods can be used to evaluate the properties of drug-loaded mesoporous silica that shows high solubility. The development of a technology that can evaluate the drug itself regardless of the functional group was desired. Therefore, we decided to measure the 1H-NMR relaxation of the drug by NMR and report the dissolution profile of the drug, noting that the drug has 1H and silica has almost no 1H. The T1 relaxation of solid drugs shows a larger difference between crystalline and amorphous than the T2 relaxation16); therefore, the T1 relaxation was mainly measured and its behavior was compared between IBU-loaded SBA, IBU-loaded SYL, and IBU-loaded AER.
First, we will discuss the NMR relaxation of IBU-loaded SBA that generated supersaturated solutions. IBU-loaded SBA showed monophasic T1 relaxation, while IBU-loaded SYL and IBU-loaded AER showed biphasic T1 relaxation. As shown by MDSC, IBU-loaded SBA could contain an amorphous IBU (Fig. 1). In addition, the T2 relaxation of IBU-loaded SBA showed at least biphasic behavior (Fig. 4a), which indicates that IBU-loaded SBA contains two or more phases that have a variety of molecular mobilities. In other words, IBU-loaded SBA consisted of IBU in the amorphous phase, which had two or more molecular mobilities. However, the T1 relaxation of IBU-loaded SBA was monophasic. The reason for the discrepancy between T1 and T2 relaxation results can be explained as follows. The monophasic behavior of IBU-loaded SBA may indicate that the amorphous phase, which has various molecular mobilities was within the length of 1H spin diffusion. Munson and colleagues measured T1 relaxation of solid materials used in pharmaceuticals by high-resolution NMR and investigated crystal defects of lactose,40) miscibility of amorphous solid dispersion,41) and particle distribution of dicumarol42) based on 1H spin diffusion. Munson and colleagues explain what the observed monophasic T1 relaxation behavior means. If the drug domains are closer to each other than the length scale of 1H spin diffusion, magnetization is efficiently transferred from a slower- to a faster-relaxing domain, and a uniform T1 value is observed. Generally, the amorphous phase is typically more mobile than the crystalline phase; that is, the former can relax faster. In the case of IBU-loaded SBA, the characteristic small and uniform mesopores could have brought the amorphous phases closer and magnetization may be transferred from a relatively immobile amorphous phase to a relatively mobile amorphous phase.
Next, we will discuss the NMR relaxation of IBU-loaded SYL and IBU-loaded AER that did not generate supersaturated solutions. For example, IBU-loaded SYL and IBU-loaded AER showed biphasic T1 relaxation (Fig. 3b), which could be due to amorphous and crystalline phases, a finding that was supported by MDSC (Fig. 1). Here, we will discuss the correspondences of T1(short) and T1(long). It is well known that the relationship between relaxation times and rotational correlation times reflects the molecular mobility of compounds. In general, in the solid state, the lower the molecular mobility, the longer the T1 relaxation time. Typically, the amorphous phase is more mobile than the crystalline phase, Thus, the T1(short) and T1(long) values correspond to amorphous and crystalline IBU, respectively. The T1(long) values of IBU-loaded SYL and IBU-loaded AER were 572.9 ± 104.2, 476.5 ± 14.6 ms, respectively, which were close to 648.5 ± 0.4 ms, the T1 value of crystalline IBU (Table 2), suggesting that the T1(long) value of IBU-loaded SYL and IBU-loaded AER correspond to the crystalline phase. On the other hand, the T1(short) values of IBU-loaded SYL and IBU-loaded AER were 60.0 ± 1.7 and 92.2 ± 6.9 ms, respectively, which were close to 107.0 ± 1.1 ms, the T1 value of IBU-loaded SBA (probably in the amorphous phase) (Table 2), suggesting that the T1(short) value of IBU-loaded SYL and IBU-loaded AER corresponds to the amorphous phase. The fitting analysis allows us to estimate the proton ratios corresponding to the amorphous and crystalline phases as Pshort and Plong, respectively (Table 2). It will be necessary in the future to compare and verify the proton ratios estimated by T1 relaxation with amorphous/crystalline ratios estimated by Raman spectroscopy, for example.
Regarding the order of T1 values of IBU-loaded SBA and IBU-loaded SYL, corresponding with the amorphous phase, our results are consistent with those reported in the literature. For example, Miura et al. measured the molecular mobility of an amorphous drug, K-832 confined in mesoporous silica using high-resolution NMR.43) Based on the 13C T1ρ measurement, they suggested that the molecular mobility of the drug in 2.5-nm diameter pores was lower than that in 25-nm diameter pores. As shown in Table 2, the magnitude of our T1 values was consistent with their suggestion. The T1 value of IBU in the 8-nm diameter pores (SBA) was significantly larger than the T1(short) of IBU in the 21-nm diameter pores (SYL). That is, amorphous IBU in the SBA has lower molecular mobility than that in the SYL. From the above, we conclude that the T1(short) and T1(long) values correspond to the amorphous and crystalline phases, which will characterize the solubility profile of IBU-loaded in SYL and IBU-loaded AER.
Finally, the T2 relaxation of IBU-loaded silicas will be discussed. All T2 relaxations were biphasic (or more) rather than monophasic (Fig. 4). These results are consistent in that all IBU-loaded silicas contained two or more phases. However, we could not clarify which phase corresponded to T2(short) and T2(long), except for the IBU-loaded AER. The T2(short) value of IBU-loaded AER was the same as the T2 values of crystalline IBU (Supplementary Fig. S2), suggesting that the T2(short) of IBU-loaded AER would correspond to the crystalline phase. Regarding the magnitude of T2 value of IBUs, Azaïs et al. measured the 1H T2 value of IBU confined in mesoporous silica with a pore diameter of ca. 12 nm using high-resolution NMR.1) They reported that the T2 values were 4.6–16.6 ms, which are not consistent with our results. The T2 values in our study were μs scale (Fig. 4 and Table 2). There are two possible explanations for this inconsistency. One might be the difference of magnetic field strength of the NMR instrument used. Azaïs et al. used a high field spectrometer (B0 = 7.05 T) and by contrast, we used low-field relaxometry (B0 = 0.47 T). The other explanation might be the difference in the type of mesoporous silica used in their study. Azaïs et al. used MCM-41 mesoporous silica while we used SBA-15 mesoporous silica. Grünberg et al. evaluated the hydrogen bonding of water confined in mesoporous silica using 1H-NMR spectra compared between MCM-41 and SBA-15. They noted that some strongly bound water molecules exist at the inner surface of SBA-15 that were unlikely to occur on MCM-41.44) Therefore, the IBU molecules could be strongly bound with in the SBA, and their T2 value might be shorter than that absorbed on MCM-41.
In summary, IBU-loaded SBA that generated a supersaturated solution was characterized by monophasic T1 relaxation. We conclude that monophasic T1 relaxation could be explained by the characteristic small and uniform mesopores of SBA, which may have brought the amorphous phases within the length of spin diffusion. It is noteworthy that the IBU-loaded SBA, which generated a supersaturated solution, showed monophasic T1 relaxation, while the IBU-loaded SYL, which did not, showed biphasic T1 relaxation. In other words, by measuring the T1 relaxation of drug-loaded silica, it may be possible to characterize samples with different dissolution profiles. In particular, we characterized the IBU-loaded SBA by its T1 relaxation because the difference of T1 values between amorphous and crystalline for solid samples is larger than that of T2 relaxation.16) Using this feature, the crystalline states of the drugs in SYL and AER could be distinguished as T1(short) and T1(long) values. It is also worth noting that a benchtop and low-field instrument was applied in this study. This TD-NMR technique, even if the sample is powder, can rapidly and easily measure T1 relaxation. Therefore, it can be expected to be used not only in the laboratory, but also in factory settings for process control. The difference between T1 values may offer a way to check for drug confinement to mesopores during manufacturing by taking advantage of the character of low-field NMR that can be determined on a desktop.
The remaining issue in this study is the 1H quantification of each phase of T1 and T2 relaxation. Another concern is that the number of fitting components is left to the analyst. In other words, the question is whether T2(short) and T2(long) are sufficient as the fitting components, and whether T2(middle) is necessary. This issue might be solved by converting a relaxation time to a distribution of relaxation population, such as by using an inverse Laplace transformation.9,45)
Regarding the length of spin diffusion in T1 relaxation measurement in this study, the exact domain size, which is the distance at which 1H spin diffusion works effectively, could not be estimated because the domain size is calculated from the spin diffusion coefficient. In general, although the domain size estimated by T1 relaxation of a polymer system is commonly mentioned as 20–50 nm using the spin diffusion coefficient of an organic polymer,41) it might be unsuitable for this study to estimate the exact domain sizes because IBU was used as the model drug in this study.
This work was supported by the Japan Society for the Promotion of Science (JSPS) KAKENHI [Grant Nos. 20K06986, 20K15970, and 22K15261].
The authors declare no conflict of interest. The Laboratory of Pharmaceutical Technology, University of Toyama, is an endowed department supported by an unrestricted grant from Nichi-Iko Pharmaceutical Co. (Toyama, Japan).
This article contains supplementary materials.