Experimental
ReagentsThe MgO tablet formulations Magmitt® (330 mg tablet) (lot. 19J302, Kyowa Chemical Industry Co., Ltd., Kagawa, Japan; Tab_A), magnesium oxide (330 mg tablet) [Kenei] (Lot. 9B13, KENEI Pharmaceutical Co., Ltd., Osaka, Japan; Tab_B), magnesium oxide (330 mg tablet) [Mochida] (lot. B778, Mochida Pharmaceutical Co., Ltd., Tokyo, Japan; Tab_C), magnesium oxide (330 mg tablet) [Mylan] (lot. M23BB7, Mylan N.V., Osaka, Japan; Tab_D) and magnesium oxide(330 mg tablet) [Yoshida] (lot. 919118, Yoshida Pharmaceutical Co., Ltd., Tokyo, Japan; Tab_E) were analyzed. The non-APIs for each tablet formulation are shown in Table 1.13–17)
Table 1. Nonactive Pharmaceutical Ingredients of MgO Tablet Formulations
| MgO tablet formulations | Non-APIs |
|---|
| Tab_A | MCC, Cr-CMC-Na, Corn starch, Calcium stearate |
| Tab_B | Calcium stearate, MCC, Cr-CMC-Na, Fragrance |
| Tab_C | CMC-Ca, CP, Light anhydrous silicic acid, Calcium stearate, MCC |
| Tab_D | L-HPC, Cr-CMC-Na, Aspartame, Calcium stearate |
| Tab_E | CMC-Ca, CP, Calcium stearate, Light anhydrous silicic acid, MCC |
These nonactive pharmaceutical ingredients were cited from manufacture’s forms [13–17]. *: Low-substituted hydroxypropyl cellulose.
MgO fine granules, Ju-kama [Yoshida] (lot. Y19426) were purchased from Yoshida Pharmaceutical Co., Ltd. (Tokyo, Japan).
The magnesium hydroxide (Mg(OH)2) tablet formulation, Milmag®(350 mg tablet) (lot. 8L2) was purchased from Kyowa Pharmaceutical Industry Co., Ltd. (Osaka, Japan).
Mg(OH)2 (lot. YLG224) was purchased from FUJIFILM Wako Pure Chemical Corporation (Osaka, Japan).
Microcrystalline cellulose (CEOLUS® UF-702, MCC) and L-hydroxypropyl cellulose (LH-21, L-HPC) were purchased from Asahi Kasei Chemicals (Tokyo, Japan) and Shin-Etsu Chemical (Tokyo, Japan), respectively. Croscarmellose sodium (Ac-Di-Sol®, Cr-CMC-Na) was purchased from FMC Health and Nutrition (Philadelphia, United States). Carmellose calcium (E.C. G-505®, CMC-Ca) were purchased from Gotoku Chemical (Tokyo, Japan). Crospovidone (Polyplasdone™ XL-10, CP) was purchased from Ashland (Covington, United States).
Preparation of Model MgO Tablet Formulations (MMTs)MMTs were prepared by direct compression with the following composition: MMT1: MgO fine granules (MgO, 80%), MCC (10%) and Cr-CMC-Na (10%); MMT2: MgO (80%), CMC-Ca (10%) and CP (10%); MMT3: MgO (80%), L-HPC (10%) and Cr-CMC-Na (10%); MTT4: MgO (90%) and MCC (10%); MTT5: MgO (90%) and Cr-CMC-Na (10%); MTT6: MgO (90%) and CMC-Ca (10%); MTT7: MgO (90%) and L-HPC (10%); MTT8: MgO (90%) and CP (10%). Next, designated amounts of MgO, disintegrants and binders were accurately weighed and then mixed well. The final mixture was compressed at 2 kN into a round tablet, 10 mm in diameter, using a tableting machine (SSP-10A, Shimazu Corporation, Kyoto, Japan).
Humidification of the MgO Tablet FormulationsAll MgO tablet formulations removed from PTP and MMTs were sealed in a tapper with saturated saline solution and stored for a certain period in a small incubator (FF-10; Tokyo Garasu Kikai Co., Ltd., Tokyo, Japan) at 40 °C. As a result, humidified conditions of 40 °C and 75% relative humidity (RH) were achieved and a humidified sample was used for each measurement.
Measurement of NIR SpectraThe NIR spectra of the MgO tablet formulations were measured by a diffuse reflection method using a NIR spectrometer (Spectrum One NTS, PerkinElmer, Inc., Waltham, MA, U.S.A.) with a diffuse reflection unit attached (NIRA, PerkinElmer, Inc.) at a wavenumber resolution of 8 cm−1 employing 32 scans across the wavelength range of 4000–12000 cm−1. The NIR spectra of fluorocarbon polymers were also acquired as background. The normalized treatment of the originally obtained spectrum was used for analysis.
Measurement of Microscopic IR SpectroscopyThe surface of the MgO tablet formulations was carefully thinly scraped and used for measurement. NICOLET iN10 (Thermo Scientific, Yokohama, Japan) was used to collect the IR spectra of tablet formulations using the reflection method. The background was measured in gold, and the sample scans were recorded at 8 cm−1 spectral resolution with 16 scans across the range of 4000–675 cm−1. Data were analyzed using OMNIC Picta chemical imaging software (Thermo Scientific). Mapping was performed using the absorbance ratios of 3700 and 3400 cm−1 (AR 3700/3400 value) as indices.
Mapping condition: aperture size, 100 × 100 µm; step size, 100 µm, measurement area, 2000 × 2000 µm (20 point × 20 point).
The standard IR spectra of Mg(OH)2, MgO, MCC and L-HPC were measured in “spectrum mode” under the same conditions described above.
TG MeasurementsDried and humidified MgO tablet formulations were crushed with a mortar and pestle and used for measurements. TG-DTA tests were performed using a thermogravimetry analyzer (Thermo plus EVO2, TG-DTA8122, Rigaku, Japan). A 5 mg sample was placed into an aluminum crucible and then heated from 20 to 490 °C at a rate of 10 °C/min. The reference material was air.
Measurement of TD-NMRThe 1H T2 relaxation behavior (T2-value) of each sample was measured using TD-NMR. A minispec mq20 (Bruker BioSpin, Billerica, MA, U.S.A.) was used as the device, and a Carr–Purcell–Meiboom–Gill (CPMG) sequence was used for the measurement (measurement conditions: τ = 2.5 ms, data points = 2500, number of scans = 8, Recycle delay = 10 s). The 1H T2-value was calculated according to Eq. (1). Calculation of T2-value was performed using TD-NMR analysis software (Bruker BioSpin Corp.) where M(t) and M0 are the transverse magnetizations at times t and 0, with t being the acquisition time and T2 being the T2-value.
 | (1) |
A petri dish was filled with 5 mL of water, and tablet formulations were placed therein. The time required for the tablet formulations to completely disintegrate was measured and used as the disintegration time.
Results and Discussion
Mass Measurements of Dried and Humidified MgO Tablet FormulationsIn most of the MgO tablet formulations, the mass of the tablet formulations increased in a storage period-dependent manner under humid conditions of 40 °C and 75% relative humidity (RH). In contrast, no change in mass was observed in Tab_C even when stored for up to 28 d under humid conditions (Fig. 1), indicating that the increase in mass observed in other formulations excluding Tab_C reflects the amount of moisture absorbed. Therefore, these results suggest that Tab_C has the property of being resistant to absorbing moisture, unlike the other tablet formulations. Oka et al. reported that the diameter of the particles forming Tab_C is larger than that of other MgO tablets (i.e., median diameter of particles for Tab_A, Tab_B, Tab_C, Tab_D and Tab_E were 92.0, 83.6, 148.4, 85.2, and 77.8 µm, respectively).18) We performed mapping measurements on MgO tablets by micro-Raman spectroscopy and confirmed that MgO aggregates and large particles are distributed in Tab_C (Supplementary Fig. S1). Therefore, since the contact area between the water molecules that invade by humidification and the surface of all particles is low, the mass change due to humidification may be small.
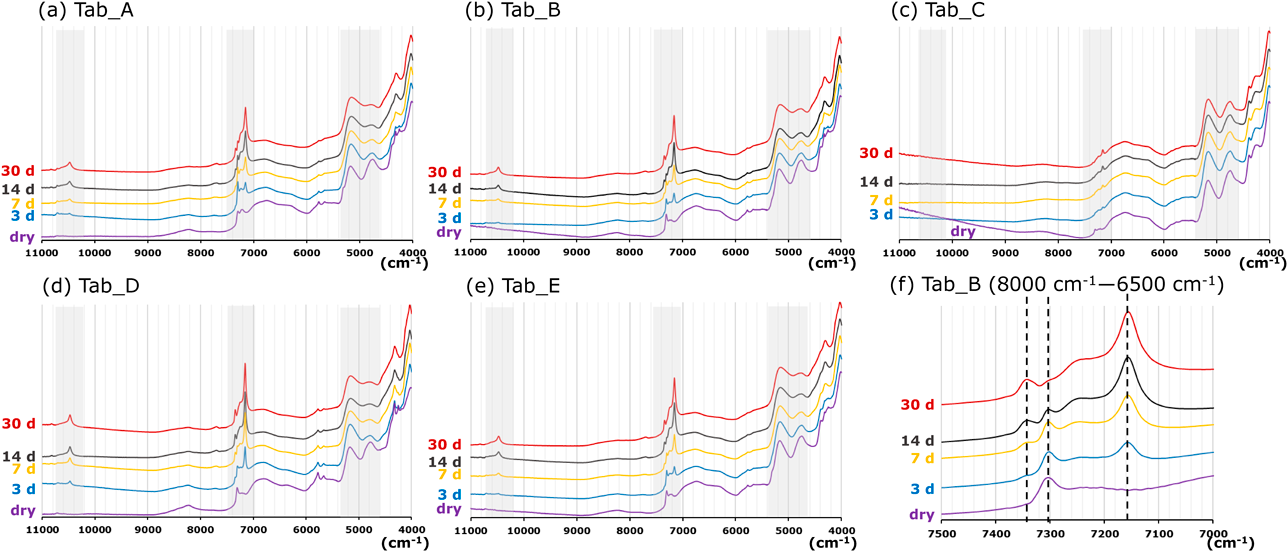
NIR Spectrum of Dried and Humidified MgO Tablet FormulationsWhen the MgO tablet formulations were stored at 40 °C and 75% RH, a sharp peak at approximately 7200 and a weak peak at approximately 10500 cm−1 appeared, except for Tab_C. In contrast, no peak was observed in that region of MgO tablet formulations immediately after being removed from the PTP (dried tablet formulation). Moreover, in the above four tablet formulations, the peaks at approximately 7200 and 10500 cm−1 increased in a humidification period-dependent manner from 3 to 30 d (Figs. 2a, b, d, e). Fujioka et al. measured the IR spectrum of Mg(OH)2, which displayed a sharp peak at approximately 3700 cm−1, and reported that this peak was due to the stretching vibration of the hydroxyl group.19) These results suggest that in the NIR region, the peaks at approximately 7200 and 10500 cm−1 observed in the humidified MgO tablet formulations in this study correspond to the first and second overtones of the stretching vibration of the hydroxyl group, respectively.
NIR spectra were also obtained for Mg(OH)2 and Mg(OH)2-containing tablet formulations, and a sharp peak at approximately 7200 and a weak peak at approximately 10500 cm−1 were observed, as in the case of the humidified MgO tablet formulations (Supplementary Fig. S2), indicating that those peaks of the MgO tablet formulations reflect the change from MgO to Mg(OH)2 by humidification. Looking at 7000 to 7500 cm−1 in more detail, the peak of 7300 cm−1 observed in dried tablet formulations was attenuated in a humidification period-dependent manner, and conversely, the peak of 7350 cm−1, not observed in dried tablet formulations, was increased (Fig. 2f for Tab_B). A weak peak in Mg(OH)2 and Mg(OH)2-containing tablet formulations was observed at 7350 cm−1 (Supplementary Fig. S2). Those peaks in this region may reflect structural changes in the hydroxyl group, but further evaluation is required to clarify those peaks. Focusing on individual MgO tablet formulations, a sharp peak at approximately 7200 cm−1 appeared in humidified Tab_D from an early stage (3 d) compared to other MgO tablet formulations (Fig. 2d). In contrast, in humidified Tab_C, the peak at approximately 7200 cm−1 was significantly weaker than that of other MgO tablet formulations (Fig. 2c). These results suggest that the reaction rate from MgO to Mg(OH)2 due to humidification differs depending on the tablet formulations.
Next, we focused on peaks at approximately 5200 cm−1, which reflect the combination of free hydroxyl groups derived from water, and those at 4800 cm−1, which reflect the combination of carbon-bonded hydroxyl groups derived from non-APIs such as MCC. In the MgO tablet formulations, both peaks (approximately 4800 and approximately 5200 cm−1) were clearly visible in the dried tablet formulations. However, with humidification, the boundary between these two peaks disappeared, and the peak at approximately 4800 cm−1 changed to a shoulder connected to the peak at approximately 5200 cm−1 for the MgO tablet formulations, where a sharp peak appeared at approximately 7200 cm−1 by humidification (i.e., except for in Tab_C). From this result, with the exception of Tab_C, the peak at approximately 5200 cm−1 increased due to water being taken into the tablet formulation by humidification and overlapped with the peak at approximately 4800 cm−1 (Fig. 2). On the other hand, in Tab_C, the shape of both peaks was clearly observed even after 30 d of humidification (Fig. 2c), so this tablet formulation might be less likely to absorb moisture than other MgO tablet formulations, which supports the results of mass measurement (Fig. 1).
Visual Evaluation of Dried and Humidified MgO Tablet Formulations by Microscopic IR SpectroscopyThe change from MgO to Mg(OH)2 by humidification was visually evaluated by microscopic IR spectroscopy. Figure 3 shows the standard IR spectra of Mg(OH)2, MgO and non-APIs (MCC, L-HPC, CMC-Ca, Cr-CMC-Na and CP). As previously reported, a sharp peak was observed at approximately 3700 cm−1 for Mg(OH)2,19) but no peak was observed in that region from others (Fig. 3). Broad peaks were observed in the region of 700 to 1000 cm−1 in Mg(OH)2 and MgO (Figs. 3a, b). In contrast, a hydrocarbon-derived peak was observed at approximately 2900 cm−1 in non-APIs (Figs. 3c–g). The AR3700/3400 values for Mg(OH)2, MgO and others were greater than 3.0, approximately 0.7 and less than 0.2, respectively. Therefore, we deduced that the change from MgO to Mg(OH)2 could be visually evaluated by creating a mapping image using AR3700/3400 values as an index.
Figure 4 shows the mapping images of dried and humidified tablet formulations (for 1, 3, 7 and 30 d) for each MgO tablet formulation using AR3700/3400 values as an index. In the mapping image of most MgO tablet formulations, the high-ratio (red) region increased with increasing humidification time. In Tab_D, where the peak at approximately 7200 cm−1 in the NIR spectrum appeared most prominently, changes associated with humidification in this mapping image were noticeably observed after 3 d of humidification. The spectra obtained in the high-ratio (red) region of the 30 d humidification mapping image in Tab_A, Tab_B, Tab_D and Tab_E were similar to the standard spectrum of Mg(OH)2 (Fig. 5a, Supplementary Figs. S3a, c, e). These results suggest that those tablets changed from MgO to Mg(OH)2 in a time-dependent manner in response to humidification, similar to the result in the NIR method. However, we should note that the AR3700/3400 values in the high-ratio (red) region were significantly lower than the value of the standard spectrum of Mg(OH)2 (Fig. 3). This indicates that the high-ratio (red) region is not occupied only by Mg(OH)2 but also indicates that the rate of change from MgO to Mg(OH)2 is relatively high. In the spectra obtained from the low-ratio (green) regions, the peak was observed at not only 3700 cm−1 but also 2900 cm−1, signifying a hydrocarbon-derived peak (Fig. 5b, Supplementary Fig. S3b, d, f). This indicates that the abundance ratio of non-API was higher than that of MgO or Mg(OH)2 at each measurement point in the low-ratio (green) region, although the production of Mg(OH)2 progressed slightly.
In Tab_C, although a color change in the mapping image was observed, the high-ratio (red) region was not observed even after 30 d of humidification (Fig. 4). The spectra obtained from the relatively low-ratio (blue) region in the 30 d humidification mapping image were quite similar to the non-API standard spectra (Fig. 5d), and the AR3700/3400 value was low (approximately 0.3). These results suggest that the rate of change of MgO to Mg(OH)2 was quite low in each measurement point of the region, unlike other MgO tablet formulations. On the other hand, the spectra obtained from the relatively high-ratio (yellow) region exhibited a sharp peak at 3700 cm−1, but absorption at approximately 3400 cm−1 was higher than that of other MgO tablet formulations (Fig. 5c). Therefore, the AR3700/3400 value was lower than that of other MgO tablet formulations. Comparing the spectra in this region to the standard spectra of Mg(OH)2, MgO and non-APIs, the distribution of Mg(OH)2 and MgO, but not non-APIs, is suggested because a peak from 700 to 1000 cm−1 was clearly observed. Furthermore, the abundance ratio of MgO was higher than that of Mg(OH)2, considering the AR3700/3400 value. Thus, the evaluation by microscopic IR spectroscopy confirmed that Tab_C is unlikely to change from MgO to Mg(OH)2 in response to humidification. As mentioned above, these findings strongly suggest that microscopic IR spectroscopy can be used to visually evaluate changes in API to Mg(OH)2 due to humidification in the MgO tablet formulations. Focusing on the mapping image of dried Tab_C, it was observed that the AR3700/3400 value was generally lower than that of other formulations. That is, the blue area in the mapping image of Tab_C occupied a larger area than that of other formulations (Fig. 4). We believe that the dried MgO tablet formulations contain a very small amount of Mg(OH)2 and that the abundance ratio of Mg(OH)2 in the dried Tab_C is relatively lower than the ratio in the other formulations.
In standard spectra, broad peaks were observed in the region of 700 to 1000 cm−1 in Mg(OH)2 and MgO (Figs. 3a, b). To confirm the distribution of MgO in dried MgO tablet formulations, we created a mapping image using the peak area from 700 to 1000 cm−1 (PA700–1000 values) as an index. Details are described in the supplementary materials (Supplementary Figs. S4, S5).
TG Measurement of Dried and Humidified MgO Tablet FormulationsFigure 6 shows the TG curves of dried and humidified MgO tablet formulations. In Tab_A, a mass reduction of 1 to 2% due to evaporation of adsorbed water was observed up to 120 °C, and a decrease of approximately 10% was observed in the range of 120 to 490 °C (Fig. 6a). Since some non-APIs caused mass reduction due to thermal decomposition in this temperature range, but not for MgO (Supplementary Fig. S6), the mass reduction for dried Tab_A in this temperature range was indicated to be due to the non-APIs. In humidified Tab_A, the rate of mass reduction from 120 to 490 °C increased with the humidification period (Fig. 6a). Mg(OH)2 causes mass reduction by desorption of water molecules in the temperature range of 300 to 400 °C (Supplementary Fig. S6a).19) These results suggest that the rate of mass reduction from 120 to 490 °C increased by desorption of water molecules from the Mg(OH)2 produced due to humidification. This phenomenon was also observed in other MgO tablet formulations (other than Tab_C), and in Tab_D, the most remarkable increase in mass reduction rate was observed after 7 d of humidification (Fig. 6d). In contrast, the rate of mass reduction in the same humidified temperature range for 30 d in Tab_C was identical to that in the dried Tab_C (Fig. 6c). These TG measurements support the results of NIR and microscopic IR spectroscopy, which suggest that Tab_D is the most susceptible and Tab_C the least susceptible to humidification. Now, we confirmed that the mass increase rate (%) of each tablet due to humidification (28 d) calculated from the results in Fig. 1 and the difference in the mass reduction rate (%) between the dry and the humidified sample (30 d) at 490 °C in TG data (Fig. 6) were nearly identical (data not shown).
Assuming that the increase in mass reduction by humidification is entirely due to the absorption of water molecules, we calculated the rate of change from MgO to Mg(OH)2 on a molar basis. The calculation method is shown in supplementary materials (Supplementary Fig. S7). The rates of change from MgO to Mg(OH)2 on a molar basis after 30 d of humidification calculated based on the rates of mass reduction for Tab_A, Tab_B, Tab_D and Tab_E were approximately 35, 25, 32 and 21%, respectively (Fig. 7). The rate of change observed in Tab_C was the lowest (3%, Fig. 7). In the MgO tablet formulations exposed to 30 d humidified air, the rate of change in Tab_A was higher than that in Tab_D, but in the 7 or 14 d humidified MgO tablet formulations, the rate of change in Tab_D was higher. These results suggest that the change from MgO to Mg(OH)2 in Tab_D progresses rapidly during the early humidification period compared to other MgO tablet formulations. Therefore, the TG method is useful for quantitatively evaluating quality change of MgO tablet formulations.
TD-NMR Measurement of Dry and Humidified MgO Tablet FormulationsNext, we evaluated the molecular mobility of water in humidified MgO tablet formulations using the TD-NMR method. When the T2-value was compared among the MgO tablet formulations, the value in Tab_C was the highest (Fig. 8). The T2-value is an index of water molecule mobility.20–24) The relationship between T2-value and molecular mobility is fully understood: the more restricted the molecular mobility is, the shorter the T2-value becomes.25,26) These results indicate the highest molecular mobility of absorbed water in Tab_C. Because the moisture absorption of Tab_C was slight (Fig. 1), the T2-value reflects the state of a very small amount of water molecules taken into the tablet. The T2-value of each MgO tablet formulation from 1 to 7 d after humidification was almost identical, suggesting that the T2-value remains constant regardless of the humidification time.
Furthermore, a strong negative correlation was observed between the T2-value of each MgO tablet formulation and the rate of change from MgO to Mg(OH)2 after humidification for 30 d (Fig. 9, R2 = 0.92). These results suggest that water molecules are involved in the production of Mg(OH)2 and thus decrease their molecular mobility, and indicate that the reactivity of the MgO to Mg(OH)2 due to humidification can be estimated from the T2-value. Ohgi et al. prepared model tablet formulations containing acetylsalicylic acid as the API and used various disintegrants. They evaluated the relationship between the molecular mobility of water and the hydrolysis of API when the model tablet formulation was kept at 40 °C and 75% RH for 7 d.27) As a result, they reported that the API hydrolysis rate was highest in the model tablet formulation using CP as the disintegrant, which had the highest molecular mobility of the incorporated water. As Tab_C contains CP (Table 1), this formulation shows the highest T2-value. However, while humidification activates the hydrolysis of acetylsalicylic acid,27) it did not change from MgO to Mg(OH)2 in this study. These results suggest that the mechanism of attack of the hygroscopic water on each API is different between the humidified acetylsalicylic acid-containing tablet and the MgO tablet.
Disintegration Time of Dried and Humidified MgO Tablet Formulations and MMTsTable 2 shows the disintegration time of the dried and 7 d humidified MgO tablet formulations. The disintegration time of the dried MgO tablet formulations was within 20 s, except for Tab_D. The disintegration time of Tab_D was 73 s, which was the longest time of the MgO tablet formulations. The disintegration time was prolonged in most of the humidified MgO tablet formulations compared to the dried tablet formulations, but the degree of increase varied depending on the MgO tablet formulation. The disintegration time of Tab_A, Tab_B, Tab_C and Tab_E in response to humidification for 7 d was approximately 43.7-, 11.7-, 1.2- and 2.5-fold, respectively, compared to the disintegration time of each dried tablet. A good positive correlation was observed between the disintegration time prolongation rate and the rate of change from MgO to Mg(OH)2 in the four types of MgO tablets (Supplementary Fig. S8, R2 = 0.97), although data for Tab_D were excluded because the disintegration time could not be measured. These results strongly suggest that the production of Mg(OH)2 is greatly involved in prolonging the disintegration time due to humidification of MgO tablets.
Table 2. Disintegration Time of Dried and Humidified MgO Tablet Formulations (330 mg)
| MgO tablet formulations | Disintegration time (s) |
|---|
| dry | 40 °C, 75%RH for 7 d |
|---|
| Tab_A | 11.74 ± 1.63 | 512.75 ± 52.16 |
| Tab_B | 14.73 ± 0.50 | 172.53 ± 26.76 |
| Tab_C | 10.24 ± 0.77 | 12.73 ± 0.37 |
| Tab_D | 73.19 ± 3.86 | n.d. |
| Tab_E | 18.14 ± 0.74 | 44.68 ± 13.27 |
Each value indicates the mean ± S.D. (n = 3). Calculated from the average disintegration time dried and humidified MgO tablets. n.d.: disintegration was not observed until 24 h.
To evaluate the factors that increase disintegration time due to humidification and result in differences based on the MgO tablet formulation, we prepared MMTs that reflect the non-APIs contained in each commercial MgO tablet formulation (MMT1: Tab_A and Tab_B, MMT2: Tab_C and Tab_E, MMT3: Tab_D, Table 3), and disintegration time of the dried and humidified tablets was measured. The disintegration times of dried MMT1, MMT2 and MMT3 were close to the time of each corresponding commercial MgO formulation (Table 3). In MMT1 and MMT3, a prolonged disintegration time was observed from 3 d after storage under humidified conditions, whereas in MMT2, prolonged disintegration time was not observed even 7 d after storage in humidified conditions (Table 3).
Table 3. Disintegration Time of Dried and Humidified Model MgO Tablets Imitating Commercial Tablets
| Model tablet formulation | Non-APIs | Imitated MgO tablet | Disintegration time (s) |
|---|
| Dry | 40 °C, 75%RH |
|---|
| 3 d | 7 d |
|---|
| MMT1 | MgO (80%) MCC (10%) Cr-CMC-Na (10%) | Tab_A Tab_B | 9.57 ± 1.12 | n.d. | n.d. |
| MMT2 | MgO (80%) CMC-Ca (10%) CP (10%) | Tab_C Tab_E | 14.61 ± 0.33 | 8.46 ± 1.38 | 12.03 ± 2.01 |
| MMT3 | MgO (80%) L-HPC (10%) Cr-CMC-Na (10%) | Tab_D | 72.49 ± 23.89 | n.d. | n.d. |
Each value indicates the mean ± S.D. (n = 3). n.d.: Disintegration was not observed until 24 h.
Next, MMT4, MMT5, MMT6, MMT7 and MMT8 were prepared using a mixture of MgO and the non-API used in the commercial MgO tablet formulation (mass mixing ratio of 9 : 1), and the effect of 7 d of humidification on disintegration time was evaluated (Table 4). The disintegration time of MMT4 containing MCC was not affected by humidification, but disintegration times were significantly prolonged by humidification in MMT5 and MMT6 containing Cr-CMC-Na and CMC-Ca, respectively. Particularly in MMT5, no complete disintegration was observed even after 24 h. On the other hand, in MMT7 and MMT8 containing L-HPC and CP, disintegration time was significantly decreased in response to humidification. Based on the above results for MMT4, MMT5, MMT6, MMT7 and MMT8, we reconsidered the results using MMT1, MMT2 and MMT3, which imitate commercial formulations (Table 3). MMT1 contains Cr-CMC-Na, which prolongs the disintegration time by humidification, and MCC, which does not affect the disintegration time by humidification, whereas MMT3 contains Cr-CMC-Na and L-HPC, which decreases the disintegration time by humidification. These facts suggest that the prolonging effect of Cr-CMC-Na is relatively strong, and as a result, the disintegration time of MMT1 and MMT3 is prolonged in response to humidification. In contrast, MMT2 contains CP, which decreases the disintegration time by humidification, and CMC-Ca, which prolongs the disintegration time by humidification, suggesting that the balance between the two non-APIs results in less influence on the disintegration time due to humidification.
Table 4. Effect of Humidification on Disintegration Time and Mass of Model Tablets by a Mixture of MgO and Additives (Mixing Mass Ratio of 9 : 1)
| Model tablet formulation | Non-APIs | Disintegration time (s) | Mass ratio after humidification (%)* |
|---|
| dry | 40 °C, 75%RH for 7 d |
|---|
| MMT4 | MCC | 6.94 ± 0.23 | 6.74 ± 0.51 | 105.9 ± 0.1 |
| MMT5 | Cr-CMC-Na | 26.21 ± 7.44 | n.d. | 109.7 ± 5.3 |
| MMT6 | CMC-Ca | 6.93 ± 0.68 | 109.23 ± 29.47 | 105.1 ± 0.1 |
| MMT7 | L-HPC | 23.09 ± 0.68 | 11.37 ± 0.88 | 105.6 ± 0.1 |
| MMT8 | CP | 29.60 ± 0.94 | 2.27 ± 0.07 | 107.9 ± 0.1 |
Each value indicates the mean ± S.D. (n = 3). *: The mass before humidification is 100%. n.d.: disintegration was not observed until 24 h.
In addition, model tablets in which MgO of MMT4, MMT5, MMT6, MMT7 and MMT8 was replaced with Mg(OH)2 were prepared, and disintegration times were measured to confirm the involvement of Mg(OH)2 in prolonged disintegration. As a result, a delay in disintegration time was observed in all the Mg(OH)2-containing model tablets. Interestingly, the degree of prolongation was remarkable in the model tablets using Cr-CMC-Na and CMC-Ca (Table 5). These results directly indicate that Mg(OH)2 is involved in the prolongation of disintegration time in humidified MgO tablets. Since the effects of humidification on the disintegration time of MMT1, MMT2 and MMT3 exhibited the same tendency as those imitating commercially available formulations, Cr-CMC-Na seems to be strongly involved in prolonging the disintegration time observed in Tab_A, Tab_B and Tab_D, suggesting that the small effect of humidification on the disintegration time in Tab_C and Tab_E is due to the presence of CP.
Table 5. Disintegration Time of Model Tablets by a Mixture of Mg(OH)
2 and Additives (Mixing Mass Ratio of 9 : 1)
| Non-APIs | Disintegration time (s) |
|---|
| MCC | 94.23 ± 23.50 |
| Cr-CMC-Na | n.d. |
| CMC-Ca | n.d. |
| L-HPC | 73.10 ± 7.48 |
| CP | 82.11 ± 4.66 |
Each value indicates the mean ± S.D. (n = 3). n.d.: Disintegration was not observed until 1 h.
In the model tablets (MMT4, MMT5, MMT6, MMT7 and MMT8) with a mixture of MgO and one of non-API (mass mixing ratio of 9 : 1), no significant difference was observed in the increase in mass reflecting the amount of moisture absorption (Table 4). In addition, the production of Mg(OH)2 and moisture absorption were assessed via the NIR spectra (approximately 7200 and 5200 cm−1, respectively) (Supplementary Fig. S9). Although the production of Mg(OH)2 by humidification was observed in all model formulations, the effect on the disintegration time differed greatly depending on the disintegrant contained, which may be due to the tendency of the interaction between Mg(OH)2 and the disintegrant. In other words, disintegrants such as Cr-CMC-Na and CMC-Ca, whose disintegration time is prolonged by humidification, may block the path of water by interacting with Mg(OH)2 (crosslinking, etc.). As a result, the disintegration time would be delayed. On the other hand, since CP, L-HPC, and MCC do not strongly interact with Mg(OH)2, the conditions were changed to allow water to easily invade in response to humidification (Fig. 10). Furthermore, Cr-CMC-Na and CMC-Ca have metallic cations that may be involved in the interaction with Mg(OH)2 in humidified MgO tablets. These reactions may prolong disintegration time, but this hypothesis needs further evaluation.
Comparing the effects of humidification on the mass change and disintegration time between the MMTs (MMT1, MMT2 and MMT3) and the corresponding commercially available formulation, although the general tendencies were similar, the details could not be accurately reproduced. This may be due to the qualitative difference between MMTs, the tablets of a simple physical mixture, and a commercially available tablet, which has been formulated by pharmaceutical manufacturers in various ways.
There are several interesting reports on the properties of CP. Suzuki et al. studied the effect of disintegrants on the cocrystal separation of paracetamol-oxalic acid. They reported that when a water-conducting disintegrant such as CP was used, cocrystal separation was less likely to proceed than when a swelling-type disintegrant was used28) and concluded that the amount of water in the bulk that contributes to the separation of cocrystals is insufficient since CP takes in water. Considering that the disintegration time was hardly prolonged by humidification in Tab_C, where the production of Mg(OH)2 was hardly observed, it seems likely that water invades the inside of the tablet formulation, and the disintegration time is prolonged by humidification.
Tab_C exhibits the following characteristics depending on the CP contained, as well as the property of not easily absorbing moisture due to its own large particular size (Fig. 1). First, the contact between the absorbed water molecule and MgO is prevented due to the water conduction effect of CP, so Mg(OH)2 is difficult to generate. Moreover, even if Mg(OH)2 is generated by humidification, the interaction between Mg(OH)2 and CP is weak, so the disintegration time is not prolonged. On the other hand, in Tab_E containing CP as well as Tab_C (Table 1), the prolonged disintegration time was lower than that in Tab_A, Tab_B and Tab_D (Table 2), suggesting that the presence of CP contributed to this result. In the manufacturer’s form of Tab_C, the description that the size of tablet formulation is reduced to improve this issue has been recognized.16) The effect of humidification on the disintegration time of Tab_E was not consistent with that of Tab_C in this study. The reason for this may be due to differences in the particle size of the CP and differences in manufacturing processes such as tableting pressure.
There are already some reports on prolonged disintegration time due to humidification of MgO tablet formulations.2,4–8) Sakamoto et al. reported that MgO dissolved by moisture absorption forms solid crosslinks with powder particles as one of the mechanisms.3) Moreover, they suggested that a part of MgO binds to water (H2O) and carbon dioxide (CO2) to generate a hydromagnesite [Mg5 (CO3)4 (OH)2·4H2O], which is involved in the formation of solid crosslinks.4) In another study, physical structure, such as the presence or absence of voids, was also considered a factor in prolonging disintegration time.7) From the results of various pharmaceutical measurements in this study, we concluded that the production of Mg(OH)2 by humidification is the main contributor to prolonging disintegration time in commercial MgO tablet formulations. Previous studies have shown IR spectra up to 24 h of storage under humidification conditions.4) Focusing on these data, the peak derived from CO32− (around 1500 cm−1) is clearly recognized in humidified tablet formulation formed with 100% MgO, but not sharp peak around 3700 cm−1 derived from Mg(OH)2.4) Based on the above results, we think that the hydromagnesite is formed in the early stage of humidification (up to 24 h), and that Mg(OH)2 is mainly formed as humidification progresses for a longer period of time. Therefore, it is suggested that these all contribute to the prolongation of the disintegration time.