Abstract
The purpose of the present study was to evaluate bitterness suppression effect of adenylic acid (AMP) as a nucleotide-derived nutrient enhancer on a bitter commercial drug. In the present study, we evaluated peripheral bitterness inhibition effect of AMP on the trimethoprim (TMP) and sulfamethoxazole (SMZ) combination formulation based on taste sensor. The taste sensor values of TMP solutions with different concentrations show large sensor output in correlation with the concentration of TMP, whereas no sensor output in shown for the SMZ solutions. Therefore, the bitterness of this combination formulation is mainly due to TMP. We evaluated the TMP bitterness inhibitory effects of AMP, sodium salt of AMP (AMP Na; sodium adenylate), sodium salt of GMP (GMP Na; sodium guanylate), and sodium salt of inosine monophosphate (IMP Na; sodium inosinate), and found that only AMP displayed very effective bitterness inhibition. MarvinSketch analysis revealed that potential electrostatic interaction between cationized TMP and anionized forms (II and III) of AMP may cause bitterness suppression. 1H-NMR study suggested an interaction of TMP and AMP molecules based on chemical shift perturbations and an interaction between the phosphate group of AMP and amino group of TMP. Lastly, conventional elution analysis simulating oral cavity capacity for up to one minute were performed using commercial TMP/SMZ combination granules. The sensor output gradually increased up to 60 s. The addition of AMP solution to the eluted sample at 60 s significantly decreased the bitterness sensor output of the eluted sample.
Introduction
The bitterness suppression methods can be mainly divided into physical taste masking such as film coating,1,2) chemical taste masking using cyclodextrin,3,4) and sensory bitterness suppression methods using sweeteners.5,6) In some cases, depending on drug dosage and bitterness, a combination of above methods has been employed.7) Recently, many articles have been published regarding the human bitterness receptor hT2R, and knowledge about its prevalent subtypes, such as hT2R14 or hT2R10, as well as agonists and antagonists has become more clear.8–12) Information regarding its antagonists or antagonists might be specifically useful for the bitterness suppression of oral commercial medicines such as oral solid dosage or liquid dosage formulations.13)
We have previously performed quantitative bitterness evaluation of substances or commercial drugs based on taste sensor. In addition, we have studied bitterness suppressing substances and found that phospholipids,14) chlorogenic acid,15) aspartic acid (Asp)-Asp, and glutamic acid (Glu)-Glu function as umami peptides.16) The use of such substances provides a partial solution, however perfect bitterness suppression could not be obtained using this method.
In the present study, we focused on adenylic acid (AMP) as a bitterness suppressing agent. AMP and related compounds have been reported to have advantageous properties for the maturation of epithelial cells in the gastrointestinal tract of infants.17) In addition, AMP has already been incorporated into synthetic milk and is available commercially as a nutrient enhancer.18)
Ming et al. found the activation with an in vitro assay using bovine tongue membranes to identify compounds that inhibited taste sensor activation of transduction by bitter compounds, and confirmed AMP and certain related compounds inhibited in vitro responses to several bitter compounds (denatonium, quinine, strychnine, and atropine).19) Keast et al. evaluated bitterness inhibition effects of AMP Na or related compounds confirmed inhibition in bitterness of medicine by human gustatory sensation test., and they concluded that usage of sodium was effective cation compared to other cation.20,21) In addition, Keast and Breslin also discussed that sodium salt inhibit bitterness in periphery, acting on oral physiology, and the site of sodium salts is unknown.21)
Nevertheless, Keast et al. did not seem to evaluate peripheral bitterness inhibition effect or mechanism quantitatively.
Usage of taste sensor specific to bitterness is expect to advantageous to evaluate peripheral bitterness inhibition of bitter medicines even though that usage of sensor alone is not able to predict centrally bitterness inhibition by AMP sodium or related umami substances.
The taste sensor output data is still expected to useful in evaluating peripheral bitterness effect. i.e., decrease of affinity of bitter medicine in the presence of bitterness inhibitor to human bitter receptor.
In our previous paper,15) bitterness inhibition of diphenhydramine hydrochloride as basic drug by chlorogenic acid as acidic acid was well demonstrated and explained by basic-acid substances interaction, by NMR analysis which seem typical peripheral bitterness inhibition by drug–bitterness inhibitor interaction.
The antibacterial trimethoprim (TMP) and sulfamethoxazole (SMZ) combination formulation has been used in various dosages depending target bacteria,22) infection characteristics,23) and their severity.24) Poor adherence of the TMP/SMZ formulation has been reported due to its severe bitterness.25) This issue is most severe in infant treatment, where the tablet is sometimes divided or crushed, which may further increase the bitterness of substance and thereby significantly worsen the adherence of patients. To overcome this issue, mini-sized tablet26) and fine granule formulations27) have been developed. Nevertheless, the bitterness level reached after patients keep those formulations inside the oral cavity remains unclear.
The purpose of the present study was to examine the inhibitory effect of AMP, a nucleotide-derived nutrient enhancer, on the bitterness of the antibacterial combination drug of TMP and SMZ. First, the bitterness of TMP and SMZ as single components were determined based on taste sensor specific to bitterness. Secondly, after confirming that only TMP generates a bitterness response, four kinds of nucleotides, AMP, sodium salt of AMP (AMP Na; sodium adenylate), sodium salt of GMP (GMP Na; sodium guanylate), and sodium salt of inosine monophosphate (IMP Na; sodium inosinate) were analyzed to determine their inhibitory effects on the bitterness of TMP based on the taste sensor, and predict peripheral bitterness inhibition of TMP by AMP and related compounds.
Furthermore, in order to clarify the drug-drug interaction between TMP and AMP and related three types of nucleotides with sodium, a 1H-NMR study was performed. Lastly, conventional elution tests assuming oral cavity conditions were performed using the commercial TMP/SMZ combination granule product. The sensory output and TMP eluted % for the elusion medium at 10, 30, 60, 60 s with 1 mM/3 mM AMP were measured, and thereby the bitterness inhibitory effect of AMP on the TMP/SMZ combination granule product was evaluated.
Results and Discussion
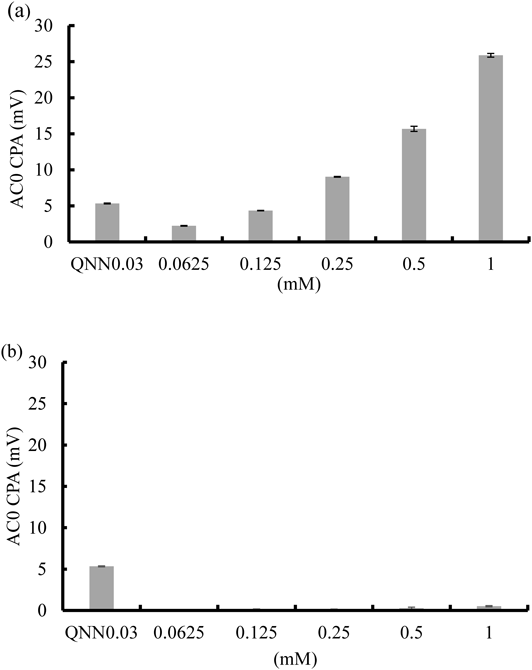
Bitterness of the TMP and SMZ Combination Formulation Based on Taste Sensor AnalysisFigure 1a shows the taste sensor (AC0) outputs for 0.03 mM quinine as the bitterness control and for AMP solutions of various concentrations. Taste sensor values of TMP solutions with different concentrations (0.0625, 0.125, 0.25, 0.5, and 1.0 mM) showed high sensor output which increased in correlation with the concentration of TMP.
Taste sensor (AC0) output, and pH of 0.03 mM quinine hydrochloride was 5.26 ± 0.18 (mV), 7.69 ± 0.21 (average ± standard deviation (S.D.)), respectively.
As shown in Fig. 1b, no sensor outputs were observed in response to the SMZ solutions of different concentrations. Based on this, we concluded that the bitterness of the combination formulation is mainly caused by TMP.
As shown in Table 1, the pH of TMP was almost 7 and increased slightly in correlation with the concentration of TMP, whereas pH of SMZ was almost 5 and decreased at higher concentrations of SMZ.
Table 1. pH of Different Concentrations of TMP and SMZ Solutions
| Sample | pH |
|---|
| TMP (0.0625 mM) | 7.23 ± 0.13 |
| TMP (0.125 mM) | 7.29 ± 0.05 |
| TMP (0.25 mM) | 7.61 ± 0.02 |
| TMP (0.5 mM) | 8.09 ± 0.06 |
| TMP (1 mM) | 8.16 ± 0.03 |
| SMZ (0.0625 mM) | 5.53 ± 0.10 |
| SMZ (0.125 mM) | 5.18 ± 0.03 |
| SMZ (0.25 mM) | 4.99 ± 0.04 |
| SMZ (0.5 mM) | 4.78 ± 0.01 |
| SMZ (1 mM) | 4.60 ± 0.04 |
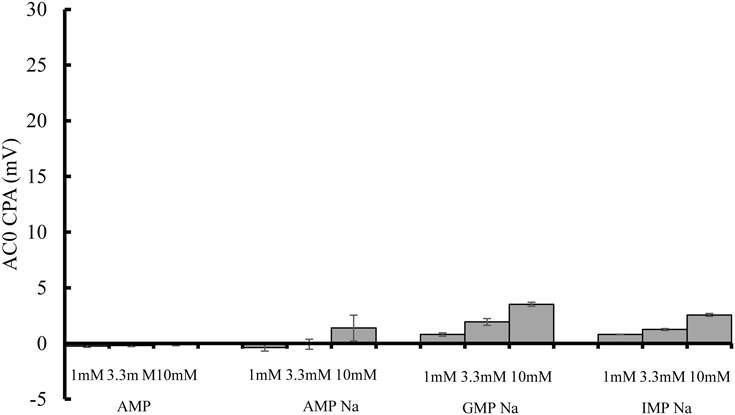
The taste sensor output (CPA value on AC0) of 1.0 mM TMP supplemented with 1, 3.3, or 10 mM AMP, AMP Na, GMP Na, or IMP Na are shown in Figs. 2a, b, c, and d, respectively. The bitterness suppression effect was ranked as AMP > AMP Na = GMP Na = IMP Na. Only the addition of AMP dramatically decreased sensor output (AC0) compared to other substances, whereas no bitterness inhibiting effect was observed for AMP Na, GMP Na, and IMP Na. As references, sensor output (CPA value on AC0) of four kinds of nucleic acid-based components themselves were shown in Fig. 3.
Sensor output values of AMP and related compounds with sodium salt shown in Fig. 3 were all much smaller than that of 1 mM TMP solution shown in Fig. 2, which meaning all of four compounds show low affinity toward the taste sensor specific to bitterness.
As described above, the addition of AMP, bitterness sensor output of 1 mM TMP was so effective in decreasing sensor output whereas that bitterness sensor output of 1 mM TMP did not decrease at all by addition of each of three AMP related compounds with sodium salt. This data suggest the possibility of bitterness inhibition effect of sodium ion derived from related three AMP compounds on bitterness receptor might not so significant.
We also evaluated acidity and astringency about AMP and related substances according to previous papers.28,29) The result was shown in Table 2.
Table 2. Evaluation of Acidity and Astringency Using Relative Value from Sensor Measurement
| (mV) |
|---|
| Sample | Sourness (mean ± S.D. (n = 3)) |
|---|
| Tartaric acid (0.17 mM) (τ1) | 36.53 ± 1.46 |
| AMP (1 mM) | 45.08 ± 1.43 |
| AMP (10 mM) | 74.65 ± 1.49 |
| AMP-Na (1 mM) | −39.77 ± 1.02 |
| AMP-Na (10 mM) | −80.28 ± 1.05 |
| GMP-Na (1 mM) | −43.20 ± 0.89 |
| GMP-Na (10 mM) | −85.21 ± 1.06 |
| IMP-Na (1 mM) | −44.50 ± 0.98 |
| IMP-Na (10 mM) | −85.75 ± 1.00 |
| (mV) |
|---|
| Sample | Astringency (mean ± S.D. (n = 3)) |
|---|
| Tannic acid (0.004%) | −115.73 ± 1.86 |
| AMP (1 mM) | 94.74 ± 0.94 |
| AMP (10 mM) | 94.24 ± 1.23 |
| AMP-Na (1 mM) | 77.74 ± 1.29 |
| AMP-Na (10 mM) | 66.19 ± 4.51 |
| GMP-Na (1 mM) | 78.38 ± 1.19 |
| GMP-Na (10 mM) | 66.28 ± 3.84 |
| IMP-Na (1 mM) | 78.54 ± 1.24 |
| IMP-Na (10 mM) | 72.02 ± 1.75 |
* Evaluation of acidity astringency and astrigency was evaluted according to previous article. Tartalic aid 0.17 mM (τ1) and tannic acid were adopted as standard concentration consider threshhould.
The taste sensor output (CA0 relative value) for acidity of related substances of AMP with sodium salt were lower than that of 0.17 mM tartaric acid as reference. The taste sensor output AMP acidity were estimated to same or little bit larger than that of 0.17 mM tartaric acid even though it is not seem to give patient so severe acidity.
Whereas the taste sensor output (AE1 relative value) for astringency of AMP and related substances with sodium salt was larger than that of 0.004% tannic acid as reference, this meaning no astringency of AMP and related substances. In evaluation of evaluation of as astringency using AE1, if astringency increased, the senor output value become larger negatively, as demonstrated in our previous paper.28)
Estimation of Drug IonizationFirstly, pH of TMP solution containing different concentrations of AMP, AMP Na, GMP Na, and IMP Na was shown in Table 3, respectively. The molecular form and ionic form ratios based on pKa over the pH range of 3.2–8.4 were calculated for TMP, AMP, AMP Na, GMP Na, and IMP Na using MarvinSketch, and the corresponding molecular or ionic form species structures are shown in the respective figures.
Table 3. pH of TMP Solution Containing Different Concentrations of AMP, AMP Na, GMP Na, and IMP Na
| Sample | pH |
|---|
| TMP (1 mM) | 8.15 ± 0.02 |
| TMP (1 mM) + AMP (1 mM) | 5.34 ± 0.03 |
| TMP (1 mM) + AMP (3.3 mM) | 3.71 ± 0.03 |
| TMP (1 mM) + AMP (10 mM) | 3.23 ± 0.04 |
| AMP (1 mM) | 3.66 ± 0.01 |
| AMP (3.3 mM) | 3.35 ± 0.04 |
| AMP (10 mM) | 3.01 ± 0.01 |
| TMP (1 mM) | 8.64 ± 0.16 |
| TMP (1 mM) + AMP Na (1 mM) | 8.26 ± 0.06 |
| TMP (1 mM) + AMP Na (3.3 mM) | 8.18 ± 0.05 |
| TMP (1 mM) + AMP Na (10 mM) | 8.14 ± 0.02 |
| AMP Na (1 mM) | 7.55 ± 0.21 |
| AMP Na (3.3 mM) | 7.91 ± 0.06 |
| AMP Na (10 mM) | 7.93 ± 0.01 |
| TMP (1 mM) | 8.69 ± 0.17 |
| TMP (1 mM) + GMP Na (1 mM) | 7.95 ± 0.08 |
| TMP (1 mM) + GMP Na (3.3 mM) | 8.13 ± 0.03 |
| TMP (1 mM) + GMP Na (10 mM) | 8.26 ± 0.07 |
| GMP Na (1 mM) | 7.66 ± 0.05 |
| GMP Na (3.3 mM) | 7.93 ± 0.01 |
| GMP Na (10 mM) | 8.04 ± 0.02 |
| TMP (1 mM) | 8.42 ± 0.02 |
| TMP (1 mM) + IMP Na (1 mM) | 8.37 ± 0.02 |
| TMP (1 mM) + IMP Na (3.3 mM) | 8.22 ± 0.05 |
| TMP (1 mM) + IMP Na (10 mM) | 8.09 ± 0.01 |
| IMP Na (1 mM) | 7.53 ± 0.01 |
| IMP Na (3.3 mM) | 7.87 ± 0.05 |
| IMP Na (10 mM) | 7.93 ± 0.01 |
As shown in Fig. 4a, the ionized form of TMP predominates over the pH range of 0–7.16, whereas the non-ionized form of TMP dominates at pH 7.16–14.0. Cationized forms of TMP were predicted to account for more than 98.5% at a pH range of 3.2–5.2, which is also the pH range of TMP solutions containing AMP at concentrations of 1.0, 3.3, and 10 mM as listed in Table 3. At pH values of 8.0 and 8.4, the proportion of the non-ionized form was calculated to be 87.5 and 94.6%, respectively, whereas the proportion of cationized forms of TMP at pH 8.0 and 8.4 were 12.5 and 5.4%, respectively.
AMP has eight ionized species, but only four of these (forms I, II, III, and IV) make up a significant proportion at a pH range of 3.2–5.2 as shown in Fig. 4b. Among these four ionic species, the ionized AMP form (III) mostly dominates in the pH range of 3.2–5.2. The proportions of ionized AMP form (III) at pH 3.2 and 5.2 were 97.2 and 34.9%, respectively. The ionized AMP form (I) contributed to some extent at pH 3.2 and 5.2, were it made up 1.6 and 56.9% of all forms, respectively, as show in Fig. 4a. As shown in Figs. 4c and d, at pH values of 8.0 and 8.3, the proportion of the anionized AMP form (I) was 99.0%, whereas the proportion of the ionized AMP form (II) was approximately 1%. As shown in Fig. 4d, at pH values of 8.0 and 8.4, the proportion of the anionized AMP form (I) was 99, and 77%, respectively, whereas the proportion of the ionized AMP form (II) was 1.4 and 0.91%.
Overall, the electrical interaction between the cationized TMP and anionized AMP forms (II) and (III) seem to be behind the most significant drug–drug interaction based on calculations using MarvinSketch.
1H-NMR Study of the Interaction between TMP and AMP1H-NMR was used to evaluate the interaction between TMP and nucleotides in order to understand the mechanism underlying TMP bitterness suppression by nucleotides. 1H-NMR data of TMP with/without nucleotides are shown in Figs. 5a–h. The 1H-NMR spectrum of TMP is enumerated as follows: 3.534 ppm (2H, s, CH2), 5.864–5.914 ppm (2H, broad, NH2), 6.271–6.325 ppm (2H, broad, NH2). In the 1H-NMR spectrum of the mixture of TMP and AMP, the signals of the amino proton of TMP were found as a result of mixing with AMP. Protonation of the amino group was suggested to have resulted from mixing with AMP. The signals of methylene proton of TMP were shifted slightly downfield in response to AMP in a dose-dependent manner. In the 1H-NMR spectrum of TMP with AMP, the methylene proton shifted from 3.534 ppm (TMP only) to 3.357 ppm (mixing ratio of TMP to AMP; 1) (Δ0.044 ppm), 3.588 ppm (mixing ratio of TMP to AMP; 0.3) (Δ0.054 ppm), and 3.593 ppm (mixing ratio of TMP to AMP; 0.1) (Δ0.059 ppm) (Figs. 5a–d). Ikeda et al. reported that the electron density near to the nitrogen atom was decreased by interaction.30) It was suggested that a methylene proton of the neighboring protonated amino group caused a downfield shift as the electron density decreased due to protonation of the amino group. In the 1H-NMR spectrum of AMP with TMP, the methylene proton shifted from 3.941–4.067 ppm (AMP only) to 3.937–4.061 ppm (mixing ratio of AMP to TMP; 10) (Δ0.003–Δ0.004 ppm) to 3.924–4.054 ppm (mixing ratio of AMP to TMP; 3) (Δ0.017–Δ0.013 ppm), and 3.897–4.030 ppm (mixing ratio of AMP to TMP; 10) (Δ0.044–Δ0.064 ppm) (Figs. 5e–h). This shows that the electron density was increased at this location and an upfield shift occurred due to a shielding effect. Therefore, it can be hypothesized that AMP interacts with TMP in the vicinity of the phosphate group.
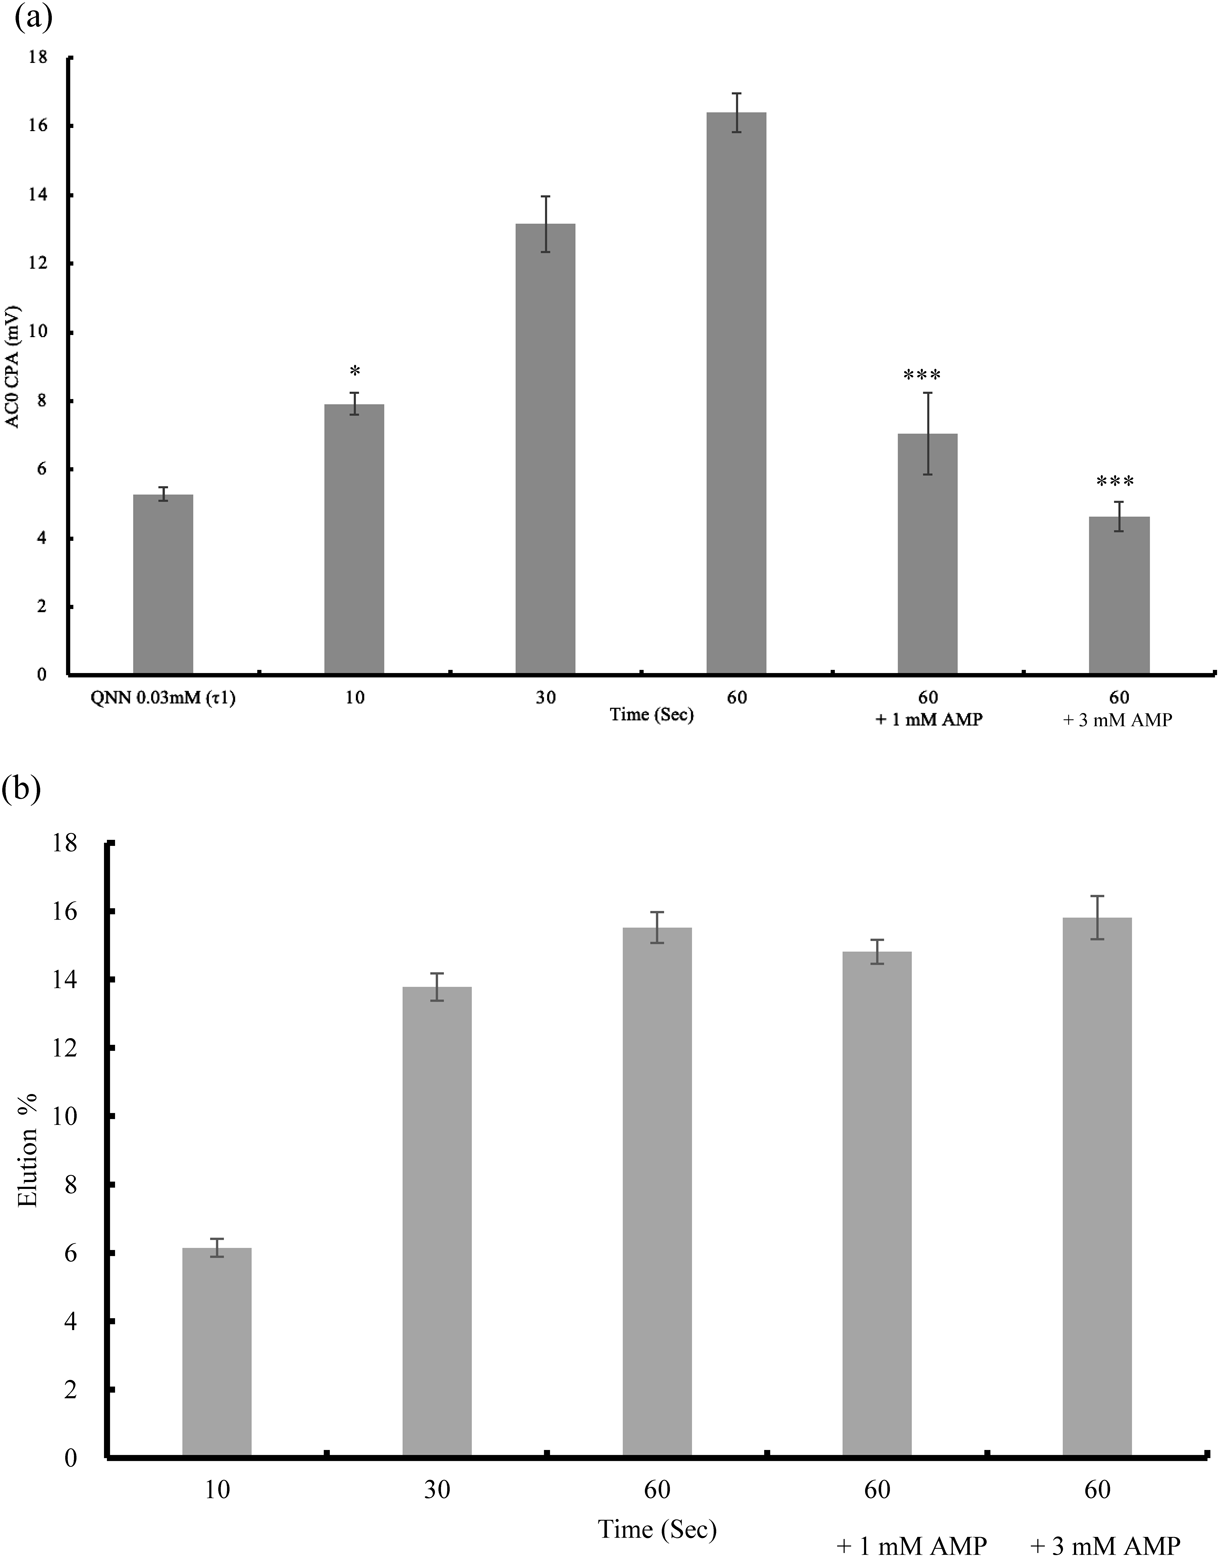
Conventional Elution Study of the Commercial TMP/SMZ Combination Granule and Bitterness Intensity-Time Profile Determined by Taste Sensor Measurement and TMP Eluted %-Time Profile Evaluated by HPLCAs shown in Fig. 6a, taste sensor output of the medium increased time-dependently. The sensor output at 10 s was 7.92 ± 0.32 (mV) and that value was significantly larger than output of quinine as bitterness threshold (5.28 ± 0.20 (mV)), this has risk to give unpleasant bitterness sensation in patients. Taste sensor output of medium at 60 s, which containing 1 mM (7.06 ± 1.19 (mV) or 3 mM (4.63 ± 0.44 (mV)), were significantly lower than the sensor output of 60 s (16.40 ± 0.57 (mV)), which is without AMP and can confirm the bitterness inhibition by AMP. Nevertheless the sensor output at 60 s containing 3 mM AMP was 4.63 ± 0.44 (mV), and the value is almost same level compared with the sensor output of quinine as threshold 5.28 ± 0.20 (mV).
Figure 6b shows eluted % of TMP in the artificial saliva medium up to 1 min. The eluted TMP % or TMP concentration in medium at 10, 30, 60 s were 6.15 ± 0.26% (246.14 ± 10.60 µg/mL), 13.78 ± 0.40% (551.34 ± 15.86 µg/mL), and 15.52 ± 0.45% (620.91 ± 17.90 µg/mL), respectively. Eluted TMP %-time profile resemble to taste sensor-time profile. The concentration of 1 mM AMP in the 60 s sample was 14.81 ± 0.35% (592.47 ± 14.07 µg) and in the 3 mM AMP was 15.81 ± 0.63% (642.59 ± 35.02 µg).
Based on these results, the addition of AMP to the TMP/SMZ combination granule is expected to be useful for suppressing the bitterness of the combination drug, but not achieve complete bitterness inhibition.
Conclusion
In the present study, we evaluated bitterness inhibition of the TMP/SMZ formulation almost entirely results from TMP based on taste sensor measurement. We found that AMP was the most effective in bitterness suppression compared to AMP Na, GMP Na, and IMP Na.
Based on MarvinSketch analysis, the expected electrostatic interaction between the cationized TMP and anionized AMP forms (II) and (III) is likely cause behind the bitterness suppression. The use of AMP for inhibiting the bitterness of medicines, revealing the potential applicability of AMP for inhibiting the bitterness of a wide range of medicines. Regarding potential interactions of TMP and nucleotides based on chemical shift perturbations revealed by 1H-NMR study, electrostatic interaction between TMP and AMP was suggested to occur and will cause bitterness inhibition peripherally.
Finally, in conventional elution study of the commercial TMP/SMZ combination granule, the sensor output–time profile and release TMP %-time profile was examined, and those profiles seem resemble. The addition of AMP to the TMP/SMZ combination granule was useful for suppressing the bitterness of the combination drug, but did not perfect bitterness inhibition.
Experimental
MaterialTrimethoprim, sulfamethoxazole, quinine hydrochloride were purchased from FUJIFILM Wako Pure Chemical Corporation, Japan.
AMP (AMP; 5′-adenylic acid), sodium salt of AMP (AMP Na; sodium guanylate), and sodium salt of guanosine monophosphate (GMP Na) were purchased from Tokyo Chemical Industry Co., Ltd., Japan. Inosinic acid disodium salt (IMP Na) was purchased from Nacalai Tesque Inc., Japan. Combination granule product (baktar granules) was obtained from Shionogi Co., Ltd., Japan. Tartaric Acid was purchased from Nacalai Tesque Inc., Japan. Tannic Acid was purchased from FUJIFILM Wako Pure Chemical Corporation.
Taste Sensor MeasurementBitterness of Trimethoprim (TMP) and Sulfamethoxazole (SMZ) Combination FormulationQuinine hydrochloride solution as bitterness standard was used at 0.03 mM (τ1).28) TMP and SMZ were used at concentrations of 1, 0.5, 0.25, 0.125, and 0.0625 mM. Their sensor output was measured using AC0 according to previous studies.31)
TMP Bitterness Inhibition Effect of AMP and Related CompoundsQuinine hydrochloride solution as the bitterness standard was used at 0.03 mM (τ1). TMP and SMZ were used at concentrations of 1, 0.5, 0.25, 0.125, and 0.0625 mM. In the evaluation of the TMP bitterness inhibition effect of AMP and related compounds by taste, TMP initial concentration was fixed at 1 mM, and containing of AMP, AMP Na, GMP Na, and IMP Na were fixed at 1, 3.3, 10 mM respectively. In addition, AMP, AMP Na, GMP Na, and IMP Na of 1, 3.3, 10 mM sample solution were prepared.
The pH of prepared sample solutions were measured three times by HORIBA F-52 and calculate the average value and S.D.
The taste sensor measurement was performed as follows. The taste sensor, SA402B (Intelligent Sensor Technology Inc., Atsugi, Japan) was used to determine the bitterness intensities of the sample solutions using the sensor AC0, developed specifically to detect the bitterness of basic substances. In the first step of the procedure, a reference solution (corresponding to saliva) was measured and the electric potential obtained (mV) was defined as Vr. Then a sample solution was measured and the electric potential obtained defined as Vs. The relative sensor output (R), represented by the difference (Vs − Vr) between the potentials of the sample and the reference solution corresponds to the ‘taste immediately after putting in the mouth.’ The electrodes were subsequently rinsed with a fresh reference solution for 6 s. When the electrode was dipped into the reference solution again, the new potential of the reference solution was defined as Vr0. The difference (Vr0 − Vr) between the potentials of the reference solution before and after sample measurement was the ‘change in membrane potential caused by adsorption’ (CPA) and corresponds to the so-called ‘aftertaste.’ The value obtained when CPA was divided by R was defined as the adsorption ratio. In this study, the CPA of AC0 (CPAAC0) was considered as the predicted bitterness intensity of the tested basic drug. The measurement of each sample was repeated four times and the average value of the last three measurements was used in the data analysis.15)
In addition, sourness and astringency as unpleasant taste were also evaluated according to the previous paper28) essential same method mentioned above. The standard tannic acid, and tartaric acid concentration was were determined based on our previous article28) and technical book,29) respectively.
1H-NMR Study for Interaction between TMP and AMPThe 1H-NMR spectra were measured on a JEOL 500 MHz spectrometer using DMSO-d6 as a solvent and tetramethylsilane (TMS) as an internal standard. TMP, AMP, and mixtures of TMP and AMP solutions were prepared as sample solutions. The mixing ratio of AMP to TMP in the sample solution was 1, 3, and 10 by molar ratio.
Conventional Elution Study of the Commercial TMP/SMZ Combination Granule and Bitterness Intensity-Time Profile Determined by Taste Sensor Measurement and TMP Eluted %-Time Profile Evaluated by HPLCThe brief elusion study simulating oral cavity condition using 20 mL artificial saliva as two batches as follows. First, 1000 mg of granules was dispersed in a petri dish (50 mL of beaker) filled with 20 mL of artificial saliva solution32) and mixed using a bottom stirrer (side) rotating at 50 rpm/min. After the granules were dispersed over the surface of the buffer, at 10, 30, 60 s, the sample suspension medium was filtered through a nylon mesh (N-No. 255HD; material: nylon66, nylon fiber width 43 µm, mesh opening size 57 µm). Each of two sets of samples at each time was put together, and used for tastes sensor measurement mentioned in above section. In related to sample as 60 s containing 1/3 mM AMP, AMP fine powder was added to 60 s elusion sample as ratio of 7.82 and 23.47 mg/20 mL, sonicated and prepared the sample solution. 0.03 mM quinine dissolved in artificial saliva (corresponding to τ1) was used as a standard in sensor measurement. The experiments were performed as three sets. TMP concentration in medium was determined using HPLC (LC-2050C SHIMADZU Corp., Japan). The HPLC method used for TMP was based on Japanese pharmacopoeia and the previous report.33) For HPLC, an integrator (LC solution; Shimadzu Corp., Japan) and reversed-phase column (CAPCELL PAK C18, 4.6 mm i.d × 150 mm, i.d.; Shiseido Co., Ltd., Japan). The column temperature was kept at 25 °C. Wavelength was set at UV-254 nm. Mobile phase composition was the mixture of 700 mL of water, 200 mL of acetonitrile, and 1.0 mL of triethylamine. To the mixture, diluted acetic acid was added to adjust pH 5.9, and also adjusted by adding water to make 1000 mL. The flow rate was fixed at 0.8 mL/min. All above experiments were performed as three sets.
Statistical AnalysisEkuseru-Toukei 2010 (Social Survey Research Information Co., Ltd., Tokyo, Japan) was used for statistical analysis. Comparisons between groups were conducted using the Tukey’s test.
Acknowledgments
This work was supported by JSPS KAKENHI Grant Number 21H05006 (to Takahiro Uchida).
Conflict of Interest
The authors declare no conflict of interest.
References
- 1) Joshi S., Peterei H.-U., Int. J. Pharm., 457, 395–406 (2013).
- 2) Bose S., Bogner R. H., Pharm. Dev. Technol., 12, 115–131 (2007).
- 3) Liu T., Wan X., Luo Z., Liu C., Quan P., Cun C., Fang L., Asian. J. Pharm, 14, 183–192 (2019).
- 4) Ono N., Miyamoto Y., Ishiguro T., Motoyama K., Hirayama F., Iohara D., Seo H., Tsuruta S., Arima H., Uekama K., J. Pharm. Sci., 100, 1935–1943 (2011).
- 5) Uchida T., Miyanaga Y., Tanaka H., Wada K., Kurosaki S., Yoshida M., Matsuyama K., Chem. Pharm. Bull., 48, 1843–1845 (2000).
- 6) Nakamura T., Tanigake A., Miyanaga Y., Ogawa T., Akiyoshi T., Matsuyama K., Uchida T., Chem. Pharm. Bull., 50, 1589–1593 (2002).
- 7) Ishizaka T., Okada S., Takemoto E., Tokuyama E., Tsuji E., Murai J., Uchida T., Chem. Pharm. Bull., 55, 1452–1457 (2007).
- 8) Haraguchi T., Uchida T., Yoshida M., Kojima H., Habara M., Ikezaki H., Chem. Pharm. Bull., 66, 71–77 (2018).
- 9) Jaggupilli A., Howard R., Aluko R. E., Chelikani P., Nutrients., 11, 1317 (2019).
- 10) Xu Q., Singh N., Hong H., Yan X., Yu W., Jiang X., Chelikani P., Wu J., Food Chem., 283, 621–627 (2019).
- 11) Yu Z., Wang Y., Zhao W., Li J., Shuian D., Liu J., Food Chem., 368, 130839 (2022).
- 12) Zhao W., Li D., Wang Y., Kan R., Ji H., Su L., Yu Z., Li J., Food Funct., 12, 11966–11973 (2021).
- 13) Ojiro I., Nishio H., Yamazaki-ito T., Nakano S., Ito S., Toyohara Y., Hiramoto T., Terada Y., Ito K., Biosci. Biotechnol. Biochem., 85, 1526–1529 (2021).
- 14) Nakamura T., Tanigake A., Miyanaga Y., Ogawa T., Akiyoshi T., Matsuyama K., Uchida T., Chem. Pharm. Bull., 50, 1589–1593 (2002).
- 15) Shiraishi S., Haraguchi T., Nakamura S., Kojima H., Kawasaki I., Yoshida M., Uchida T., Chem. Pharm. Bull., 65, 151–156 (2017).
- 16) Okuno T., Morimoto S., Nishikawa H., Haraguchi T., Kojima H., Tsujio H., Arisawa M., Yamashita T., Nishikawa J., Yoshida M., Habara M., Ikezaki H., Uchida T., Chem. Pharm. Bull., 68, 234–243 (2020).
- 17) Cosgrove M., Davies D. P., Jenkins H. R., Arch. Dis. Child. Fetal Neonatal Ed., 74, F122–F125 (1996).
- 18) Riva E., Verduci E., Brunetti I., Agostoni C., Pediatr. Med. Chir., 27, 1–10 (2005).
- 19) Ming D., Ninomiya Y., Margolskee R. F., Proc. Natl. Acad. Sci. U.S.A., 96, 9903–9908 (1999).
- 20) Keast S. J. R., Canty M. T., Breslin A. S. P., Chem. Senses, 29, 431–439 (2004).
- 21) Keast S. J. R., Breslin A. S. P., Pharm. Res., 19, 1019–1026 (2002).
- 22) Smellie J. M., Gruneberg R. N., Normand I. C., Bantock H. M., Ver. Infect. Dis., 4, 461–466 (1982).
- 23) Gluckstein D., Ruskin J., Clin. Infect. Dis., 20, 843–853 (1995).
- 24) Yamashita K., Shimomura Y., Ikesue H., Muroi N., Yoshimoto A., Hashida T., BMC Infect. Dis., 21, 664 (2021).
- 25) Saito M., Hoshi M., Igarashi A., Ogata H., Edo K., Biol. Pharm. Bull., 22, 997–998 (1999).
- 26) “Mini-sized tablet, Baktar interview form (Shionogi Co., Ltd.).”: ‹https://www.shionogi.co.jp/med/download.php?h=8783cc9b8c50aae976d90d28f50f3a0d›, cited 20 September, 2022.
- 27) “Fine granule formulations, Baktar interview form (Shionogi Co., Ltd.).”: ‹https://www.shionogi.co.jp/med/download.php?h=8783cc9b8c50aae976d90d28f50f3a0d›, cited 20 September, 2022.
- 28) Kojima H., Haraguchi T., Ikegami S., Nishikawa H., Yoshida M., Ozeki M., Kawasaki I., Uchida T., Chem. Pharm. Bull., 67, 1284–1292 (2019).
- 29) Sato S., “Introduction to gustatory sensation test,” 8th edition, Union of Japanese Scientists and Engineers, Tokyo, 1999, p. 147.
- 30) Ikeda H., Moriwaki H., Yukawa M., Iwase Y., Ando H., Yakugaku Zasshi, 130, 1589–1595 (2010).
- 31) Yoshida M., Kojima H., Uda A., Haraguchi T., Ozeki M., Kawasaki I., Yamamoto K., Yano I., Hirai M., Uchida T., Chem. Pharm. Bull., 67, 404–409 (2019).
- 32) Yukawa J., Aneobi M., Takeuchi H., Pharm. Tech. Jpn., 28, 465–467 (2012).
- 33) Inagaki S., Kagawa Y., Nagase K., Sumida K., Hosp. Pharm., 18, 139–147 (1992).