Regular Article
Comparison of Phosphate and Bicarbonate Buffer Solutions as Dissolution Test Media for Predicting Bioequivalence of Febuxostat Formulation
2024 Volume 72 Issue 11 Pages 989-995
Details
2024 Volume 72 Issue 11 Pages 989-995
The purpose of the present study was to compare phosphate buffer (PPB) and bicarbonate buffer (BCB) solutions as dissolution test media for predicting the bioequivalence (BE) of an immediate-release (IR) formulation. Febuxostat was used as a model of free acid drugs. One reference formulation (RF) and three test formulations (TF) were employed in this study. The clinical BE studies involved 18 to 24 healthy adult volunteers. Each formulation was orally administered in the fasted state. The compendial paddle apparatus was used for the dissolution tests (500 mL, 37 °C, 25 or 50 rpm). BCB (10 mM, pH 6.8, 140 mM NaCl) and PPB (2.5 to 25 mM, pH 6.8, 140 mM NaCl) were used as dissolution media. The pH value of BCB was maintained by the floating lid method. In the clinical BE studies, two TFs were BE to RF, whereas one TF was non-BE. At a paddle speed of 50 rpm, RF and TFs showed little or no difference in the dissolution profiles in all buffer solutions. At 25 rpm, the dissolution profiles in 2.5 mM PPB and 10 mM BCB were consistent with the clinical BE results. The in vitro–in vivo correlation between Cmax ratio and dissolved% ratio at each time point was highest for 10 mM BCB at 25 rpm. These results suggest that the use of BCB increases the BE predictability of dissolution tests.
For a generic drug product to be approved, the bioequivalence (BE) between the original and generic drug products must be proven by a clinical BE study.1–4) In generic drug development, in vitro dissolution tests are routinely used to predict the bioequivalence between the original drug product and test formulations. As dissolution media, phosphate buffer (PPB) solutions have been widely used for BE prediction.5–9) However, a dissolution test using PPB often fails to predict BE.10,11) One of the reasons would be that PPB is not a physiological buffer species. To increase the BE predictability of dissolution tests, the dissolution media should mimic physiological gastrointestinal fluids as closely as possible. The pH value of the intestinal fluid is maintained by bicarbonate buffer (BCB).12–14) Therefore, BCB should be used as dissolution media for BE prediction.
BCB has unique pH neutralization kinetics. The hydration reaction of CO2 (CO2 + H2O→H2CO3) is significantly slower than its reverse reaction.
 | (1) |
The mean reaction times of hydration and dehydration are 9.6 and 0.013 s, respectively (37 °C).15) On the other hand, the mean diffusion time of CO2 to pass through the unstirred water layer (boundary layer) adjacent to a drug particle is much shorter (for a particle of 10 µm radius, it is <0.01 s). Therefore, the pH value at the dissolving particle surface of ionizable drugs differs between BCB and PPB, resulting in a difference in the dissolution rates, even when the pH and buffer capacity values in the bulk phase are identical. For example, the dissolution rate of ibuprofen (free acid) was reported to be slower in BCB than in PPB.12,15,16) Recently, it has been reported that the dissolution profiles of various drug substances and products in BCB markedly differ from those in PPB.17–23) In addition, it has been reported that BCB is superior to PPB for predicting the bioequivalence of enteric-coated and taste-masking formulations.24–28) However, the advantage of BCB for predicting the bioequivalence of an immediate-release (IR) formulation has been unclear.
The purpose of the present study was to compare PPB and BCB as dissolution test media for predicting the bioequivalence of IR formulations. In this study, febuxostat (free acid) was used as a model drug. The clinical BE studies of the original drug product (reference formulation, RF) and test formulations (TF) were conducted in healthy adult volunteers under the fasted condition. A pH 6.8 10 mM BCB solution was used for the dissolution test representing the small intestine. The PPB solutions of 2.5, 12.5, and 25 mM (pH 6.8) were used as controls. The floating lid method was used to maintain the pH value of BCB. The same floating lid was also used for PPB to align the experimental conditions.
Febuxostat is categorized as a low solubility/high permeability drug (biopharmaceutics classification system (BCS): class II), based on the physicochemical properties (pKa = 3.3 (acid), the octanol–water partition coefficient (log Poct) = 4.9, and the intrinsic solubility of unionized species (S0) = 0.07 µg/mL at 25 °C (drug product information)). The dissolution of febuxostat in the stomach would be negligible because the solubility is poor at pH 1.2 to 4.0 (<2 µg/mL). On the other hand, the solubility in the small intestine (SSI) is estimated to be >200 µg/mL (e.g., pH 6.8). The dose number (Do) at this pH is <1.0 (Do = Dose/(SSI × V), the fluid volume (V) = 250 mL, Dose = 40 mg). Therefore, febuxostat shows high solubility/high permeability in the small intestine.29) The plasma concentration half-life (T1/2) of the initial distribution phase is about 2 h that is shorter than the intestinal transit time (about 3.5 h).30) In the case of a drug with such physicochemical and pharmacokinetic properties, the bioequivalence of Cmax is liable to a small difference in the dissolution rate of its formulation.31,32) Therefore, it is critically important to use an appropriate medium in a dissolution test for predicting the bioequivalence of febuxostat formulations.
Feburic (febuxostat) 40 mg tablet was purchased from Teijin Pharma Limited (Tokyo, Japan). The test formulations (TF) of febuxostat 40 mg tablet (FBX-1, FBX-2, and FBX-3) were manufactured by Towa Pharmaceutical Co., Ltd. (Osaka, Japan). The manufacturing methods were the same for all test formulations, including granulation, mixing, and tableting. The compositions of Feburic (reference formulation (RF)) and TFs are shown in Table 1. Feburic contains febuxostat crystals with a melting point of 209 °C (particle size not available) (drug product information). Febuxostat in FBX-1 was a different crystal form (particle size: D90 = 10.7 µm). Febuxostat in FBX-2 and FBX-3 was another different crystal form (particle size: D90 = 3.3 µm).
| Excipients | Feburic | FBX-1 | FBX-2 | FBX-3 |
|---|---|---|---|---|
| Lactose | + | + | + | — |
| D-Mannitol | — | — | — | + |
| Partly pregelatinized starch | + | + | + | + |
| Hydroxypropyl cellulose | + | + | + | + |
| Croscarmellose sodium | + | + | + | + |
| Magnesium stearate | + | + | + | + |
| Hypromellose | + | + | + | — |
| Macrogol | + | + | + | — |
| Talc | — | — | — | + |
| Aminoalkyl methacrylate copolymer E | — | — | — | + |
NaH2PO4 H2O, NaHCO3, NaCl, 6 N HCl, and 8 N NaOH were purchased from FUJIFILM Wako Pure Chemical Corporation (Osaka, Japan). The floating lid (made of acrylic, 5 mm thick) was purchased from PHYSIO MCKINA Co., Ltd. (Saitama, Japan). The floating lid was designed to cover the surface of a test solution almost completely (>95% of the surface area).17,33)
MethodsClinical BE StudyThe BE study was performed by an open-label, randomized, two-period crossover design. Towa Pharmaceutical Co., Ltd. was commissioned to conduct the clinical study. The BE study was conducted following the Japanese BE guidelines.34) Subjects were healthy Japanese males aged 20 to 40 years with a body mass index of 18.5 to 24.9 kg/m2. The subjects had been fully informed of the purpose and details of the study and the investigational drug and had given their written consent to participate in the study of their own free will. The main exclusion criteria were as follows: subjects with a medical history considered inappropriate for the study, subjects with a history of gastrointestinal surgery that may affect the absorption of the drug, and other subjects deemed inappropriate by the investigators. The number of subjects was determined based on the results of the preliminary clinical studies of each formulation. The number of subjects in this study was more than 18 and thus had sufficient power to demonstrate BE. Subjects were randomized using a Latin case design. Subjects took one tablet with approximately 150 mL of water after a minimum of 10 h of fasting. The minimum dosing interval for each treatment period was 5 d. Blood samples were drawn at predefined time points. Blood samples were centrifuged, and plasma was collected and stored light-shielded and frozen at −20 °C until measurement. The plasma concentrations of febuxostat were determined by a validated bioanalytical method using liquid chromatography-tandem mass spectrometry (LC-MS-MS). LC-10A (Shimadzu Corp., Japan), API 4000 (AB Sciex Pte. Ltd., U.S.A.), and Xbridge C18 column (50*2.1 mm i.d., 5 µm) were used. A gas temperature of 600 °C and an ion spray voltage of 5500 V were used to measure febuxostat and internal standard. The limit of quantification (LOQ) was 0.002 µg/mL. Statistical analysis was performed according to the Japanese BE guidelines. Pharmacokinetic parameters (AUCt and Cmax) were log-transformed and 90% confidence intervals of the mean difference between RF and TFs were calculated. The study was conducted following Good Clinical Practice and was approved by the Ageo medical hospital’s Investigational Review Board.
Dissolution TestThe paddle dissolution test using BCB was performed as previously reported.33) In brief, a NaHCO3 solution (10.2 mM, 490 mL, 140 mM NaCl) was added to the vessel. The surface of the solution was covered with a floating lid. An HCl solution (0.113 N, 10 mL) was added to adjust the pH value to 6.8 (final conditions: BCB = 10 mM, fluid volume = 500 mL).12,35,36) The paddle speed and the temperature were set at 25 or 50 rpm and 37 °C, respectively. One tablet was placed in the vessel and the dissolution test was started (NTR-6200A; Toyama Sangyo, Osaka, Japan). A sample solution (1 mL) was taken at each sampling time and immediately filtered (0.22 µm polyvinylidene difluoride, Millipore Corporation, Billerica, MA, U.S.A.). The first few drops of the filtrate were discarded to avoid filter adsorption. The filtrate was diluted with methanol. Drug concentrations were determined at 314 nm by a UV meter (SH1000lab, Hitachi High-Technologies Corporation, Tokyo, Japan). Each dissolution test was performed in triplicate.
The dissolution test using PPB was performed as follows. A PPB solution (2.5 to 25 mM phosphate, 140 mM NaCl, pH 6.8, 500 mL) was added to the vessel. Because the flow pattern may be affected by the floating lid, it was also used for PPB to align the experimental conditions between PPB and BCB. The other procedures were the same as those for BCB.
The buffer capacity was calculated by the van Slyke equation using the pKa values of BCB (pKa = 6.05) and PPB (pKa = 6.69) (ionic strength = 0.15 M, 37 °C).37,38)
Calculation of f2 ValueThe f2 function (Eq. 2) was used to quantify the similarity of the dissolution profiles of two formulations. Dissolution similarity is determined as f2 ≥ 50 (similar) or f2 < 50 (dissimilar).1) If RF dissolved more than about 85% on average, sampling points up to about 85% were used for the calculation. If RF did not dissolve more than about 85% on average, all sampling points (6 time points) were used.
 | (2) |
where n is the number of sampling time points, and Ri and Ti are the dissolved percentage (%) of RF and TF at time t, respectively.
In Vitro–in Vivo CorrelationThe in vitro–in vivo correlation (IVIVC) was evaluated by the determination coefficient (R2) between Cmax ratio and the dissolved percentage (D%) ratio (TF/RF) at early (15 min), middle (30 min), and late stages (60 min) of the dissolution profiles (D%15 min, D%30 min, and D%60 min, respectively) according the FDA guideline.1)
The plasma concentration (Cp)–time profiles after the oral administration of RF and TFs are shown in Fig. 1. The pharmacokinetic parameters are summarized in Table 2. In all cases, Tmax was about 1.2 to 1.6 h. The T1/2 of the distribution phase was roughly estimated to be 1 to 2 h from the two time points after Cmax. The results of the statistical analysis of AUC and Cmax are shown in Table 3. Formulations were judged BE if the 90% confidence interval was between 0.80 and 1.25 for both AUC and Cmax.1) FBX-1 and FBX-3 were BE with RF, whereas FBX-2 was non-BE (Table 3).

| Formulation | Subject number | AUCt (µg·h/mL)a) | Cmax (µg/mL)a) | Tmax (h)a) |
|---|---|---|---|---|
| RFb) | 60 | 6.35 ± 1.73 | 2.22 ± 1.08 | 1.56 ± 1.42 |
| FBX-1 | 18 | 6.25 ± 1.78 | 2.12 ± 1.14 | 1.53 ± 0.61 |
| FBX-2 | 18 | 6.27 ± 1.91 | 2.51 ± 0.97 | 1.21 ± 0.78 |
| FBX-3 | 24 | 6.30 ± 1.31 | 2.28 ± 0.61 | 1.52 ± 0.79 |
a) Mean ± S.D. b) Average of all BE studies.
| Formulation | Subject number | 90% confidence intervala) Geometric mean ratio (lower–upper) | Judge | |
|---|---|---|---|---|
| AUCtb) | Cmaxc) | |||
| FBX-1 | 18 | 1.03 (0.95–1.11) | 0.96 (0.83–1.12) | BE |
| FBX-2 | 18 | 1.09 (1.00–1.18) | 1.22 (0.97–1.52) | Non-BE |
| FBX-3 | 24 | 0.98 (0.94–1.03) | 0.99 (0.89–1.11) | BE |
a) Log-transformed. Bioequivalence criterion: 90% confidence interval between 0.80 and 1.25. b) AUCt: area under the curve. c) Cmax: maximum plasma concentration.
The paddle rotation speed was first set at 50 rpm according to the Japanese guideline. The pH and concentration of PPB were the same as the Japanese pharmacopeia 2nd fluid for dissolution tests (JP2) (pH 6.8, 25 mM). The pH of BCB was aligned with PPB. The concentration of BCB was set to 10 mM to be relevant to the physiological condition in the small intestine.16,39)
Figure 2 shows the dissolution profiles of Feburic (RF), FBX-1, FBX-2, and FBX-3 in PPB (25 mM) and BCB (10 mM) at 50 rpm. The change in pH before and after the dissolution test was within ±0.2 pH units for all formulations. At 50 rpm, little or no difference was observed between RF and TF in the dissolution profiles in both PPB and BCB. The dissolution rates of all formulations were slightly decreased in BCB compared to PPB. Because the dissolution of all the formulations was rapid (> 85% in 30 min), the similarity judgment by the f2 value was not conducted.

Since the dissolution test at 50 rpm was not discriminatory, the paddle speed was reduced to 25 rpm. The dissolution rates of all formulations were slower at 25 rpm compared to 50 rpm in both PPB and BCB40,41) (Fig. 3). The change in pH before and after the dissolution test was within ±0.2 pH units for all formulations. In PPB, although the dissolution profile of RF and TF slightly differed, the f2 values indicated they were similar. This result was inconsistent with the clinical BE results (Tables 3, 4). On the other hand, by using BCB, it was able to discriminate the dissolution profiles of the three test formulations, with FBX-1 being closer to RF. The f2 values suggested the dissolution profiles in BCB at 25 rpm were consistent with the clinical BE results.

| Formulation | f2 Value (similarity judgmenta)) | |||
|---|---|---|---|---|
| PPB (2.5 mM) | PPB (12.5 mM) | PPB (25 mM) | BCB (10 mM) | |
| FBX-1 | 62 (S) | 46 (D) | 57 (S) | 71 (S) |
| FBX-2 | 45 (D) | 53 (S) | 50 (S) | 29 (D) |
| FBX-3 | 70 (S) | 56 (S) | 53 (S) | 50 (S) |
a) S: Similar, D: Dissimilar.
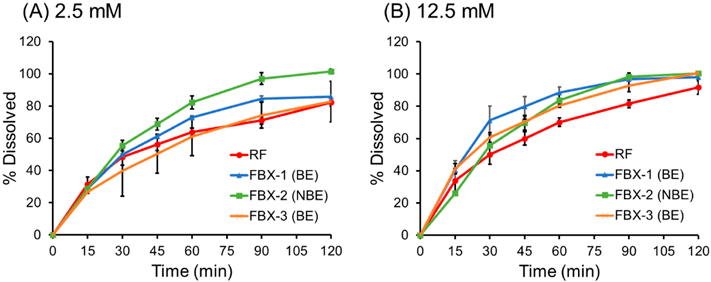
To investigate whether it is possible to predict clinical BE by reducing the buffer concentration of PPB, dissolution tests were additionally performed using PPB of 2.5 and 12.5 mM at 25 rpm (Fig. 4). The change in pH before and after the dissolution test was within ±0.2 pH units for all formulations. The dissolution rate was reduced as the buffer concentration was reduced. The f2 value of the dissolution profiles in 2.5 mM PPB was consistent with the clinical BE results, while that in 12.5 mM PPB was not (Table 4).
Cmax was used for IVIVC because Cmax is considered to reflect differences in the dissolution rates between the formulations. AUCt was not analyzed because all test formulations were BE regarding AUCt. The relationship between the Cmax ratio and D%15 min, D%30 min, and D%60 min ratio at 25 rpm are shown in Fig. 5. The determination coefficients (R2) are summarized in Table 5. The dissolution profiles in BCB (25 rpm) exhibited the highest correlation.

(A) PPB (2.5 mM), (B) PPB (12.5 mM), (C) PPB (25 mM), and (D) BCB (10 mM).
| Species | Buffer | R2 | ||
|---|---|---|---|---|
| Concentration (mM) | D%15 min ratio | D%30 min ratio | D%60 min ratio | |
| PPB | 2.5 | 0.209 | 0.505 | 0.603 |
| 12.5 | 0.991 | 0.064 | 0.624 | |
| 25 | 0.956 | 0.997 | 0.544 | |
| BCB | 10 | 0.952 | 0.885 | 0.973 |
The Tmax value of febuxostat in the clinical BE studies was about 1/3 of the intestinal transit time, suggesting a rapid absorption after oral administration. This is in good agreement with that febuxostat is a high solubility/high permeability drug in the small intestine. The T1/2 of the distribution phase was estimated to be 1 to 2 h, in good agreement with the previously reported value.30) As discussed in the introduction, a high solubility/high permeability drug with a short T1/2 value is liable to non-BE of Cmax due to a small difference in the dissolution rates.31,32)
The dissolution profiles of febuxostat in 2.5 mM PPB and 10 mM BCB at 25 rpm were consistent with the clinical BE results.16,42) Although the f2 values suggested that both buffer solutions can be used for BE prediction, the IVIVC suggested that 10 mM BCB is more predictive for Cmax. At 25 rpm, slight differences in the dissolution profiles of RF and TF were observed in 12.5 and 25 mM PPB. However, these dissolution profiles were not consistent with the clinical BE results. At 50 rpm, the dissolution profiles of RF and TFs were almost the same, also not consistent with the clinical BE results. Taken together, 10 mM BCB and 25 rpm were suggested to be the most appropriate dissolution test conditions representing the human small intestine for BE prediction. BCB is the physiological buffer species of intestinal fluids, however, PPB is not. The lower paddle speed may have resulted in hydrodynamic conditions closer to the human small intestine.40,41) Therefore, to improve BE predictability, the dissolution test conditions should be as relevant to the gastrointestinal environment as possible.
The results of the present study suggested that the current compendial dissolution test using 25 mM PPB (JP2) is not discriminative between BE and non-BE formulations for febuxostat. Previously, similar results were reported for dexketoprofen.43) Dexketoprofen is BCS class I drug (high solubility/high permeability) with a short T1/2 value. Ibuprofen is another example of a high solubility/high permeability drug (in the small intestine, not in the stomach) with a short T1/2 value,44) for which the BE of Cmax could not be predicted by a compendial dissolution test using PPB. These results suggest that the current compendial dissolution test using PPB can be improved to be more biologically relevant. Further extensive evaluations using other drugs are required to confirm the most BE-predictive conditions of dissolution tests.
In the present study, RF, FBX-1, and FBX-3 dissolved slower in BCB than in PPB. The dissolution rates in 2.5 mM PPB and 10 mM BCB were similar, even though the buffer capacity of 2.5 mM PPB (β = 1.4 mM/pH) is smaller than that of 10 mM BCB (β = 3.1 mM/pH). These results were in good agreement with the kinetics of surface pH neutralization by BCB.16) However, the dissolution rate of FBX-2 is less affected by buffer species and concentration. Due to the small particle size of the active pharmaceutical ingredient (API) in FBX-2 (D90 = 3.3 µm), they dissolved rapidly, and no effect of pH neutralization rate at the dissolving surface might have been observed.45) The particle size and crystal form of API in FBX-2 and FBX-3 were the same. Therefore, the differences in the dissolution rates between FBX-2 and FBX-3 were attributed to the different additives (Table 1). FBX-3 contains aminoalkyl methacrylate copolymer E. The dissolution of this polymer has been reported to be slower in BCB than in PPB,18) in good agreement with the result of the present study.
Previously, BCB has not been widely used in dissolution tests for practical reasons. When using a conventional dissolution test apparatus, the pH value of BCB increases because CO2 quickly volatilizes from the solution (Eq. 1). The CO2 gas bubbling method has been utilized to compensate for the loss of CO2 during a dissolution test.46,47) This method can rigidly maintain the pH value for a long time. However, this method requires special equipment and is operationally complicated. In addition, CO2 bubbling induces the foaming of surfactants such as bile acid and Tween 80. Furthermore, the stimulation by gas bubbling can induce non-physiological effects on drug precipitation.23) Recently, the floating lid method has emerged as an innovative method to use BCB in dissolution tests.33) The floating lid prevents CO2 volatilization and maintains the pH level at least for several hours.10,33) The floating lid method is simple and reproducible. It enables the use of surfactants and mitigates the non-physiological effects of gas bubbling. The floating lid has already been applied to various dissolution apparatuses such as conventional paddle, mini-paddle, and flow-through dissolution tests.10,20,22) The results of this study suggest that the floating lid method can be used for the BE prediction of an IR formulation.
In conclusion, the dissolution profiles in 10 mM BCB at 25 rpm were most consistent with the clinical BE results for the febuxostat IR formulations. BCB would be a promising medium for accurately predicting BE for the IR formulations of free acid drugs. The results of this study would be a significant contribution to enhancing the accuracy of BE predictions by in vitro dissolution tests.
The authors declare no conflict of interest.