Abstract
Powders used in pharmaceuticals require good flowability. The angle of repose and compressibility index are often used to measure the flowability of pharmaceutical powders. However, confirming the relationship between external forces and flowability for smooth powder handling is necessary. Therefore, we measured pharmaceutical excipient powder using a lower cell direct movable constant-volume shear tester and evaluated the powder’s physical properties. In this study, we utilized microcrystalline cellulose, widely used as a pharmaceutical excipient and developed in many grades with different physical properties such as particle shape. We measured the shear parameters that describe the characteristic friction and cohesion properties of each microcrystalline cellulose grade. We found that the relative compression ratio (RCR) correlated with the angle of repose. Differences in the shape of the powder yield locus were observed among the grades, and the ratio of the upward convex area of the powder yield locus curve (APC) was defined as the value that quantified these differences. Furthermore, to clarify the relationship between the particle shape parameters (e.g., particle size distribution and shape) and shear parameters, we analyzed these factors using partial least squares regression. RCR was correlated with linearity and was significantly influenced by particle shape. Accurate prediction formulas were also calculated for the stress transmission and relaxation ratios. There was no correlation with the individual shape parameters, and these are considered that is involved in a complex combination. In APC, in addition to the shape parameters used in this study, bulk density had a significant effect.
Introduction
Powders used in pharmaceuticals must have good flowability. Poor flowability hinders their transport and supply, leading to inconsistent drug content and an inability to produce homogeneous pharmaceutical products. Tableting failures, such as sticking, in which powder coheres to tablet punches and damages the tablet, and capping, in which the top or bottom of the tablet peels off, can occur. Many complex particle properties influence the flowability of a powder, for example, the particle size distribution, shape, density, and surface roughness; bulk density; and interparticle adhesion. Measuring flowability is complex, and an appropriate evaluation method must be selected.1) A wide variety of methods have been proposed to evaluate flowability, and the general information in the Japanese Pharmacopoeia lists four methods: the angle of repose, the compressibility index and the Hausner ratio, flow through an orifice, and shear cell methods.2) The angle of repose, compressibility index, and flow through an orifice are mainly measured under gravity. They are highly dependent on the measurement method, do not have very high reproducibility or detection sensitivity, and is not suitable for measuring cohesive powders.2–4) The shear cell method has been added in detail to supplement I of the 18th edition of the Japanese Pharmacopoeia, and its importance is being recognized. When powders are used, there are many situations in which pressure is applied, such as tableting pressure and the weight of the powder itself during storage, discharge, supply, and transportation. Therefore, it is necessary to evaluate the relationship between pressure and flowability for smooth powder manipulation. One of the reasons the shear cell method has attracted attention is that it can measure flowability under stress conditions. This method enables cohesive powder measurement. A lower cell movable constant-volume shear tester is a device used in this method. Its advantages include applying any load from high to low, measuring small samples, measuring high cohesion and poor flow powders such as nanoparticles, and obtaining many physical property parameters in a single measurement.5–8)
As mentioned above, the flowability of powders is affected by various particle properties. Among them, particle size and shape influence flowability. Yu et al. reported that the flow function coefficient of pharmaceutical excipients, obtained using the Schulze Ring Shear Tester RST-XS, can be predicted from particle size and shape, such as the aspect ratio.9) Horio et al. reported the effect of the particle aspect ratio on the flowability of pharmaceutical excipients measured by the vibration shear tube method.4) Takeuchi et al. showed the effect of circularity on the angle of internal friction of pharmaceutical excipients measured with the FT4 Powder Rheometer.10) Goh et al. examined the relationship between general flowability parameters, including shear properties obtained by the FT4 Powder Rheometer for pharmaceutical powders, and circularity and particle size distribution.11) Kudo et al. reported the particle size distribution on the flowability of pharmaceutical powders measured by the vibration tube method.12)
This study focused on microcrystalline cellulose (MCC) with fibrous particles to better understand the relationship between particle shape and flowability. Many MCC grades with different particle shapes and size distributions have been developed, and MCC is available in both granular and fibrous forms. MCC consists of α-cellulose composed of only crystalline parts with the amorphous parts removed. It is insoluble in water and organic solvents. Because it is chemically stable, it does not react with active pharmaceutical ingredients and is a useful excipient. Since it has relatively good compression moldability and flowability, it is often made into tablets using direct compression. Using various MCC samples, the only difference being the particle size and shape, facilitates studies on the relationship between shear parameters and particle shape.
Partial least squares (PLS) regression was used for analysis. PLS regression can be applied even when there is a correlation among explanatory variables (multicollinearity) or when there are more explanatory variables than samples. However, nonlinear data cannot be evaluated. In the pharmaceutical field, PLS is widely used to build predictive models for tablet strength,13) hoppers,14) and inhalers,15) and for correlation analysis of powder properties.16) The particle shape parameters adopted in this study were quantified from scanning electron micrographs (SEM) and may be correlated. Furthermore, since the sample size was small, we considered PLS regression appropriate.
The constant-volume shear tester NS-S500 used in this study can measure the vertical force acting on a shear plane, which other shear testers cannot, and analysis can be performed based on this force to obtain more accurate results.5) For this reason, finding a novel relationship between shape parameters and differences in shear parameters may be possible. Thus, we aimed to utilize the characteristics of this device to assist in powder property analysis of pharmaceutical excipients. We attempted to quantify the differences in the shape of the powder yield locus (PYL).
Results and Discussion
Particle Shape and Size DistributionFigure 1 shows SEM images of the MCC samples. Five shape parameters were obtained from these images: convexity (CON), circularity (CIR), linearity (LIN), aspect ratio (AR), and surface characteristic value (SCV). Table 1 shows each particle shape parameter and the particle size distributions D10, D50, and D90. The data are consistent with the information provided by the sample supplier: PH-F20JP and OD-20P are fine particles, and KG-802 and KG-1000 are fibrous particles. These characteristics are also illustrated in Fig. 1.
Table 1. Particle Size Distribution and Shape Parameters
| Materials | D10 (µm) | D50 (µm) | D90 (µm) | CON (—) | CIR (—) | LIN (—) | AR (—) | SCV (—) |
|---|
| PH-101 | 18.52 ± 1.28 | 52.98 ± 0.62 | 99.75 ± 0.23 | 0.89 ± 0.01 | 0.53 ± 0.02 | 2.73 ± 0.22 | 2.66 ± 0.18 | 2072.66 ± 109.91 |
| PH-102 | 25.38 ± 0.68 | 86.08 ± 1.85 | 167.71 ± 0.36 | 0.87 ± 0.02 | 0.50 ± 0.06 | 2.93 ± 0.34 | 2.69 ± 0.29 | 2092.74 ± 98.51 |
| PH-200 | 25.24 ± 0.95 | 108.90 ± 2.36 | 216.27 ± 6.10 | 0.77 ± 0.09 | 0.47 ± 0.15 | 1.84 ± 0.08 | 1.61 ± 0.04 | 1969.59 ± 388.14 |
| PH-301 | 18.83 ± 0.71 | 54.29 ± 1.71 | 99.54 ± 1.20 | 0.83 ± 0.04 | 0.49 ± 0.02 | 2.35 ± 0.49 | 1.91 ± 0.43 | 1665.70 ± 67.44 |
| PH-302 | 22.95 ± 0.82 | 84.40 ± 2.51 | 154.98 ± 2.87 | 0.85 ± 0.00 | 0.48 ± 0.02 | 2.79 ± 0.10 | 2.48 ± 0.09 | 1919.03 ± 28.25 |
| PH-F20JP | 5.73 ± 0.12 | 17.37 ± 0.39 | 36.76 ± 0.24 | 0.74 ± 0.03 | 0.31 ± 0.03 | 2.91 ± 0.23 | 1.95 ± 0.23 | 1821.09 ± 66.84 |
| UF-702 | 23.03 ± 0.23 | 98.84 ± 1.98 | 183.99 ± 1.16 | 0.83 ± 0.06 | 0.50 ± 0.14 | 2.37 ± 0.71 | 2.03 ± 0.72 | 2019.33 ± 199.91 |
| UF-711 | 20.21 ± 0.18 | 53.67 ± 0.84 | 96.43 ± 3.05 | 0.83 ± 0.01 | 0.46 ± 0.04 | 2.39 ± 0.56 | 2.21 ± 0.58 | 2159.95 ± 75.84 |
| KG-802 | 17.59 ± 0.25 | 52.28 ± 0.63 | 99.53 ± 0.70 | 0.85 ± 0.02 | 0.41 ± 0.04 | 3.28 ± 0.39 | 3.16 ± 0.61 | 2213.32 ± 77.92 |
| KG-1000 | 13.96 ± 0.27 | 44.49 ± 1.10 | 99.72 ± 0.78 | 0.87 ± 0.03 | 0.38 ± 0.09 | 4.19 ± 0.56 | 3.58 ± 0.40 | 2242.36 ± 247.86 |
| OD-20P | 6.16 ± 0.07 | 16.18 ± 0.09 | 32.22 ± 0.12 | 0.80 ± 0.02 | 0.38 ± 0.03 | 2.88 ± 0.14 | 2.56 ± 0.24 | 2424.36 ± 246.11 |
Data are presented as mean ± standard deviation (n = 3).
Table 2 shows the shear parameters of the MCC samples measured in a constant-volume shear tester NS-S500. The compression properties before shearing are the relative compression ratio (RCR), bulk density, stress transmission ratio, and stress relaxation ratio. The shear properties are the angle of the critical state line (CSL), the angle of internal friction, shear cohesion, and ffc. Figure 2 shows each sample’s PYL and consolidation yield locus (CYL).
Table 2. Properties Obtained by NS-S500 Shear Tests
| Materials | φCSL (°) | γΤ (%) | γRU (%) | RCR (%) | ρb (kg/m3) | φi (°) | C (kPa) | ffc (—) |
|---|
| PH-101 | 48.03 ± 1.15 | 71.10 ± 1.75 | 28.70 ± 0.16 | 8.00 ± 0.31 | 453.33 ± 9.43 | 45.17 ± 2.98 | 18.13 ± 3.94 | 3.69 ± 0.81 |
| PH-102 | 40.20 ± 0.41 | 77.87 ± 9.53 | 27.47 ± 1.48 | 7.98 ± 0.48 | 410.00 ± 8.16 | 33.53 ± 1.61 | 36.00 ± 1.42 | 1.80 ± 0.12 |
| PH-200 | 38.49 ± 0.30 | 69.87 ± 3.53 | 27.77 ± 0.65 | 7.31 ± 0.27 | 423.33 ± 4.71 | 34.87 ± 0.91 | 29.43 ± 1.54 | 2.08 ± 0.11 |
| PH-301 | 35.03 ± 0.97 | 61.70 ± 2.16 | 28.93 ± 1.44 | 7.32 ± 0.15 | 547.50 ± 4.33 | 32.10 ± 0.87 | 9.03 ± 2.73 | 11.06 ± 3.64 |
| PH-302 | 34.68 ± 0.61 | 77.57 ± 6.50 | 30.57 ± 2.10 | 5.86 ± 0.08 | 513.33 ± 4.71 | 31.93 ± 0.90 | 7.80 ± 5.38 | 18.60 ± 13.59 |
| PH-F20JP | 45.10 ± 0.64 | 70.60 ± 2.54 | 31.50 ± 0.54 | 11.13 ± 0.27 | 516.67 ± 4.71 | 45.93 ± 1.14 | 26.17 ± 3.59 | 1.90 ± 0.12 |
| UF-702 | 47.54 ± 0.39 | 87.37 ± 1.11 | 30.63 ± 1.61 | 7.27 ± 0.57 | 390.00 ± 8.16 | 46.67 ± 0.63 | 13.77 ± 0.33 | 3.68 ± 0.13 |
| UF-711 | 48.33 ± 0.73 | 79.87 ± 1.03 | 28.00 ± 0.83 | 9.14 ± 0.36 | 390.00 ± 0.00 | 47.90 ± 2.21 | 17.83 ± 3.63 | 3.23 ± 0.66 |
| KG-802 | 40.85 ± 0.46 | 81.60 ± 0.00 | 26.30 ± 1.56 | 11.10 ± 0.22 | 366.67 ± 4.71 | 34.03 ± 7.41 | 39.80 ± 14.94 | 1.90 ± 0.38 |
| KG-1000 | 36.24 ± 0.61 | 81.93 ± 0.80 | 26.33 ± 1.36 | 17.16 ± 0.54 | 310.00 ± 0.00 | 27.67 ± 6.40 | 41.70 ± 4.93 | 1.54 ± 0.10 |
| OD-20P | 38.19 ± 0.86 | 81.20 ± 1.84 | 31.43 ± 1.60 | 12.62 ± 0.25 | 463.33 ± 4.71 | 32.13 ± 1.45 | 38.20 ± 3.01 | 2.15 ± 0.20 |
Data are presented as mean ± standard deviation (n = 3).
RCR was calculated using the maximum and minimum powder bed heights when shear tests were conducted at initial vertical forces of 10, 15, and 20 N after pre-shearing. The formula is as follows:
 | (1) |
where HPmax is the maximum powder bed height, and HPmin is the minimum powder bed height in the shear cell. The RCR is large for PH-F20JP and OD-20P, fine powders, and KG-802 and KG-1000, fibrous particles (Table 2). Smaller particle size powders have greater cohesion and friction and poorer flowability.5,17) Fibrous particles also have poor flowability as the particles become tangled. The RCR results are consistent with these facts. Figure 3 shows the relationship between the RCR and the angle of repose. The sample supplier provided the angle of repose values. The coefficient of determination (R2) produced by linear regression analysis was 0.69, indicating a correlation. The RCR, like the angle of repose, represents static flowability.
Bulk density ρb was calculated from the powder bed height at the critical state when the shear test was performed with an initial vertical force of 30 N. ρb, like the RCR, is an expression of powder compression properties; it did not correlate with the RCR (Supplementary Fig. 1). There was no correlation between ρb when compressed at 30 N and the angle of repose (Supplementary Fig. 2), which represents flowability under gravity. However, since the RCR can reflect the state during non-compaction, a correlation with the angle of repose was observed.
Stress Transmission RatioThe lower normal stress (normal stress on the shear plane) is smaller than the upper normal stress because the upper normal stress is reduced by the friction that occurs between the powder bed and the side wall of the shear cell. This phenomenon is represented by the stress transmission ratio γT, the ratio of lower normal stress to upper normal stress.5,6) The normal stress at the start of shearing at an initial vertical force of 10 N was used to calculate the following equation:
 | (2) |
where σU1 is the upper normal stress at the start of shearing and σS1 is the lower normal stress at the start of shearing. A larger stress transmission ratio indicates less friction between the powder bed and the side wall of the cell. PH-301 had the smallest value, and UF-702 had the largest value (Table 2). Thus, PH-301 has high friction with the side wall, while UF-702 has low friction.
Stress Relaxation RatioWhen the powder bed is compressed, the location and orientation of these particles change to minimize the stress, and the stress in the powder bed gradually decreases with time, starting immediately after compression is stopped. This phenomenon is called stress relaxation, and the ratio of stress reduction before and after stress relaxation is the stress relaxation ratio γRU.5,6) Here, the maximum upper normal stress σU0 and the upper normal stress σU1 at the start of shearing at an initial vertical force of 10 N were used to calculate the following equation:
 | (3) |
Stress relaxation has often been studied in relation to tablet strength, including preventing capping by stress relaxation.18) The greater the γRU, the greater the cohesion between particles. The fine powders PH-F20JP and OD-20P had high γRU (Table 2), consistent with the theory that fine powders have high cohesiveness.
Angle of Critical State LineThe approximate straight line passing through the origin of the shear stress plot versus normal stress at the critical state for each compression condition is the CSL, and the angle formed between the CSL and the normal stress axis is called the angle of CSL, φCSL (i.e., the angle of dynamic friction of the powder).5–7,19) The critical state points at initial vertical forces of 10, 15, and 20 N were used in the present calculations. φCSL represents the friction property of the powder bed in a dynamic state; the smaller φCSL, the greater the flowability.2,5) φCSL was large for UF-711, PH-101, and UF-702 and small for PH-302 and PH-301 (Table 2). Comparing PH-F20JP and OD-20P, which are fine powders, PH-F20JP had larger values. There was no correlation between φCSL and the angle of repose (Supplementary Fig. 3), and the results were different for φCSL, which evaluates flowability under compression, and the angle of repose, which represents flowability under gravity.
Angle of Internal FrictionThe angle of internal friction indicates static friction. The angle between the PYL and the normal stress axis is the angle of internal friction φi, representing the static friction between powder beds under compression. Unlike φCSL, φi changes depending on the compression conditions.3) In this case, it was calculated as the angle between the normal stress axis and an approximate straight line for the PYL, excluding the low-pressure portion of 30% or less when the initial vertical force was 30 N. The results were large for UF-711, UF-702, and PH-101 and small for PH-302 and PH-301, showing a similar trend to φCSL (Table 2). The larger error for KG-802 and KG-1000 may be because φi is the friction value when the powder starts to move from a stationary state, so more force is required for the fibrous particles to start moving if they are entangled. Meanwhile, shearing proceeds with less force if the particles are less entangled.
Shear CohesionThe shear cohesion C is the intercept value of PYL with respect to the shear stress axis.5–7) An approximate straight line was calculated for PYL, excluding the low-pressure portion of 30% or less. The intercept value was adopted as C, a measure of the powder’s adhesion and cohesion. The smaller the value, the higher the flowability.5,20) C was large for KG-802, KG-1000, and OD-20P and small for PH-302 and PH-301 (Table 2). Since OD-20P is a fine powder, its greater cohesion is a reasonable result. Meanwhile, the C of KG-802 and KG-1000 were large because their fibrous particles became entangled and remained entangled even when normal stress was removed, which may be reflected in the C value.
ffcffc evaluates flowability based on the collapse phenomenon of the powder bed. It is expressed as the ratio of the major principal stress σ1 to the unconfined yield strength fc. The value of σ1 is determined using the Mohr circle passing through the critical state point and the tangent to the PYL. The fc value is determined using the Mohr circle passing through the origin and the tangent to the PYL.2,6) PYL is calculated excluding the low-pressure portion of 30% or less. Applying the flowability guidelines, PH-102, PH-F20JP, KG-802, and KG-1000 were very cohesive; PH-101, PH-200, UF-702, UF-711, and OD-20P were cohesive; and PH-301 and PH-302 were free flowing. PH-301 and PH-302 had low φCSL, φi, and C, i.e., both friction and cohesion are low, so it makes sense that they have good flowability. Additionally, no correlation was observed with the angle of repose, which indicates flowability under gravity (Supplementary Fig. 4).
Powder Yield Locus ShapeThe higher the cohesion, the more upwardly convex is the PYL curve, which is thought to reflect the powder well property.21,22) As shown in Fig. 2, the shape of PYL is distinctive for each MCC grade. PH-301 and PH-302 are straight lines, indicating low cohesion. These samples also have smaller values of C than the others (Table 2). Generally, the smaller the particle size, the greater the cohesion.17) Comparing the PYL curves in Fig. 2 of PH-101, PH-301, UF-711, KG-802, and KG-1000, all of which have a D50 around 50 µm, PH-301 shows a straight curve, while PH-101, UF-711, KG-802, and KG-1000 exhibit upwardly convex curves. PH-101 and UF-711 have a convexity apex at the high-stress side, whereas KG-1000 has a convexity apex at the low-stress side. For PH-102, PH-200, PH-302, and UF-702 with a D50 around 80 µm or larger, PH-302 is straight, UF-702 has a convexity apex in the high-stress side like PH-101 and UF-711, and PH-102 and PH-200 are smoothly convex. PH-F20JP and OD-20P, with a D50 around 20 µm or less, are smoothly convex.
Here, we attempted to quantify the convexity state of PYL. The ratio of the upward convex area of the PYL curve corresponding to the shaded area in Fig. 4, APC, was calculated using the following equation:
 | (4) |
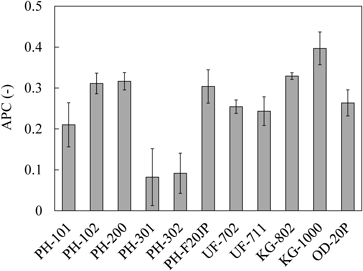
where ACSL is the area of a triangle consisting of CSL and the axis of normal stress, and APYL is the area between PYL and the normal stress axis. Figure 5 shows the APC values. When compared with C, which also indicates cohesion, although there is a similar trend overall, the C of UF-711 and UF-702 is still smaller, though greater than that of PH-301 and PH-302 (Table 2). For APC, the UF series had roughly average values. As with C, the APC of KG-1000 and KG-802 are thought to reflect the effect of fibrous particles becoming entangled. The larger standard deviation of KG-802 in C and the smaller difference from the value of OD-20P suggest that APC is more likely to observe particle entanglement.
Relationship between Physical Properties from Shear Tests and Particle Shape ParametersThe relationship between each shear parameter obtained with the NS-S500 shear tester (Table 2) and shape parameters (Table 1), including the particle size distribution, was analyzed separately; few correlations were found, and many did not show a clear relationship. However, each particle property influences powder properties in a complex way. PLS regression was used to examine these in more depth. The analysis was performed by fitting all particle shape parameters as explanatory variables (X variables) and each shear parameter individually as objective variables (Y variables). Figure 6 shows a schematic diagram of PLS regression. The analysis builds a model equation for predicting Y over the X variables. The constructed model equation is the sum of each X variable multiplied by its derived coefficient, as shown in Fig. 6. The further away from 0 the coefficient is, the greater the influence of X. We also evaluated the variable importance for projection (VIP). The larger the VIP, the more important the X is; X is considered unimportant if it is below 0.8. The effect of the shape parameters was examined using the coefficients and VIP. PLS regression analysis showed that the optimal number of factors for φCSL, φi, and ffc was 0, and no model equation was constructed. These three parameters are thought to be related mainly to powder properties that are not the focus of this study, such as particle hardness, or they have a nonlinear relationship with particle shape parameters. Table 3 summarizes the PLS regression results at the shear parameters for which model equations were obtained. Figure 7 plots the VIP and coefficients for each shape parameter in the PLS equation at standardized shear parameters.
Table 3. Results of PLS Regression Analysis
| NS-S500 parameters | Abbreviation | R2 | Number of factors | Root Mean PRESS | VIP >0.8 or large absolute value of the coefficient Representative values | VIP <0.8 Representative values |
|---|
| Relative compression ratio | RCR | 0.773 | 1 | 0.712 | CIR, LIN | CON |
| Bulk density | ρb | 0.678 | 2 | 0.825 | SCV | D10, D50, D90, CIR |
| Stress transmission ratio of the powder bed | γT | 0.979 | 7 | 0.661 | D50, D90, SCV | CON, CIR |
| Stress relaxation ratio based on the upper force of the powder bed | γRU | 0.994 | 8 | 0.686 | D90, CON | CIR, SCV |
| Angle of the critical state line | φCSL | — | — | — | — | — |
| Angle of internal friction | φi | — | — | — | — | — |
| Shear cohesion | C | 0.725 | 3 | 0.827 | CIR, SCV | CON |
| Flow function coefficient | ffc | — | — | — | — | — |
| Ratio of the upward convex area of the PYL curve | APC | 0.661 | 3 | 1.034 | D90, CIR, SCV | CON |
| APC* | 0.816 | 3 | 0.809 | ρb | D10, D50, CON |
*APC with ρb added to the X variable.
The RCR had large LIN and CIR absolute values of coefficients, and the VIP also had a large value (Fig. 7a). CON was close to 0 for both the VIP and the coefficients, meaning it is unrelated to the RCR. The coefficient of determination (R2) produced by linear regression analysis on the RCR and LIN plots was 0.66; for CIR, R2 = 0.53, indicating a correlation. RCR was significantly affected by particle shape and size. Many factors enable the model to capture complex relationships in the data but may increase the risk of over-fitting. Conversely, when the number of factors is small, the model is simple and easy to interpret, but it may not sufficiently capture the diverse information in the data. In this RCR analysis, the optimal number of factors was 1, meaning a simple relationship exists.
ρb has a large absolute value of the SCV coefficient and VIP (Fig. 7b). The ρb vs. SCV plot showed R2 = 0.44. The VIPs of D10, D50, D90, and CIR were <0.8 and of low importance. ρb had the highest number of X variables below VIP = 0.8, and there may be other variables than those evaluated here that have a significant influence. The PLS regression results are also quite different for the RCR and ρb, indicating that each represents a different powder state.
Stress Transmission RatioThe VIP of the SCV and the D50 and D90 coefficients were large in γT (Fig. 7c). The γT vs. SCV plot showed R2 = 0.51, indicating a correlation. It is reasonable that a correlation was found between γT, which represents the friction with the cell sidewall, and SCV, which is a measure of particle surface roughness. However, the optimal number of factors is as many as 7, and γT also may be intricately related to parameters other than SCV. The VIPs were <0.8 for CIR and CON.
Stress Relaxation RatioIn γRU, D90 and CON had large coefficient absolute values and VIP (Fig. 7d). However, the γRU vs. D90 plot showed R2 = 0.08, and the γRU vs. CON plot showed R2 = 0.27, meaning there were no correlations. Looking at the individual correlations with other shape parameters, none had an R2 > 0.3. However, the actual measured versus predictor value plot does show a correlation of R2 = 0.99, suggesting a combinatorial effect of particle shape parameters. The optimal number of factors was 8, the largest among the models obtained in this study. The VIPs were <0.8 for the SCV and CIR.
Shear CohesionFor C, VIP, the coefficient of the SCV absolute value, and the coefficient of the CIR absolute value were large (Fig. 7e). The VIP was <0.8 for CON. The C vs. SCV plot showed R2 = 0.47, and that vs. CIR showed R2 = 0.30. As with γRU, particle shape parameters interact in a complex manner. The SCV effect, the particle surface roughness, may be more significant than other variables.
The Ratio of the Upward Convex Area of the PYL CurveFor APC, the SCV and CIR coefficient absolute values were large, and the VIPs of SCV and D90 were also large (Fig. 7f). The VIP was <0.8 for CON. The APC vs. SCV plot showed R2 = 0.32, APC vs. CIR had R2 = 0.24, and APC vs. D90 showed R2 = 0.001. Although the influence of SCV is somewhat larger, the particle shape parameters may be involved in a combinatorial manner, similar to γRU and C. However, the R2 for the actual measured and predicted values was 0.66, lower than the other shear parameters. As noted, the difference between C and APC is represented well among the UF grades. Many particle shape parameters were similar when comparing PH-301 and PH-302 with UF-711 and UF-702. In this study, all the samples included were varieties of MCC. The chemical properties of their surfaces, such as van der Waals, electrostatic, and liquid bridge forces, which constitute cohesion forces, are nearly equivalent. PH-301 and PH-302 are characterized by their heavy particles, i.e., their large particle density. The flowability evaluation in shear tests does not reflect the effect of particle density because the force applied is much greater than the particle weight.23) However, APC may distinguish between UF-711 and UF-702 and PH-301 and PH-302, reflecting the particle density effect. The ρb versus APC plot showed R2 = 0.58, whereas that of ρb versus C was R2 = 0.35, which is another reason to consider that APC may better reflect the ρb effect. Furthermore, Fig. 7g shows the results of the PLS regression analysis with bulk density added as an X variable. The R2 between the actual measured and predicted values was 0.82, which is a better prediction accuracy than when ρb is not added. ρb as an X variable had the largest VIP and absolute value of coefficients. This also shows that ρb (particle density) significantly affects APC.
Conclusion
This study measured eight shear parameters for MCC using the lower cell movable constant-volume shear tester NS-S500. We found a correlation between the RCR and the angle of repose. We also propose that APC reflects the upward convexity of the PYL curve. Next, the effects of particle shape parameters, including particle size distributions D10, D50, and D90, and shape properties obtained from SEM photographs on the shear parameters were examined. The results were analyzed using PLS regression analysis and are summarized as follows:
-
(1) No model equations were constructed for φCSL, φi, and ffc. These parameters are highly influenced by particle properties other than the shape parameters examined in this study or have a nonlinear relationship with the shape parameters.
-
(2) RCR was greatly affected by LIN and CIR. Although SCV somewhat influenced ρb, many X variables resulted in a VIP of 0.8 or less, suggesting the involvement of particle properties not assessed in this study.
-
(3) γT, γRU, C, and APC were related to shape parameters intricately. Furthermore, APC was able to distinguish PH-301 and PH-302 from UF-711 and UF-702 with different particle densities, indicating that it is significantly affected by ρb.
By performing PLS regression analysis with the shear and particle shape parameters, we determined shape parameters that affect shear parameters, which helped us understand their properties. We created a model equation to predict shear parameters from particle shape. Thus, predicting the shear parameters using their model equation simply by obtaining particle size distributions and SEM images is possible. However, further improvements are required for the friction angle, such as increasing the number of samples, testing other particle properties, and examining analysis methods to deal with nonlinearity. Our results are expected to be a preliminary survey to select necessary factors for constructing AI-based prediction systems and simulations, which have been the focus of recent attention.
Experimental
MaterialsEleven types of MCC (PH-101, PH-102, PH-200, PH-301, PH-302, PH-F20JP, UF-702, UF-711, KG-802, KG-1000, and OD-20P: CEOLUS, Asahi Kasei Corporation, Tokyo, Japan) were used. The particle characteristics of each sample, as presented by the supplier, using PH-101 as the standard, are as follows: PH-102 and PH-200 have a large particle size. PH-301 and PH-302 are dense and heavy particles with few voids within the particles. PH-F20JP is a cohesive fine powder. UF-702 and UF-711 are porous and rounded particles. KG-802 and KG-1000 are fibrous particles. OD-20P is a fine powder designed for orally disintegrating tablets.
Constant-Volume Shear TesterThe physical properties of MCC were measured using a constant-volume shear tester (model NS-S500, Nano Seeds, Nagoya, Japan).5–8) Figure 8 shows a photograph and schematic diagram of the instrument. The cylindrical shear cell had upper and lower cells made of stainless steel. The upper cell was fixed to the frame, and the lower cell moved horizontally to trigger shear failure. The cells had inner diameters of 15 mm, the upper cell was 40 mm high, the lower cell was 5 mm deep, the clearance between the upper and lower cells was 0.2 mm, the pressing speed of the upper cell was 200 µm/s, and the shear speed was 10 µm/s. Figure 9 shows the forces applied as a function of time during a shear test. The sample was placed into the cell so the height of the powder bed was 25 ± 5 mm and was consolidated by pressing downward with the piston on the top of the powder bed. Consolidation ceased once the target initial force was reached (step i, compression). The powder was allowed to stand for 100 s for stress relaxation (step ii, stress relief), and then shearing was initiated (step iii: consolidation failure). When the normal and shear stresses reached a steady state (critical state), or 4 min passed since the start of the measurement, the powder was expanded and collapsed by gradually attenuating the normal stress while continuing to apply shear forces (step iv, expansion). Preliminary shearing was performed with an initial lower vertical force (i.e., normal force) of 5 N (28.3 kPa), followed by shearing operations at initial lower vertical forces of 10 N (56.6 kPa), 15 N (84.9 kPa), 20 N (113.2 kPa), and 30 N (169.8 kPa). The expansion process was performed during the last 30 N. The YL was obtained by plotting the shear versus the normal stress from the start of shearing to the end of the measurement. The plot from the start of shearing to the critical state (step iii) is the CYL, and the plot from the critical state to the end of the measurement (step iv) is the PYL. The RCR, φCSL, γT, and γRU were obtained using the analysis software NS8 (Nano Seeds). The C, φi, and ffc were obtained using NS9 analysis software (Nano Seeds). The former adopted data for the initial vertical forces of 10, 15, and 20 N, whereas the latter adopted a range of 30–100% of the PYL obtained from data for an initial vertical force of 30 N.
Preparing the Particle Shape ParametersThe particle size distributions were obtained using a laser diffraction particle size analyzer (model LDSA-SPR 3500A, MicrotracBEL, Osaka, Japan) equipped with a dry dispersing apparatus. The particle shapes were observed with SEM (model JCM-7000 NeoScope, JEOL, Tokyo, Japan) with an accelerating voltage of 5–10 kV. The particle shape parameters were calculated using the powder property AI prediction software NS-PIQ ver. 1.01 (Nano Seeds). The software calculated particle shape parameters from three SEM images, including one shown in Fig. 1. Figure 10 shows definitions of particle shape parameters.
CON (Fig. 10a) indicates the degree of unevenness of a particle and is expressed as a value from 0 to 1. The more convex a particle is, the closer it is to 0; the less convex, the closer it is to 1. CON is defined as follows:
 | (5) |
where P is the particle perimeter, and Pc is the perimeter of the convex hull of the particle.
CIR (Fig. 10b) indicates the particle’s proximity to a circle, expressed from 0 to 1, with values closer to 1 being more circular. CIR is defined as follows:
 | (6) |
where Ap is the area of the particle.
LIN (Fig. 10c) indicates the degree to which a particle is linear. It is expressed as a value ≥1. The LIN of a circle is 1, and the value increases as the linear nature increases. LIN is defined as follows:
 | (7) |
where L is the length of the longest line in the particle.
AR (Fig. 10d) indicates the degree of elongation of an ellipse that approximates the particle shape. It is expressed as a value ≥1. The AR of a circle is 1, and the value increases as the particle becomes less circular. AR is defined as follows:
 | (8) |
where Lmax is the length of the major axis of an approximate ellipse, and Lmin is the length of the minor axis of an approximate ellipse.
SCV indicates the surface roughness of a particle. First, the number of pixels in the length and width of a rectangle circumscribing the particle is determined. Next, the sum of the differences between horizontally adjacent pixel values (absolute values) divided by the number of vertical pixels and the sum of the differences between vertically adjacent pixel values (absolute value) divided by the number of horizontal pixels is calculated. The sum of these two values is SCV.
Statistical AnalysisPLS regression was used to examine the relationship between the shear and particle shape parameters. JMP Pro 17.2.0 (JMP Statistical Discovery, Cary, NC, U.S.A.) was used for this analysis. The data were standardized by JMP. The algorithm used the most typical nonlinear iterative PLS model (NIPALS), and leave-one-out cross-validation was performed. Standardization was done by subtracting the mean from the value of each parameter and then dividing by the standard deviation so all data had a mean of 0 and a standard deviation of 1. The number of factors was considered optimal when the cross-validation results in the lowest obtained root mean predicted residual sum of squares (PRESS).
Nomenclature
ACSLArea between critical state line and axis of normal stress (Pa)
ApArea of the particle
APYLArea between powder yield locus and axis of normal stress (Pa)
CShear cohesion (Pa)
D10Particle diameter at 10% of the sample’s mass (m)
D50Particle diameter at 50% of the sample’s mass (m)
D90Particle diameter at 90% of the sample’s mass (m)
fcUnconfined yield strength (Pa)
ffcσ1/fc (—)
HPmaxMaximum powder bed height in shear cell (m)
HPminMinimum powder bed height in shear cell (m)
LLength of the longest line in the particle (m)
LmaxLength of the major axis of approximate ellipse (m)
LminLength of the minor axis of approximate ellipse (m)
PParticle perimeter (m)
PcPerimeter of convex hull of a particle (m)
γ
RUStress relaxation ratio based on upper force of powder bed (%)
γ
ΤStress transmission ratio of powder bed (%)
ρ
bBulk density (kg/m3)
σ
Normal stress (Pa)
σ
1Major principal stress given by the Mohr stress circle (Pa)
σ
S1Normal stress on shear plane after stress relaxation (Pa)
σ
U0Maximum upper normal stress (Pa)
σ
U1Upper normal stress after stress relaxation (Pa)
τ
Shear stress (Pa)
φ
CSLAngle of critical state line (°)
φ
iAngle of internal friction (°)
Acknowledgments
We would like to thank Yoko Koide and Mayumi Yamada for their assistance with SEM analysis and the operation of the constant-volume shear tester. This work was supported by JSPS KAKENHI Grant Number: JP23K06282, the Knowledge Hub Aichi priority research project (stage III), and the research Grant from the Information Center of Particle Technology, Japan.
Conflict of Interest
Mina Fukui is an employee of Nano Seeds Corporation. Yasuhiro Shimada is the CEO of Nano Seeds Corporation. Kohei Tahara declares no conflict of interest.
Supplementary Materials
This article contains supplementary materials.
References
- 1) Krantz M., Zhang H., Zhu J., Powder Technol., 194, 239–245 (2009).
- 2) “The Japanese Pharmacopoeia 18th Edition, General information, solid-state properties, powder flow (2021).”: ‹https://www.mhlw.go.jp/stf/seisakunitsuite/bunya/0000066530.html›, cited 1 September, 2024.
- 3) Schulze D., “Powders and Bulk Solids, Behavior, Characterization, Storage and Flow,” 2nd ed., Springer, Germany, 2021.
- 4) Horio T., Yasuda M., Matsusaka S., Int. J. Pharm., 473, 572–578 (2014).
- 5) Shimada Y., Kawata T., Matsusaka S., Adv. Powder Technol., 29, 1372–1378 (2018).
- 6) Shimada Y., Hatano S., Matsusaka S., Adv. Powder Technol., 29, 3577–3583 (2018).
- 7) Shimada Y., Yamamura K., Matsusaka S., Adv. Powder Technol., 31, 1007–1012 (2020).
- 8) Ueda M., Shimada Y., Matsusaka S., Adv. Powder Technol., 33, 103713 (2022).
- 9) Yu W., Muteki K., Zhang L., Kim G., J. Pharm. Sci., 100, 284–293 (2011).
- 10) Takeuchi Y., Tomita T., Kuroda J., Kageyu A., Yonekura C., Hiramura Y., Tahara K., Takeuchi H., Int. J. Pharm., 547, 106–113 (2018).
- 11) Goh H. P., Heng P. W. S., Liew C. V., Int. J. Pharm., 547, 133–141 (2018).
- 12) Kudo Y., Yasuda M., Matsusaka S., Adv. Powder Technol., 31, 121–127 (2020).
- 13) Jin C., Zhao L., Feng Y., Hong Y., Shen L., Lin X., Int. J. Pharm., 628, 122344 (2022).
- 14) Polizzi M. A., Franchville J., Hilden J. L., Powder Technol., 294, 30–42 (2016).
- 15) Elia A., Cocchi M., Cottini C., Riolo D., Cafiero C., Bosi R., Lutero E., Powder Technol., 301, 830–838 (2016).
- 16) Janssen P. H. M., Depaifve S., Neveu A., Francqui F., Dichoff B. H. J., Pharmaceutics, 13, 1198 (2021).
- 17) Rohilla L., Garg V., Mallick S. S., Setia G., Powder Technol., 330, 164–173 (2018).
- 18) Nakamura H., Sugino Y., Watano S., Chem. Pharm. Bull., 60, 772–777 (2012).
- 19) “Japanese Industrial Standards Z8835.”: ‹https://www.jisc.go.jp/index.html›, cited 1 September, 2024.
- 20) Ashton M. D., Cheng D. C.-H., Farley R., Valentin F. H. H., Rheol. Acta, 4, 206–218 (1965).
- 21) Tsunakawa H., Aoki R., Powder Technol., 33, 249–256 (1982).
- 22) Hirota M., Takenaka K., Iimura K., Suzuki M., Adv. Powder Technol., 18, 287–302 (2007).
- 23) Hou H., Sun C. C., J. Pharm. Sci., 97, 4030–4039 (2008).
- 24) Fukui M., Shimada Y., Tahara K., Adv. Powder Technol., 35, 104539 (2024).