Introduction
The number of poorly water-soluble drug candidate compounds has recently increased rapidly because the molecular structures have become complicated due to the adoption of high-throughput screening technology in drug development strategies and synthetic technologies.1,2) However, the compounds are often rejected due to low dissolution rates that result in insufficient blood concentrations, especially in the development of oral formulations.3–5) Sufficient membrane permeability and solubility of a drug in the gastrointestinal tract should generally be considered to achieve high bioavailability via gastrointestinal absorption.6) The Biopharmaceutics Classification System (BCS) is useful when we consider drug absorption quantitatively due to the solubility and membrane permeability.3,7–10) Approximately 40% of drugs that have been launched on the market in recent years are classed as poorly water-soluble based on the BCS, and approximately 90% of drugs under development are also classed as poorly water-soluble.9,11) Improvement of the dissolution rate and enhancement of the solubility of drugs as a basic formulation strategy is thus required to improve the bioavailability of these drugs.
The use of an amorphous form, changing the active pharmaceutical ingredient (API) to a salt, or inducing co-crystallization, are all useful approaches to improve drug solubility.1,12–16) Amorphous forms of drugs have high potential energy, which indicates high solubility. However, amorphous forms crystallize easily due to their instability, and the solubility decreases with crystallization.1,17,18) Pharmaceutical formulations such as solid dispersions are designed to maintain amorphous stability; however, there are issues regarding the large size of these formulations and/or increased hygroscopicity due to the increase in carriers such as hydrophilic polymers.
Therefore, some approaches to the formation of co-amorphous formulations that contain a poorly soluble drug and a low-molecular-weight compound to improve solubility and stability have been reported in recent years.1,19) The advantage of forming a co-amorphous formulation is to improve the solubility of poorly soluble drugs due to interactions such as hydrogen bonding between the poorly soluble drug and a low-molecular-weight compound that weakens the drug–drug molecular interaction bond energy. The amorphous state of a co-amorphous formulation is expected to remain stable for a long period of time compared with an amorphous state formed by one component, due to restricted molecular motion. In addition, if the solubility of a drug can be improved through the use of a co-amorphous formulation, then the size of tablets and capsules can be minimized compared to that where an additive polymer is used. This in turn allows the content of the active pharmaceutical component to be increased.
Probucol (PC; Fig. 1(a)) is an antihyperlipidemic drug that lowers high-density lipoprotein (HDL) cholesterol and low-density lipoprotein (LDL) cholesterol.20–22) This drug has been shown to have a potential therapeutic effect by preventing atheromatosis due to the suppression of LDL cholesterol oxidation and deposition of LDL cholesterol in tissues.23,24) Although PC is a useful drug, it is categorized as BCS Class II25) and its solubility in water is extremely low (5 ng/mL at 25 °C).26,27) The oral bioavailability of PC has been reported to be up to 6%.28) PC has been reported to have crystalline polymorphs of form I and form II.29) A new crystalline form of PC has also been recently reported.30)
In 2017, Knapik-Kowalczuk et al. reported that crystallization of PC can be suppressed by the addition of atorvastatin.31) They showed that the amorphous state of PC becomes crystallized at an elevated pressure that simulates tablet manufacturing conditions, and that the addition of atorvastatin can suppress such crystallization.31) Therefore, in the present study, we focused on the crystallinity of PC and considered that PC can form a co-amorphous state with atorvastatin. We attempted to prepare a co-amorphous formulation composed of PC as a poorly soluble model drug and atorvastatin calcium trihydrate salt (ATO; Fig. 1(b)) as a coformer of an API. ATO is an antihyperlipidemic drug from the group of 3-hydroxy-3-methylglutaryl coenzyme A reductase inhibitors, known as statins. This drug lowers the elevated LDL cholesterol levels by inhibiting the first enzymatic step of cholesterol synthesis, and is therefore of significant medicinal and commercial importance.32,33) However, ATO is insoluble in aqueous solution below pH 4, and is very slightly soluble in distilled water (143 µg/mL at 37 °C) and pH 7.4 phosphate buffer; it is categorized as BCS Class II. The absolute bioavailability of ATO is reported to be approximately 12%.33–36)
There have been previous reports on treatments with a combination of PC and ATO. Guo et al. reported that the combined use of PC and ATO is effective for the therapeutic treatment of atherosclerosis in acute coronary syndrome patients. They also reported no serious side effects on hepatic or renal function, no indication of muscle damage or severe gastrointestinal reactions with the combined use of PC and ATO. Therefore, they concluded that this combination is a safe treatment for acute coronary syndrome patients and that it has synergistic effects to lower cholesterol levels and improve antioxidant activity.37) Du et al. reported that the combined use of PC and ATO significantly reduced the brain water content and the infarct volume compared with PC or ATO alone. They also reported that the combined treatment augments neuroprotection from damage caused by middle cerebral artery occlusion. Therefore, they concluded that the combination of PC and ATO had an enhanced protective effect against cerebral ischemia.38) A synergistic effect or multi-target therapeutics by treatment with the combination of PC and ATO have been reported.37,38) Therefore, the combined use of PC and ATO is expected to become established in the future as a promising strategy for the treatment of several diseases.
In the present study, co-amorphous model drug samples were prepared by the spray-drying (SD) of PC and ATO, and the crystallinity and interaction between PC and ATO were evaluated using powder X-ray diffraction (PXRD), thermal analysis, and Fourier transform infrared spectroscopy (FTIR). The dissolution profiles of PC and ATO from the samples were evaluated with the purpose to understand the dissolution behavior of PC and ATO by co-amorphization. Amorphous PC and amorphous ATO, and their physical mixture (PM) were also prepared, and the differences in the physical properties from the co-amorphous formulation were evaluated. There have been few reports of co-amorphization between therapeutic drugs for the same disease. Furthermore, there have not been many reports regarding the dissolution behavior of a co-former in the co-amorphous dosage forms. Therefore, preparation of co-amorphous PC and ATO, and investigation of the dissolution profile of PC and ATO from the co-amorphous system are expected to provide useful information. Moreover, the crystallinity of co-amorphous samples stored for a certain period of time was also evaluated using PXRD and thermal analysis to evaluate the stability of the samples.
Experimental
MaterialsPC (M.W. = 516.84; Fig. 1(a)] and ATO (M.W. = 1209.41; Fig. 1(b)] were purchased from Tokyo Chemical Industry Co., Ltd. (Tokyo, Japan). Ethanol (reagent grade) and polyoxyethylene sorbitan monooleate (Tween 80) were purchased from Kishida Chemical Co., Ltd. (Osaka, Japan). Acetonitrile (HPLC grade) was purchased from Nacalai Tesque, Inc. (Kyoto, Japan). All other chemicals used were reagent grade.
Preparation of SamplesThe formulations of the PM and SD samples are shown in Table 1. From the results of preliminary tests, the molar ratio of PC to ATO for both the PM and SD samples was determined to be 1 : 1. The results of the preliminary tests for determination of the PC to ATO molar ratio are shown in the Supplementary Materials. The PM sample was prepared by physically mixing PC and ATO using a mortar and pestle. Amorphous PC and amorphous ATO were prepared by the following method: 100 mg of PC or ATO was dissolved or suspended in 2 mL of ethanol, and the solvent was then evaporated at 100 °C for 25 min, after which the residue was heated at 150 °C for 25 min using a sample concentrator (BSR-MD200-1, Bio Medical Science Co., Ltd., Tokyo, Japan) under a nitrogen flow. The residue was rapidly cooled to −20 °C using an ethanol bath and collected as amorphous PC or amorphous ATO. The amorphous PM sample was prepared by physically mixing amorphous PC and amorphous ATO using a mortar and pestle at PC to ATO molar ratio of 1 : 1. The SD sample was prepared using a spray dryer (GS-310, Yamato Scientific Co., Ltd., Tokyo, Japan) by the following procedure. PC and ATO were dissolved in ethanol and the solution was sprayed into a chamber through a nozzle with a diameter of 400 µm at a rate of 10 mL/min and a spray pressure of 0.15–0.2 MPa. The inlet temperature of the drying chamber was maintained at 50 °C.
Table 1. Formulations of the PM and SD Samples
| Sample name | Mole ratio | PC (g) | ATO (g) | Ethanol (mL) |
|---|
| SD_PC | PC | 1.00 | 0 | 100 |
| PM_PC_ATO | PC : ATO = 1 : 1 | 1.00 | 2.34 | 0 |
| SD_PC_ATO | PC : ATO = 1 : 1 | 1.00 | 2.34 | 334 |
The particle sizes of raw PC crystals, raw ATO crystals, and SD samples were measured using a laser diffraction particle size analyzer (SALD-2200, Shimadzu Corp., Kyoto, Japan). The particle size distribution was measured using a cyclone injection-type dry measurement unit (SALD-DS21, Shimadzu Corp.) with a compressed air pressure of 0.5 MPa. The median and modal diameters were determined from the particle size distribution.
PXRD MeasurementsPXRD measurements were performed using a diffractometer (Ultima IV, Rigaku Corp., Tokyo, Japan). The measurement conditions were as follows: graphite-monochromated Cu Kα radiation (λ = 1.54178 Å); 40 kV and 40 mA; scanning interval of 3–40° (2θ); scanning speed of 2°/min. PDXL 2.9 (Rigaku Corp.) software was used to analyze the PXRD patterns. Mercury 2021.1.0 software39) was used to visualize the crystal structures and predict the simulated PXRD patterns from known crystal structures29) in the Cambridge Structural Database.
Thermal AnalysisDifferential scanning calorimetry (DSC) was performed for sample weights of 5.0 ± 0.05 mg in open aluminum pans using a thermal analyzer system (DSC-60 Plus, Shimadzu Corp.) with Al2O3 used as a reference. The instrument was calibrated for temperature and heat flow using indium. The samples were heated from 25 to 200 °C at 10 °C/min under a nitrogen flow (50 mL/min). Melting points were determined as the onset of the peak. For samples of which the glass transition temperature was to be measured, measurements were conducted from −10 to 200 °C at 10 °C/min using crimped aluminum pans. The glass transition temperatures were determined as the midpoint of the heat capacity increment. In addition, samples of amorphous ATO and amorphous PM for stability tests were measured up to 250 °C. LabSolutions TA version 1.01 (Shimadzu Corp.) software was used for analysis of the DSC thermograms.
FTIR SpectroscopyFTIR spectra of samples were obtained between 400 and 4000 cm−1 using a FTIR spectrometer (FTIR-8400S, Shimadzu Corp.). FTIR measurements were conducted using the KBr method. Samples were mixed with KBr and pressed into pellets. Spectra were collected using 32 scans per spectrum at a resolution of 4 cm−1.
Dissolution TestsDissolution tests were performed according to Japanese Pharmacopoeia (JP) X VIII using a dissolution tester (NTR-3000, Toyama Sangyo Co. Ltd., Osaka, Japan). The dissolution medium was prepared by dissolving 1% (w/v) Tween 80 in distilled water. Preliminary tests indicated that PC dissolved from the samples was below the detection limit of HPLC in distilled water because of the extremely low solubility of PC. Therefore, a dissolution medium containing Tween 80 was used.
Prior to the dissolution tests, solubility tests were conducted by mechanical shaking with a thermo-shaker (BSR-MSC100, Bio Medical Science Co., Ltd., Tokyo, Japan). Excess amounts of PC and ATO crystalline powders (5 mg) were added to 5 mL of the dissolution medium, and then mechanically shaken. The shaking conditions were as follows; temperature: 37 °C; shaking time: 96 h; revolutions: 1000 rpm. After shaking, the filtered samples (pore size: 0.45 µm) were adequately diluted using ethanol, and the concentrations of PC and ATO were measured using HPLC. The HPLC conditions for measurement of the PC concentration were as follows: column, YMC-Pack Pro C18 4.6 × 150 mm (YMC Co., Ltd., Kyoto, Japan); mobile phase, acetonitrile : ultrapure water = 93 : 7; temperature, 40 °C; detector, UV; wavelength, 242 nm; flow rate, 1.0 mL/min; injection volume, 20 µL. HPLC using a linear gradient program was also conducted for measurement of the PC and ATO concentrations and the conditions that differed from the above conditions were as follows: wavelength, 244 nm; mobile phase, gradient conditions of mobile phases A and B. Mobile phase A was prepared by dissolving citric acid monohydrate in ultrapure water at a concentration of 1.05% (w/v, pH: 4.0 adjusted with ammonia water). Mobile phase B was acetonitrile. It was confirmed that the two types of measurements could be performed with the same accuracy. The HPLC system consisted of a Prominence LC-20AD intelligent HPLC pump, a SPD-20A intelligent UV/VIS detector, a CTO-10AS intelligent column oven, a SIL-10AF intelligent sampler, a CBM-20A system controller, and an LC solution chromatography data system (all from Shimadzu Corp.). From the solubility tests, the solubility of raw PC crystals and raw ATO crystals in the dissolution medium were determined as 25.6 ± 8.8 and 781.2 ± 13.8 µg/mL, respectively.
Subsequently, 25 mg of PC (theoretically calculated based on Table 1) was added to 900 mL of the dissolution medium with paddle stirring at 37 °C with a rotation speed of 100 rpm, as specified in JP X VIII. For ATO, the sample (theoretically containing 58.5 mg ATO) was added to the dissolution medium and the dissolution test was performed under the same conditions as that for PC. Five milliliters samples were withdrawn at predetermined time intervals and replaced with fresh dissolution medium. Dissolution tests were conducted under non-sink conditions where the amount of PC in the dissolution medium at 100% drug release is equal to approximately 109% (w/v) of the saturation solubility of raw PC crystals. For ATO, dissolution tests were conducted under sink conditions equal to approximately 8.32% (w/v) of the saturated solubility of raw ATO crystals. The collected samples were filtered (0.45 µm pore size) and diluted using ethanol. The concentrations of PC and ATO were measured using HPLC. The HPLC conditions for measurement of the PC and ATO concentrations were the same as those for the solubility tests.
Stability TestsThe stability tests were performed by storing samples in open containers under a stress environment of 40 °C and 75% relative humidity (R.H.; saturated solution with NaCl). The crystallinity of the samples was assessed using PXRD and DSC after a specific storage period.
Results and Discussion
Measurement of Particle Size DistributionTable 2 shows the median and modal diameters measured for the raw PC crystals, raw ATO crystals and SD samples. The respective median and modal diameters of SD_PC_ATO were 1.73 ± 0.402 and 2.01 ± 0.233 µm, respectively, which were smaller than the other samples. The respective median and modal diameters of SD_PC were also smaller than those of raw PC crystals and raw ATO crystals. Therefore, it was confirmed that the SD process resulted in fine particles.
Table 2. Median and Modal Diameters of Samples
| Sample name | Median diameter (µm) | Modal diameter (µm) |
|---|
| Raw PC crystals | 119 ± 12.7 | 210 ± 0 |
| Raw ATO crystals | 16.2 ± 7.99 | 35.6 ± 22.8 |
| SD_PC | 5.18 ± 1.35 | 8.45 ± 5.96 |
| SD_PC_ATO | 1.73 ± 0.402 | 2.01 ± 0.233 |
Data represented as average ± standard deviation (S.D.) (n = 3).
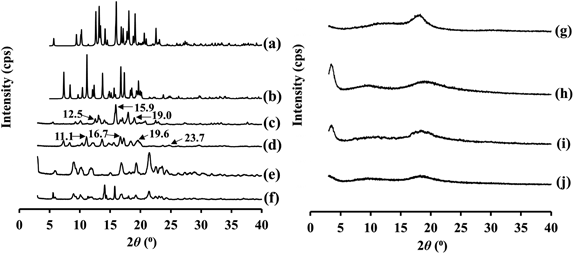
PXRD patterns for raw PC crystals, SD_PC, raw ATO crystals, PM_PC_ATO, amorphous PC, amorphous ATO, amorphous PM, and SD_PC_ATO are shown in Fig. 2. PC has been reported to have multiple polymorphs, of which form I is a stable form and form II is a metastable form.29,30) Theoretical PXRD patterns for forms I and II of PC are also shown in Figs. 2(a) and (b).29) The PXRD results indicated that the raw PC crystals were composed of the stable form I polymorph [Fig. 2(c)]. SD_PC was also prepared to evaluate the effects of the SD process on the physicochemical properties of PC. The PXRD results indicated the presence of the metastable form II [Fig. 2(d)]. Kawakami and Ohba30) reported that the solid obtained from ethanol was form II, which was also reported by Gerber et al.,29) and PXRD peaks were found at 2θ values of 11.0, 16.6, 19.4 and 23.8°.29,30) PXRD peaks for SD_PC were observed at 2θ values of 11.1, 16.7, 19.6 and 23.7°, and were similar to those for PC form II [Figs. 2(b) and (d)]. Therefore, it is considered that SD_PC is composed of form II as well as solids obtained from ethanol, as reported by Kawakami and Ohba; they reported that PC form II was obtained from ethanol by evaporation, antisolvent precipitation and cooling precipitation.30) The PXRD pattern for ATO was similar to that for a previously reported pattern [Fig. 2(e)].34) ATO has been obtained in a large number of solid state crystal forms, most of which have been the subject of patents and patent applications.40) Sonje et al. have reported a PXRD pattern of a sample of ATO, form I and 40 kinds of published diffraction patterns of ATO. It is considered that the PXRD pattern of ATO used in the present study is similar to that of form I reported by Sonje et al.40) PM_PC_ATO showed crystalline peaks derived from PC (form I) and ATO [Fig. 2(f)]. Prepared amorphous PC and amorphous ATO samples showed halo patterns in the PXRD measurements, which confirmed that they were in the amorphous state [Figs. 2(g) and (h)]. Amorphous PM also showed a halo pattern as with the amorphous PC and amorphous ATO samples [Fig. 2(i)]. SD_PC_ATO also showed a halo pattern, and no peaks derived from PC and ATO were detected [Fig. 2(j)]. Therefore, it is considered that SD_PC_ATO formed an amorphous state of PC and ATO.
Thermal AnalysisDSC thermograms of raw PC crystals, SD_PC, raw ATO crystals, and PM_PC_ATO are shown in Fig. 3(I). It has been reported that the melting onset point for form I is 125 °C and that for form II is 116 °C.29) According to the DSC results, the raw PC crystals were identified as form I because the melting onset point (125.88 °C) was almost the same as the published melting point for form I [Fig. 3(I) (a)]. On the other hand, SD_PC was identified as form II with a melting onset point of 115.63 °C [Fig. 3(I) (b)]. These results are consistent with those of the PXRD analysis. Therefore, it is considered that PC was a polymorph transferred through the SD process. Kawakami and Ohba reported that PC form II was obtained from ethanol by evaporation, antisolvent precipitation and cooling precipitation.30) They also reported that PC form II obtained by evaporation and antisolvent precipitation showed melt-crystallization behavior and a crystalline transition to PC form I during thermal analysis, whereas melt-crystallization was not observed in the PC solid obtained by cooling. The melting temperature of PC form II at 116 °C was detected only for the sample subjected to cooling precipitation. Therefore, it is considered that SD_PC is form II, as with the solids obtained by cooling precipitation using ethanol solution reported by Kawakami and Ohba.30) The melting enthalpy values for raw PC crystals and SD_PC were 62.65 J/g and 62.47 J/g, respectively [Figs. 3(I) (a) and (b)]. The melting enthalpy values for PC forms I and II were lower than those reported by Kawakami and Ohba (form I: 76 J/g; form II: 78 J/g). The differences are considered to be due to different experimental heating rates.30) Differences in the crystallinity between the present samples and those reported in the literature samples are also considered to be a reason for the significant differences in the melting enthalpies. Kim et al. reported a broad endotherm at 50–130 °C and a sharp endotherm at 155.96 °C in the DSC curve for ATO.34) In addition, Wicaksono et al. reported that ATO has a sharp endothermic peak at 159.4 °C related to the melting point and a broad peak at 108.5 °C related to water loss.41) The DSC measurements in the present study revealed that the melting point for raw ATO crystals (the onset of the peak: 131.64 °C, and the endotherm peak at 157.17 °C) was consistent with the published data [Fig. 3(I) (c)]. In the case of the PM_PC_ATO sample, the melting point for raw PC crystals was the same as that for PC form I, and no peak associated with a crystal polymorph transition was detected [Fig. 3(I) (d)].
The prepared amorphous PC that had a halo pattern in the PXRD results [Fig. 2(g)] showed an exothermic peak at around 61 °C due to recrystallization and an endothermic peak at 116.20 °C due to the melting point of PC form II [Fig. 3(II) (e)]. Therefore, it is considered that amorphous PC showed melt-crystallization behavior during thermal analysis. On the other hand, the prepared amorphous ATO showed only a glass transition temperature and a slight endothermic peak [Fig. 3(f)]. Therefore, it is considered that no obvious crystallization of ATO occurred during thermal analysis [Fig. 3(f)]. The prepared amorphous PM showed an exothermic peak at around 57 °C, an endothermic peak at 115.27 °C, and a slight endothermic peak at 125.85 °C [Fig. 3(g)]. The endothermic peaks are considered to be caused by amorphous PC, which showed melt-crystallization behavior during thermal analysis. The reason why the melting point evident in the amorphous PM results at 115.27 °C was lower than that of amorphous PC (116.20 °C) was considered to be due to the mixing with amorphous ATO. On the other hand, no melting point associated with PC could be detected for the SD_PC_ATO sample [Fig. 3(h)]. Therefore, the DSC and PXRD measurements suggest that SD_PC_ATO is amorphous. These results indicate that PC and ATO can form a co-amorphous state by the SD method. We have considered that one of the reasons why a co-amorphous state was formed is that PC and ATO were mixed at a molecular level during the SD procedure.
Although we have focused on the melting point of PC in the samples, the glass transition temperature (Tg) is also an important physical characteristic in thermal analysis. Tg in the prepared amorphous PC and amorphous PM samples was detected at 28.41 and 27.47 °C, respectively [Figs. 3(III) (e) and 3(III) (g)]. It is considered that these Tg could be attributed to the glass transition of PC. PC in amorphous form is reported to have a Tg at 299 K (25.85 °C), when measured with a heating rate of 10 K/min (10 °C/min).31) The Tg of the amorphous PC in the present study was considered to be consistent with the published data, although it exhibited melt-crystallization behavior during thermal analysis, unlike the published data.31) On the other hand, SD_PC_ATO has a much higher Tg at 48.34 °C than amorphous PC and amorphous PM [Fig. 3(III) (h)]. These results suggest that the amorphous state of PC in SD_PC_ATO is more stable than that in amorphous PC or amorphous PM. Regarding the Tg of PC containing ATO, Knapik-Kowalczuk et al. reported the effect of a small amount of atorvastatin addition to PC on the Tg.31) The sample was prepared by the quench-cooled method and the weight ratio of PC to atorvastatin was 5 to 1. They reported that the Tg of the mixture was shifted 3 K to a higher temperature relative to the quench-cooled pure PC. They also reported that the glass transition step is much broader than of pure PC. They conducted broadband dielectric spectroscopy measurements to examine how the PC mobility was changed after the addition of 16.7 wt% atorvastatin to PC. As a result, they discussed that if the molecular mobility would be the main factor responsible for the physical stability of PC, then atorvastatin would not be able to effectively stabilize PC. On the other hand, they also suggested that some other factor probably plays a crucial role, so that atorvastatin may still improve the physical stability of PC. They supposed that the atorvastatin molecules may molecularly interact with PC or play a role of steric hindrance, so that the PC molecules have limited access to each other and thus recrystallization does not occur in the probucol-atorvastatin mixture.31) Although our study differs from that of Knapik-Kowalczuk et al. in the ratio of PC and atorvastatin and in the preparation method, it is considered that the manner of interaction between PC and ATO is related to the mechanism of co-amorphous formation in the present study.
With regard to Tg in the amorphous state of ATO, Shete et al. conducted thermal analyses using several amorphous ATO samples that were prepared by an in situ method in DSC and reported that the glass transition onset shifted to the temperature range of 140–147 °C at a heating rate of 10 °C/min.42) In the present study, glass transition at 125.60 °C was followed by an additional endotherm at 135.94 °C in the amorphous ATO sample [Fig. 3(III) (f)]. Shete et al. have reported similar phenomena to our result in that the glass transition was followed by an additional endotherm, referred to as the post Tg endotherm, although the range of Tg was different from our results, which was considered to be due to the different preparation method.42) They considered that the phenomena could be attributed to the presence of multiple amorphous forms or residual crystalline content. From the results of modulated temperature DSC, they concluded that the post Tg endotherm could be attributed to the melting of crystalline content in the amorphous ATO sample. From these results, it is considered that residual crystals were included in the amorphous ATO sample prepared in the present study. The Tg of ATO was observed at 142.22 °C and the post Tg endotherm at 146.75 °C in the prepared amorphous PM [Fig. 3(III) (g)]. Therefore, it is considered that the Tg of ATO in amorphous PM was shifted to a higher temperature by thermal analysis in a state mixed with amorphous PC. For SD_PC_ATO, in addition to the PC-derived Tg, several transition points that are considered to be Tg were detected at 81.98, 122.92 and 162.98 °C. Although it is difficult to conclude what these Tg could be attributed to, SD_PC_ATO showed clearly different thermodynamic behavior from that of amorphous PM, and the Tg detected at 162 °C was particularly higher than that for amorphous ATO and amorphous PM. Therefore, these results suggest that the amorphous state of SD_PC_ATO was more stable than amorphous PM.
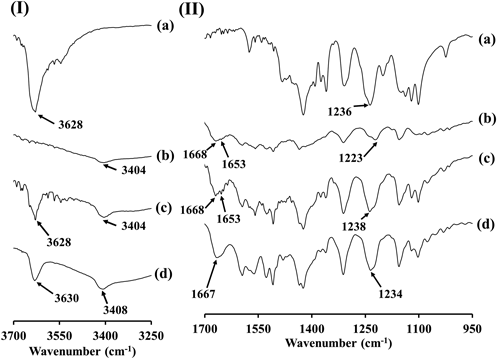
FTIR SpectroscopyFTIR peak shifts are observed when heteromolecular interactions occur in the solid state. FTIR measurements of the samples were thus performed to determine whether PC and ATO interact in the co-amorphous state. FTIR spectra of amorphous PC, amorphous ATO, amorphous PM and SD_PC_ATO are shown in Figs. 4(I) and 4(II) for wavenumber ranges of 3700–3250 cm−1 and 1700–950 cm−1, respectively. In addition, FTIR spectra of raw PC crystals, SD_PC, amorphous PC, raw ATO crystals, amorphous ATO, PM_PC_ATO, amorphous PM and SD_PC_ATO are shown in the Supplementary Materials, Fig. S3. Spectra (a) and (c) in Fig. 4(I) show that both amorphous PC and amorphous PM have a peak at 3628 cm−1. We have confirmed that the spectrum of raw PC crystals showed the previously reported characteristic peak at 3634 cm−1 due to the O-H stretching vibration of the PC molecule [Spectra (a) in Fig. S3 of the Supplementary Materials].8) FTIR measurements of SD_PC revealed that the peak at 3634 cm−1 due to raw PC crystals was shifted to around 3626 cm−1 [Spectrum (b) in Fig. S3(I) of the Supplementary Materials]. In addition, a new broad peak that was not detected for the raw PC crystals was observed for SD_PC around 3545 cm−1. Talik et al. reported that non-H-bonded “free” hydroxyl groups in PC showed an intense band above 3630 cm−1.43) Minecka et al. reported the appearance of a band at 3541 cm−1 in compressed PC, which was assigned to the formation of very weak intermolecular O–H∙∙∙S hydrogen bonds.44) Similar to the results of Talik et al. and Minecka et al., it is considered that the peak observed at 3545 cm−1 in SD_PC is also due to the formation of very weak intermolecular O−H···S hydrogen bonds [Spectrum (b) in Fig. S3(I) of the Supplementary Materials]. Furthermore, it is considered that the vibration derived from the hydroxyl groups of PC in SD_PC was different to that for the original PC due to changes in molecular interactions such as hydrogen bonds between PC molecules and PC associated with the polymorphic transition from PC form I to form II. In the spectra of amorphous PC and amorphous PM, it is considered that the peak presented at 3628 cm−1 was due to O–H stretching vibration of the PC molecule [Figs. 4(a) and (c), Figs. S3(c) and (g)]. In addition, the spectrum of SD_PC_ATO showed a peak at 3630 cm−1, which is close to the peak wavenumber of amorphous PC and amorphous PM, and the peak shape was slightly changed compared to that of amorphous PM [Spectrum (d) in Fig. 4(I)]. Therefore, since no significant peak shift was detected when comparing amorphous PC or amorphous PM with SD_PC_ATO, it cannot be concluded that there is an intermolecular interaction with ATO around the hydroxyl group of PC in SD_PC_ATO. However, the peak shape was changed; therefore, it is suspected that there is some change in the interaction between PC and ATO [Spectra (a), (c), and (d) in Fig. 4(I)].
Several characteristic FTIR peaks have been reported for ATO, such as that at 3672 cm−1 due to free hydroxyl group stretching vibrations associated with the trihydrate functionality, at 3364 cm−1 due to free N–H stretching vibrations, at 1651 cm−1 due to C=O stretching vibrations, and at 1216 cm−1 due to C–N stretching vibrations.35,41) The spectrum of the raw ATO crystal was confirmed to show a peak at 3364 cm−1 due to the free N–H stretching vibrations of ATO [Spectrum (d) in Fig. S3(I) of the Supplementary Materials]. Although it is difficult to accurately assign the spectrum because the spectrum of ATO had changed significantly when it became amorphous, it is considered that the peak at 3404 cm−1 in the spectra of amorphous ATO and amorphous PM were due to the free N–H stretching vibrations of ATO [Spectra (b) and (c) in Fig. 4(I)]. A peak was detected at 3408 cm−1 in the spectrum of SD_PC_ATO that was considered to be due to the free N–H stretching vibrations of ATO, and was slightly shifted compared to that of amorphous ATO and amorphous PM. Therefore, it is considered that the free N–H stretching vibrations of ATO had changed by the SD process in the preparation of SD_PC_ATO.
In addition, the peak at 1651 cm−1 that originates from C=O stretching vibrations in ATO was not shifted for PM_PC_ATO, but was significantly shifted to 1668 cm−1 for amorphous ATO and amorphous PM, and to 1667 cm−1 for SD_PC_ATO [Spectra (d), (e), (f), (g), and (h) in Fig. S3(II)]. Regarding the amorphous state of ATO, the following studies have been reported; Shayanfar and Jouyban prepared co-amorphous compounds with ATO and carvedilol or glibenclamide.45) They reported that the carbonyl groups in ATO are the most likely functional groups to participate in H-bonding between these drugs. In addition, there is a difference between the carbonyl bond stretching in crystalline ATO (1651 cm−1), the amorphous form of ATO reported by Kim et al. (1662 cm−1), and the co-amorphous compound with ATO and carvedilol (1655 cm−1).35,45) Similar to the co-amorphous compound of ATO and carvedilol, a co-amorphous compound of ATO and glibenclamide showed a carbonyl stretching mode for ATO at 1658 cm−1. They considered that the shifts correspond to the interaction of the carbonyl groups of ATO via H-bonding with carvedilol or glibenclamide.45)
From a comparison of the amorphous samples as shown in Fig. 4(II), no significant differences in the peak due to C=O stretching vibrations in ATO were detected between amorphous ATO, amorphous PM, and SD_PC_ATO; however, SD_PC_ATO did show a different peak form from that of amorphous ATO and amorphous PM; a small peak was detected at 1653 cm−1 for amorphous ATO and amorphous PM that was not detected in the spectrum for SD_PC_ATO with a smooth spectrum form [Spectra (b), (c) and (d) in Fig. 4(II)]. Although it was difficult to find significant differences because the comparisons were made between amorphous samples in the present study, peak form differences were evident between amorphous PM and SD_PC_ATO. Similar to carvedilol, PC has no carbonyl functional groups [Fig. 1(a)]. Therefore, it is considered that there is a possibility that the carbonyl groups of ATO interact via H-bonding with PC. Furthermore, although the peak at 1215 cm−1 due to C–N stretching vibration observed for ATO was not observed for SD_PC_ATO, no change was observed for PM_PC_ATO [Spectra (d), (f), and (h) in Fig. S3(II)]. The peak at 1223 cm−1 attributed to C–N stretching vibration was observed in the spectrum of amorphous ATO, and a peak at 1238 cm−1 was detected in the spectrum of amorphous PM, which was considered to be due to amorphous PC detected at 1236 cm−1 [Spectra (a), (b), and (c) in Fig. 4(II), and (c) in Fig. S3(II)]. In SD_PC_ATO, the peak at 1234 cm−1 was detected and shifted from the peak at 1238 cm−1 observed for amorphous PM. Therefore, it is considered that new intermolecular interactions between PC and the carbonyl and amide groups of ATO may occur in SD_PC_ATO. Gordon and colleagues reported that when substances are transformed into their amorphous counterparts, the molecular arrangement changes and the resulting IR spectra are slightly altered. They also reported that the IR peaks are typically broader and less sharp than the crystalline analogues, and peak shifts are likely to be detected due to a different chemical environment or different molecular packing.46–48) The spectra of amorphous samples in the present study showed peak-shifts and waveform-changes compared to the respective raw crystals as a result of amorphization. In particular, the spectrum of SD_PC_ATO showed peak-shifts and waveform-changes compared to that of amorphous PC, ATO and PM. Therefore, it is considered that the molecular packing and chemical environment of molecules in SD_PC_ATO are different from those in amorphous PC, amorphous ATO, and amorphous PM, and the intermolecular interactions may be changed by the formation of the amorphous state in SD_PC_ATO.
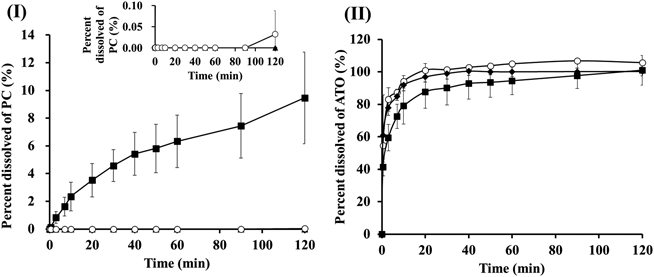
Dissolution TestsRelease profiles for PC from raw PC crystals, SD_PC, PM_PC_ATO and SD_PC_ATO are shown in Fig. 5(I) and those for ATO from raw ATO crystals, PM_PC_ATO and SD_PC_ATO are shown in Fig. 5(II). The dissolution tests showed that PC released from raw PC crystals, SD_PC, and PM_PC_ATO was below the detection limit or only slightly detected up until 2 h. Therefore, the amount of dissolved PC from raw PC crystals, SD_PC, and PM_PC_ATO was almost 0% at 2 h. PXRD analysis suggested that PC in SD_PC is form II, which has lower crystallinity than raw PC crystals. However, the amount of dissolved PC from SD_PC was also almost 0% at 2 h. It is considered that this is because PC in SD_PC, which is form II, undergoes a rapid polymorphic transition to form I when PC is in contact with aqueous media.
On the other hand, PC released from SD_PC_ATO could be detected and the percentage of dissolved PC exceeded 9% at 2 h. The intrinsic release rate of PC from SD_PC_ATO was 0.039 µg/(mL·min) which was calculated from the concentration of dissolved PC up to 10 min. Table 2 shows that the particle size of SD_PC_ATO was smaller than that of the other raw samples, which suggests that the surface area is large and the resultant dissolution rate becomes fast. Based on the PXRD measurements and thermal analysis, it is considered that the differences in PC solubility in the aqueous solutions among the PC preparations were due to differences in the crystallinity of PC in the samples. The dissolution tests in this study showed that the amount of PC released from raw PC crystals, SD_PC and PM_PC_ATO, which have crystallinity, is significantly lower than that from SD_PC_ATO, which is amorphous. Therefore, one of the reasons why SD_PC_ATO showed a high percentage of dissolved PC is considered to be that PC contained in the sample had changed into the amorphous state. In addition, the results of the dissolution tests showed that PC released from SD_PC_ATO is maintained in a supersaturated state for at least 2 h. Hatanaka et al. reported that a co-amorphous state is formed with hydrophobic drugs nifedipine and ketoconazole at a molar ratio of 1 : 1 by SD. Dissolution tests of these co-amorphous samples indicated that supersaturated states of both compounds were formed and maintained by the intermolecular interactions between nifedipine and ketoconazole in the aqueous media.1) In the present study, the results of FTIR measurements suggested that intermolecular interactions between PC and ATO occur in SD_PC_ATO. Therefore, it is considered that the supersaturated state of PC was formed and maintained because the intermolecular interaction between PC and ATO in SD_PC_ATO maintained the amorphous state, even in aqueous medium.
On the other hand, Fig. 5(II) shows that the ATO released from the raw ATO crystals, PM_PC_ATO and SD_PC_ATO reached almost 100% within 2 h, whereas the dissolution rate of ATO from SD_PC_ATO was slower compared to that for raw ATO crystals and PM_PC_ATO. The FTIR measurement results indicated that intermolecular interaction between PC and ATO occurred in SD_PC_ATO; therefore, we consider that the slower dissolution rate of ATO from SD_PC_ATO is due to the intermolecular interaction of ATO with PC, which is poorly soluble in water.
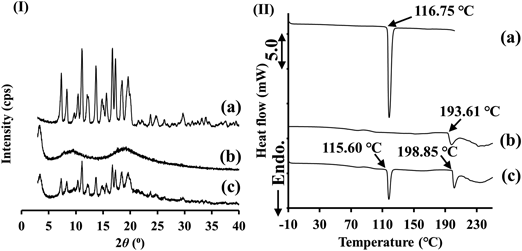
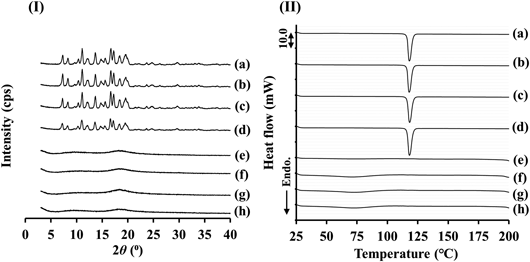
Stability TestsStability studies were performed by assessing the crystallinity of samples using PXRD and DSC analysis of samples stored for defined periods after preparation. Single-component amorphous and amorphous PM samples were evaluated using samples stored for a day after preparation, and SD_PC and SD_PC_ATO were stored for 0, 7, 20, and 35 d after preparation. PXRD patterns for amorphous PC, amorphous ATO and amorphous PM obtained after storage for one day are shown in Fig. 6(I). Peaks were detected in the PXRD patterns of amorphous PC and amorphous PM stored for one day, whereas amorphous ATO showed a halo pattern [Figs. 6(I) (a), (b) and (c)]. DSC patterns for amorphous PC, amorphous ATO and amorphous PM obtained after storage for one day are shown in Fig. 6(II). Amorphous PC and amorphous PM showed endothermic peaks at around 116.75 and 115.60 °C, respectively [Figs. 6(II) (a) and (c)]. The PXRD and DSC results suggest that amorphous PC and amorphous PM were recrystallized as PC form II during storage. An endothermic peak was observed at 193.61 °C for the stored amorphous ATO [Fig. 6(II) (b)]. Stored amorphous PM also showed an endothermic peak at 198.85 °C [Fig. 6(II) (c)]. It is considered that the endothermic peak in both samples is due to the melting point of ATO. The PXRD and DSC results for amorphous ATO and amorphous PM suggest that the ATO molecules in these samples were recrystallized due to the heat generated during the DSC measurement.
PXRD patterns for SD_PC and SD_PC_ATO obtained after storage for 35 d are shown in Fig. 7(I). SD_PC with PC form II on day 0 of preparation showed PC form II and no changes in the PXRD patterns over the 35 d during the stability test [Figs. 7(I) (a), (b), (c) and (d)]. Therefore, it is considered that PC form II in SD_PC did not transform to PC form I during the stability test. As shown in Fig. 7(I), SD_PC_ATO showed a halo pattern and no diffraction peaks originating from PC and ATO were detected for 35 d under the conditions of 40 °C and 75%R.H. [Figs. 7(I) (e), (f), (g) and (h)]. The PXRD results suggested that the SD_PC_ATO sample remained co-amorphous for 35 d under the stability test conditions. DSC patterns for SD_PC and SD_PC_ATO obtained during storage for 35 d are shown in Fig. 7(II). SD_PC showed almost the same onset melting point at day 0 of preparation and after 35 d of storage [Figs. 7(II) (a) and (d)]. It is considered that PC form II prepared by SD (SD_PC) was not transformed to form I under the stability test conditions. In the case of SD_PC_ATO, no endothermic peak due to PC could be detected on the day of preparation (day 0) or after 35 d [Figs. 7(II) (e) and (h)]. Therefore, the co-amorphous state of PC and ATO was confirmed to be stable for 35 d under the stability test conditions. A small broad endothermic peak detected at around 90 °C in the SD_PC_ATO sample was considered to be due to the desorption of adsorbed water. The PXRD and DSC results from the stability tests showed that PC and ATO in the co-amorphous sample (SD_PC_ATO) remained in the amorphous state for at least 35 d. Therefore, it is considered that the co-amorphous state formed by PC and ATO is stable for 35 d without crystallization. Yamamoto et al. reported that hydrogen bonding is the main factor that contributes to the stability of co-amorphous itraconazole-fumaric acid.49) They considered that this interaction folds the hydrophilic moiety, which sterically hinders the exposure of hydrophilic molecules in the amorphous material. The surface of itraconazole-fumaric acid is hydrophobic, which prevents the access of water molecules to the hydrophilic parts in the co-amorphous compound. This strong interaction means that the mobility of the entire itraconazole-fumaric acid co-amorphous material is low and the relative surface area is not sufficiently large for water molecules to attach to the surface.49) The results of FTIR measurements in the present study confirmed that some changes in the chemical environment of the molecule had occurred in the functional groups that can form interactions such as hydrogen bonds between PC and ATO within SD_PC_ATO. Therefore, it is considered that such interactions contribute to the stabilization of the co-amorphous state in the present study.
The co-amorphous state formed by PC and ATO in SD_PC_ATO was confirmed to be more stable than the single-component amorphous state. This is because the co-amorphous state is composed of two components and ATO suppresses the crystallization of PC; therefore, the co-amorphous state is more stable than the single-component amorphous state.