Abstract
Obesity is known to be associated with increased inflammation and dysregulated autophagy, both of which contribute to insulin resistance. Saikosaponin-A (SSA) has been reported to exhibit anti-inflammatory and lipid-lowering properties. In this research, we employed a combination of computational modeling and animal experiments to explore the effects of SSA. Male C57BL/6 mice were categorized into four groups: normal diet, high-fat diet (HFD), HFD + atorvastatin 10 mg/kg, and HFD + SSA 10 mg/kg. We conducted oral glucose and fat tolerance tests to assess metabolic parameters and histological changes. Furthermore, we evaluated the population of Kupffer cells (KCs) and examined gene expressions related to inflammation and autophagy. Computational analysis revealed that SSA displayed high binding affinity to tumor necrosis factor (TNF)-α, nuclear factor (NF)-κB, fibroblast growth factor 21 (FGF21), and autophagy-related 7 (ATG7). Animal study demonstrated that SSA administration improved fasting and postprandial glucose levels, homeostatic model assessment of insulin resistance (HOMA-IR) index, as well as triglyceride, free fatty acid, total cholesterol, low-density lipoprotein cholesterol (LDL-C)-cholesterol, and high-density lipoprotein cholesterol (HDL-C)-cholesterol levels in HFD-fed mice. Moreover, SSA significantly reduced liver weight and fat accumulation, while inhibiting the infiltration and M1 activation of KCs. At the mRNA level, SSA downregulated TNF-α and NF-κB expression, while upregulating FGF21 and ATG7 expression. In conclusion, our study suggests that SSA may serve as a therapeutic agent for addressing the metabolic complications associated with obesity. This potential therapeutic effect is attributed to the suppression of inflammatory cytokines and the upregulation of FGF21 and ATG7.
Introduction
Obesity, a critical public health concern, poses a significant risk for prevalent chronic diseases such as type 2 diabetes mellitus, dyslipidemia, hypertension, and non-alcoholic fatty liver disease (NAFLD).1) Despite the development of therapeutic agents to address obesity, its incidence continues to rise at an alarming rate. The accumulation of visceral adiposity leads to the M1 polarization of macrophages, disruption of adipokines, and inhibition of autophagy, resulting in elevated levels of pro-inflammatory cytokines, endoplasmic reticulum (ER) stress, and endothelial dysfunction. These pathological changes contribute to insulin resistance, a key pathophysiological state characterized by a lack of response to insulin in insulin-responsive organs.2) Insulin resistance plays a central role in obesity-related metabolic disorders by interfering with glucose uptake in skeletal muscle, increasing lipolysis in adipocytes, and promoting gluconeogenesis in the liver.3,4)
Bupleurum falcatum L., a traditional medicine in Eastern Asian countries, exhibits anti-inflammatory, hepatoprotective, and immunomodulatory effects, and its major bioactive compounds are saikosaponin-A, C, and D.5) This study conducted computational analysis of each compound in terms of autophagy and insulin resistance, and selected saikosaponin-A (SSA) as a subject of in vivo experiments. SSA has been investigated for its anti-inflammatory effects, modulation of T cells,6,7) and antioxidant effects8) through the extracellular signal-regulated kinase/nuclear factor-κB (ERK/NF-κB) pathways. Additionally, SSA has demonstrated lipid-lowering effects by enhancing the production of fibroblast growth factor 21 (FGF21).9) In the context of obesity, SSA has been shown to inhibit pro-inflammatory cytokines such as tumor necrosis factor (TNF)-α, interleukin (IL)-1β, and IL-6 by suppressing NF-κB via the ERK pathway in hypertrophied 3T3-L1 adipocytes.6) Although several studies have examined the efficacy of SSA on lipid metabolism in relation to inflammation and reactive oxidative stress (ROS),6,7,10) they are restricted to in vitro experiments, and little is known about its impact on insulin resistance and autophagy. Therefore, this study aims to explore the effects of SSA on insulin resistance and autophagy by integrating in silico molecular docking simulations and in vivo experiments using high-fat-diet (HFD)-induced obese mice.
Experimental
In Silico Analysis of SSA: Molecular DockingThe simplified molecular-input line-entry system (SMILES) of SSA, saikosaponin-C (SSC), and saikosaponin-D (SSD) were acquired from PubChem, and they were converted into a 3D structure using Open Babel. PDB data and structures of autophagy-related 7 (ATG7) (PDB ID:3T7H), TNF-α (PDB ID:2AZ5), NF-κB p65 (PDB ID:1NFI), and FGF21 (PDB ID:6M6E) were obtained from RCSB PDB (https://www.rcsb.org/, access date: May 23, 2022). A Biovia Discovery Studio Visualizer was used to modify each protein by adding polar groups and removing water molecules. PyRx was used to dock the molecules and determine their binding affinity. The Biovia Discovery Studio Visualizer and PyMOL were used to acquire the visualization images.
In Vivo Analysis of SSA’s Metabolic Effects on Obesity Induced by High-fat DietsPreparation of SSA and Model Animals and Weight MeasurementMale C57BL/6N mice that were six weeks old were selected as the model animals for this research and were provided by Central Lab Animals, Inc (Seoul, South Korea). The mice were raised under controlled conditions of 40–70% humidity and a 12-h light-dark cycle. Water and food were supplied without restriction, and the mice were allowed to adapt for one week before further experiments were conducted. A sample size of five mice was selected randomly, and these mice were administered a normal diet (Research Diets D12450B, 10% kcal fat), while another group of 15 mice was administered high-fat diets (Research Diets D12492, 60% kcal fat) for 15 weeks. Mice were divided into four groups— normal chow (NC), control (HFD), atorvastatin (HFD + ATO), and SSA (HFD + SSA). Treatment was initiated at week six and continued for nine weeks. Mice in the ATO and SSA group were orally administered 10 mg/kg of atorvastatin or SSA once daily with oral zonde, while others were administered the same amount of normal saline. The SSA used in this research was purchased from Tokyo Chemical Industry Company Limited (Lot Number: GAV6N). The purity of SSA was > 95% in HPLC methods, and for solubility, log S calculated with the Estimated SOLubility (ESOL) model of SSA was −5.87 which was classified as moderately soluble. Atorvastatin was purchased from Sigma-Aldrich (St. Louis, MO, U.S.A.).
The body weight of all subject mice was measured during the experimental period before administration of the SSA or atorvastatin treatment or normal saline. An electronic scale (CAS 2.5D, Korea) was used to calculate weight, and each mouse was placed in a plastic container to be weighed; all measurements were taken only when the mice were still. After the mice were euthanized at the end of week 14, their epididymal fat pads and livers were collected and weighed using an electronic scale (CAS 2.5D, Korea). The amount of food consumed was also measured every morning before being supplied to the mice; this was calculated as kcal intake per day. All procedures for animal experiments were approved by the Kyung Hee Medical Animal Research Ethics Committee (KHMC-IACUC 2021-012; Approval Date: April 12, 2021).
Oral Glucose Tolerance TestAt week 11, oral glucose tolerance tests (OGTT) were conducted on all mice, before which they fasted for 14 h. Glucose (2g/kg of each mouse’s body weight) was administered along with dextrose, following which the mice’s blood glucose levels were evaluated from blood samples collected from their tail veins using a strip-operated blood glucose sensor (ACCU-CHEK Performa, Australia) at 0, 30, 60, 90, 120 and 180 min.
Insulin Resistance MeasurementAt week 14, blood samples were taken from the tail veins of mice that had been fasted for 6 h to assess their insulin resistance. Blood samples were collected in BD microtainer serum separator tubes and were centrifuged immediately after collection for 20 min at 2000 G. Insulin levels were obtained using an ultrasensitive mouse insulin ELISA kit (Crystal Chem INC, Elk Grove Village, IL, U.S.A.). Samples were distributed in an antibody-coated microplate containing 96 wells with 5 µL of sample per well; these samples were incubated at 4 °C for 2 h. Samples were washed five times, after which anti-insulin enzyme conjugates were added and incubated for 30 min at room temperature. Samples were washed seven times, after which an enzyme-substrate solution was added. Sample tubes were incubated for 40 min, and reaction stop solution was added. After allowing to stand for 10 min, the microplates were analyzed using an ELISA reader at 450 µm. Insulin resistance was evaluated with homeostatic model assessment of insulin resistance (HOMA-IR) using the following equation: HOMA-IR = fasting blood glucose (mg/dL) × fasting insulin (µg/mL) × 0.0717225161669606.
Oral Fat Tolerance Test and Serum Lipid ProfilesOral fat tolerance tests (OFTT) were conducted on all three experimental groups at week 12, for which mice fasted for 14 h beforehand. Olive oil (2 mL per kg of mouse body weight) was administered to all subjects, and the quantity of triglycerides was measured from blood samples collected from the tail vein using an Accutrend Plus (Roche, U.S.A.) meter and Accutrend triglyceride strips at 0, 120, 240, and 360 min. A triglyceride colorimetric assay kit (Cayman, U.S.A.) was used for subsequent analyses.
All mice were euthanized for study at week 14, and blood samples were then collected from the hearts. Non-esterified free fatty acids (NEFA), low-density lipoprotein cholesterol (LDL), high-density lipoprotein cholesterol (HDL), total cholesterol (TC), phospholipids, and triglycerides (TG) were analyzed using these blood samples.
Liver and Kidney Function AssessmentsAt week 14, blood samples from euthanized mouse hearts were centrifuged for 20 min at 3000 rpm, and the supernatants were stored at −40 °C. Aspartate aminotransferase (AST) and alanine aminotransferase (ALT) levels were then analyzed for liver function evaluations, while creatinine levels were estimated for kidney function evaluations.
RNA Extraction from Liver TissueLiver tissues were collected from euthanized mice at week 14. All samples were wrapped in aluminum foil and were stored in liquid nitrogen at −70 °C until RNA extraction; RNA was extracted from liver tissues using Quick-RNA™ Miniprep Kit (ZYMO RESEARCH, CA, U.S.A.). Defrosted liver tissue was pulverized using a homogenizer in tubes containing the RNA lysis buffer, and all samples were then centrifuged at 1000 rpm. The supernatants were transferred to a Zymo-Spin IIICG column using 2 mL collection tubes, and these were centrifuged for 1 min at 10000 × g. After this, 400 µL of the RNA wash buffer was added to each collection tube; samples were washed twice and moved to 1.5 mL collection tubes. RNA-free water was added (50 µL per tube), and all samples were centrifuged at 10000 × g. Samples were maintained at −70 °C until RNA isolation was conducted.
Gene Expression Analysis in Liver TissueQuantitative real-time PCR (qRT-PCR) were conducted to determine the gene expression of F4/80, NF-κB p65, IL-6, TNF-α, monoacylglycerol lipase (MGL), AKT, ATG7, and FGF21. cDNA was obtained using an Advantage RT PCR Kit (Clontech, U.S.A.). OligodT and RNase-free H2O were added to 1ug of RNA extracted from liver tissue, and this mixture was incubated at 70 °C for 2 min. Recombinant RNase inhibitor, 10 Nm dNTP, 5X reaction buffer, and Moloney Murine Leukemia Virus (M-MLV) reverse transcriptase (RT) were added, after which samples were activated at 42 °C for 60 min, followed by at 94 °C for 5 min. PCR primers, 2x SYBR reaction buffer, and dH2O were added to the cDNA acquired through reverse transcription (Supplementary Table S1). PCR amplification was performed using the 7900HT Fast Real-Time PCR System (Applied Biosystems, U.S.A.). Cycle thresholds (Ct) acquired via the SDS Software 2.4 (Applied Biosystems®, U.S.A.) were normalized for the relative quantitation of glyceraldehyde 3-phosphate dehydrogenase (GAPDH), and the associated fold change was also calculated. Fold change values were adjusted to the NC group, which was converted to a value of one.
Isolation of Kupffer Cells from Liver Tissue and Fluorescence-Activated Cell Sorting (FACS) AnalysisPhosphate-buffered saline (PBS) was infused into the portal vein, and the gall bladder was removed from the liver. Liver tissues were treated with RPMI 1640 medium containing 100 mL/L fetal calf serum (FCS). Samples were mashed in a 60 mm Petri dish, filtered with 200G stainless mesh, and 8 mL Percoll, 200 µL heparin, and 9 mL PBS were added. Samples were centrifuged for 20 min at 2000 rpm, and we removed the supernatant containing parenchymal cells. After washing with PBS, we incubated the samples in 1X ACK lysis buffer (Lonza) for 10 min to dissolve red blood cells. PBS was applied, and samples were centrifuged for 5 min at 1500 rpm. Using a 100 µm cell strainer, redundant tissue was disposed. Samples were recentrifuged for 5 min at 1500 rpm, and nonparenchymal cells were pelletized.
Cell numbers in each sample were adjusted to 105 using a Cellometer (Nexcelom Biosceience LLC, U.S.A.). FcBlock (BD Pharmingen, U.S.A.) was added at a 1 : 100 ratio, and samples were incubated for 10 min. CD45-FITC, F4/80-APC, CE11c-phycoerythrin (CD11b-PE; BioLegend, U.S.A.), and CD206-FITC (BioLegend, U.S.A.) were added, and samples were incubated for 20 min in the dark. Samples were washed and centrifugated at 1500 rpm and were analyzed with FACSCanto (BD Bioscience, U.S.A.). FlowJo program (Tree Star Inc., U.S.A.) was used to determine percentages of cell types.
Histological Observation of Fat and Liver TissueSamples of euthanized subject’s epididymal fat and liver were placed in 10% neutral buffered formalin (NBF); these were submerged in 70, 80, 95, and 100% ethanol for dehydration and were then embedded in paraffin blocks. All samples were sliced into 4 µm thick pieces and were grafted onto gelatin-coated slides; sliced pieces were dewaxed using xylene and were rehydrated in 100, 95, 80, and 70% ethanol solutions, after which distilled water was used for staining. Tissues were stained using hematoxylin–eosin (H&E). Two slide sections from three mouse in each group were acquired and digital images were obtained using a high-resolution camera-mounted optical microscope (Olympus BX-50, Olympus Optical, Tokyo, Japan). The sizes of adipocytes in epididymal fat-pad tissues and the percentage of fat area in liver tissues were analyzed using the ImageJ image processing program.
Statistical AnalysesData are presented in this study as the mean ± standard error (S.E.). One-way ANOVA and Tukey’s post hoc test was used to evaluate the data’s statistical significance, and two-way repeated measures ANOVA was used to verify the main effects of SSA and diet for OGTT and OFTT. GraphPad PRISM 5 (GraphPad Software Inc., San Diego, CA, U.S.A.) was used for statistical analyses. Two-tailed p-values of < 0.05 were deemed statistically significant. Significant differences between the NC and HFD groups have been marked with asterisks (*), with * for when p < 0.05, ** for when p < 0.01, and *** for when p < 0.001. Significant differences between the HFD and SSA groups are marked with pound signs (#), with # for when p < 0.05, ## for when p < 0.01, and ### for when p < 0.001.
Results
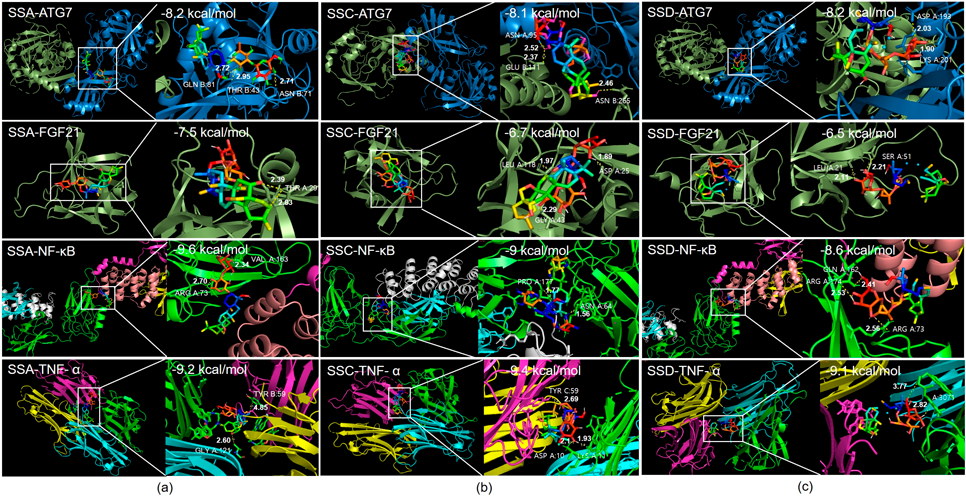
In Silico Analysis of SSA: Molecular DockingTo investigate which compounds of Bupleurum falcatum have the potential to regulate autophagy and insulin resistance, molecular docking simulations of saikosaponins with ATG7, FGF21, NF-κB, and TNF-α were conducted. Binding free energy of < −7 indicates a high affinity between the compound and the target protein.11) Results showed a binding affinity of −8.2 kcal/mol, −7.5 kcal/mol, −9.6 kcal/mol, and −9.2 kcal/mol between SSA and target proteins ATG7, FGF21, NF-κB, and TNF-α respectively. Binding affinity of SSC with each target proteins were −8.1 kcal/mol, −6.7 kcal/mol, −9 kcal/mol, and −9.4 kcal/mol respectively. SSD showed binding affinity of −8.2 kcal/mol, −6.5 kcal/mol, −8.6 kcal/mol, and −9.1 kcal/mol respectively. Visualizations of molecular docking in 3D are shown in Fig. 1.
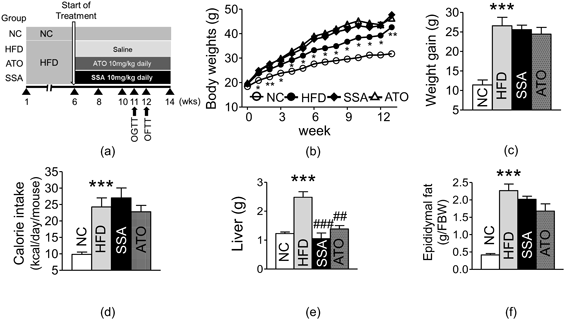
In Vivo Evaluation of SSA’s Metabolic Effects on High-fat Diet-Induced ObesityEffect of SSA on Body, Liver, and Epididymal Fat Pads’ WeightsTo confirm the in silico results, mice were fed with HFD for 14 weeks with and without SSA administration, as summarized in Fig. 2a. The weights of the body, weight gain, calorie intake, liver and epididymal fat pad were significantly different between the HFD-control and NC groups (Figs. 2b–f). There was no significant difference in weight between HFD group and SSA group (Figs. 2b, c). The SSA group showed no differences in daily calorie intake from the HFD control group, suggesting that SSA’s anti-obesity effect was not linked to food intake (Fig. 2d). The SSA group showed notably decreased liver weight compared to the HFD control group (1.05 ± 0.20 vs. 2.48 ± 0.19 g; p < 0.001) (Fig. 2e). Furthermore, the SSA group showed decreased fat weight compared to the HFD control group, but this difference was not statistically significant (Fig. 2f).
Effect of SSA on Glucose Metabolism and Insulin ResistanceGlucose levels at all points during the OGTT, the area under the curve (AUC), and insulin levels were elevated in the HFD control group compared to the corresponding levels in the NC group; the difference between the two was found to be statistically significant. The two-way ANOVA showed that both effects of SSA treatment and HFD were significant for OGTT in 30 and 60 min (p < 0.05). Glucose levels in the SSA group were consistently lower than that of the HFD control group, and the difference was statistically significant at 30 and 60 min (30 min: 328.2 ± 21.96 vs. 386.8 ± 6.28 mg/dL, p < 0.05; 60 min: 227.2 ± 19.77 and 293.2 ± 9.14 mg/dL, p < 0.05) (Fig. 3a). The AUC of OGTT was noticeably lower in the SSA group compared to that observed in the HFD control group (35088 ± 2176.27 vs. 40890 ± 1162.38 mg·min/dL, p < 0.05) (Fig. 3b). Fasting glucose levels, insulin levels, and HOMA-IR of the SSA group were found to be significantly decreased compared to those in the HFD control group (Fasting glucose level: 172.6 ± 2.87 vs. 218.4 ± 19.23 mg/dL, p < 0.05; Insulin level: 2.09 ± 0.37 vs. 3.86 ± 0.61 ng/mL, p < 0.05; HOMA-IR: 25.83 ± 4.53 vs. 62.09 ± 14.79, p < 0.05) (Figs. 3c–e).
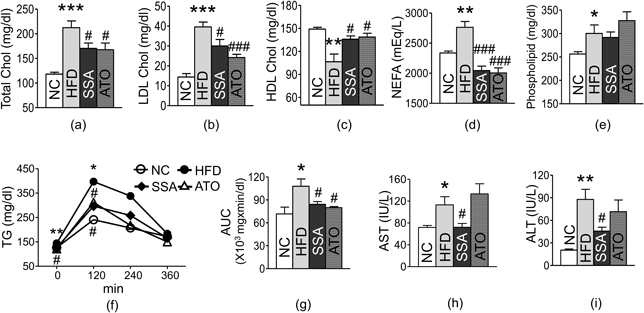
Effect of SSA on Lipid MetabolismLDL-C, TC, NEFA, and phospholipid levels were significantly higher, and HDL-C was considerably lower in the HFD control group compared with the corresponding levels in the normal group. The SSA group exhibited noticeable improvements in all lipid profiles compared to those of the HFD control group; the difference was statistically significant except for phospholipids (TC: 170.4 ± 10.78 vs. 212.4 ± 13.61 mg/dL, p < 0.05; LDL-C: 30 ± 3.29 vs. 39.6 ± 2.44 mg/dL, p < 0.05; HDL-C: 135.82 ± 4.39 vs. 106.54 ± 10.05 mg/dL, p < 0.05; NEFA: 2044.2 ± 74.43 vs. 2763 ± 95.81 mEq/L, p < 0.001) (Figs. 4a–e, respectively)]. During OFTT, the control group showed higher AUC and TG levels than the normal group. The two-way ANOVA showed that effects of SSA treatment were significant for OFTT in 120 min (p < 0.05). TG levels in the SSA group were consistently lower than those in the HFD control group, and this difference was significant at 120 min (Fig. 4f). The AUC of the OFTT was also significantly decreased in the SSA group relative to the HFD control group (Fig. 4g).
Effect of SSA on Liver and Kidney FunctionThe HFD control group showed significantly elevated AST and ALT levels compared to the NC group. SSA showed significant protective effects on liver function compared to the control group (AST: 72.2 ± 7.00 vs. 113.2 ± 14.92 IU/L, p < 0.05; ALT: 45.8 ± 5.09 vs. 87.8 ± 13.49 IU/L, p < 0.05) (Figs. 4h and i, respectively). Creatinine levels showed no differences among the three experimental groups (Supplementary Fig. S1).
Effects of SSA on Kupffer CellsLiver tissues in the HFD control group showed a significantly higher percentage of Kupffer cells than the NC group. The SSA group showed a considerable decline in the percentage of Kupffer cells compared to the HFD control group (21.08 ± 0.77 vs. 26.76 ± 2.42, p < 0.05) (Fig. 5a). The HFD control group exhibited upregulated percentage of CD11c+ Kupffer cells and downregulated percentage of CD206+ Kupffer cells compared to the NC group. However, SSA showed appreciable regulation in the percentage of CD11c+ Kupffer cells and substantial elevation in the percentage of CD206+ Kupffer cells (CD11c+ KCs: 39.96 ± 1.15 vs. 43.18 ± 0.78, p < 0.05; CD206+ KCs: 47.4 ± 3.74 vs. 34.56 ± 1.56, p < 0.05) (Figs. 5b, c).
Effect of SSA on Gene Expression in Liver TissuesThe HFD control group showed significant increases in F4/80, TNF-α, IL-6, NF-κB p65, MGL, and FGF21 expression in liver tissue, along with a substantial decrease in AKT and ATG7 expression, compared to the normal group. The SSA group showed significant regulation of the gene expression of F4/80, TNF-α, and NF-κB p65 compared to that in the HFD control group (F4/80: 5.94 ± 0.85 vs. 11.33 ± 1.23, p < 0.01; TNF-α: 3.71 ± 0.73 vs. 9.66 ± 1.63, p < 0.05; NF-κB p65: 2.48 ± 0.38 vs. 4.46 ± 0.62, p < 0.05) (Figs. 6a, b, and d, respectively). Gene expression of IL-6 and MGL were downregulated, and AKT was upregulated in the SSA group relative to the HFD control group, but the difference was statistically insignificant. ATG7 and FGF21 were significantly upregulated in the SSA group relative to their levels in the HFD control group (ATG7: 1.18 ± 0.07 vs. 0.58 ± 0.07, p < 0.001; FGF21: 5.93 ± 0.74 vs. 3.34 ± 0.64, p < 0.05) (Figs. 6g and h, respectively).
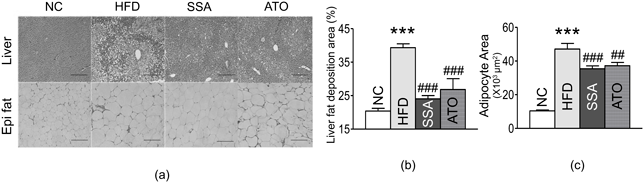
Effects of SSA on Liver and Adipose TissuesThe ectopic fat area in the liver was elevated in the HFD control group relative to the NC group. The SSA group showed a substantial decrease in the rate of ectopic fat area in the liver compared to the HFD control group (24.03 ± 2.21 vs. 39.34 ± 2.55%, p < 0.001) (Figs. 7a, b). The size of adipocytes in the epididymal fat pads was significantly more significant in the HFD control group than in the NC group. Adipocytes displayed a considerable size reduction in the SSA group compared to the size in the HFD control group (35436.98 ± 1695.45 vs. 47108.05 ± 3349.05 µm2, p < 0.001) (Figs. 7a, c).
Discussion
Obesity, characterized by excessive fat accumulation and adipocyte hypertrophy, contributes to monocyte infiltration through chemokines and triggers low-grade systemic inflammation.12,13) This condition leads to impaired insulin signaling in insulin-sensitive tissues and increased production of pro-inflammatory cytokines, exacerbating metabolic complications.1,13)
Saikosaponins, bioactive compounds extracted from Bupleurum falcatum L., has been examined for their effects in inflammation, liver injury and other metabolic effects.5) We performed molecular docking simulations of saikosaponins with ATG7, FGF21, NF-κB, and TNF-α to assess their effects on autophagy, and insulin resistance and inflammation. Among several saikosaponins, SSA showed most favorable results in molecular binding affinity. Previously, SSA has been investigated for its anti-inflammatory, antioxidant, and immunosuppressive properties.14) Its effects on T-cell regulation, anti-inflammatory pathways, and lipid metabolism have been studied.6,7,10,15) However, limited research has explored the impact of SSA on insulin resistance, autophagy, and glucose metabolism. Our in silico results indicated that SSA might stimulate autophagy, ameliorate inflammation, enhance FGF21, and guided subsequent in vivo experiments. Therefore, we aimed to investigate the potential of SSA in improving insulin resistance, autophagy, and glucose metabolism in vivo experiments with HFD-induced obese mice.
In the in vivo experiments, we observed significant reductions in the size of epididymal fat adipocytes in the SSA group compared to the control group. Furthermore, SSA treatment led to reduced ectopic fat accumulation in the liver, as evidenced by histological analyses and decreased liver weights. Improved liver function was indicated by decreased AST and ALT levels, suggesting that SSA may protect against hepatic damage caused by obesity.
Our results provide evidence that SSA has beneficial effects on glucose metabolism in obese mice. The group treated with SSA exhibited improvements in glucose checkpoints and the AUC for the OGTT, particularly at the 30- and 60-min time points compared to the HFD group. Early blood glucose levels during the OGTT are indicative of beta-cell function as they reflect the initial release of insulin in response to hyperglycemia.16) The significant improvements observed in fasting glucose levels, insulin levels, and HOMA-IR indicate that SSA positively influences basal insulin secretion. Therefore, SSA treatment resulted in enhanced responses of both basal and postprandial insulin, leading to improved insulin resistance and beta-cell function. These findings suggest that SSA has the potential to ameliorate glucose tolerance and insulin resistance. Importantly, this study represents the first evidence highlighting the therapeutic potential of SSA in the context of glucose tolerance, as its effects on glucose metabolism have not been extensively studied.
In a state of insulin resistance, adipocytes exhibit increased lipolysis, resulting in elevated levels of free fatty acids (FFAs) in the bloodstream.2) This excess FFA leads to enhanced triglyceride synthesis and the formation of very low-density lipoprotein (VLDL) when combined with apolipoprotein B. Insulin resistance also stimulates the production of apolipoprotein B via the phosphoinositide-3-kinase (PI3K) pathway, further increasing VLDL production. The hydrolysis of VLDL yields LDL, which is a major contributor to arteriosclerotic cardiovascular disease (ASCVD).17) Conversely, HDL exhibits an inverse relationship with ASCVD risk, as it acts as a reverse cholesterol transporter, facilitating the removal of cholesterol remnants from peripheral tissues to the liver.18) Administration of SSA demonstrated remarkable reductions in TC, LDL, and NEFA levels, along with a significant increase in HDL, indicating the efficacy of SSA in improving dyslipidemia. The notable decrease in NEFA levels may be attributed to the substantial reduction in TC and LDL levels. Since elevated FFA levels are critical in impairing insulin signaling,19) the therapeutic reduction of FFA levels may extend to improvements in insulin sensitivity. Our results align with the previous study of Lim et al. which illustrated SSA inhibited adipogenesis in mouse 3T3-L1 adipocytes.15) Furthermore, our study demonstrated that SSA administration significantly suppressed triglyceride levels in OFTT and upregulated HDL, supporting the notion that SSA improves lipid metabolism.
Obesity induces ectopic lipid accumulation, systemic low-grade inflammation, and subsequent insulin resistance. These pathological changes contribute to NAFLD, which can progress to non-alcoholic steatohepatitis (NASH).20) Kupffer cells, resident macrophages in the liver, play a crucial role in exacerbating NAFLD and maintaining hepatic glucose tolerance. Inhibition of Kupffer cells has been identified as a potential treatment target for obesity, NAFLD, and diabetes.20) Under conditions of liver injury, Kupffer cells can differentiate into either M1-like (classical) or M2-like (alternative) macrophages.21) Factors such as lipopolysaccharide (LPS), interferon-γ (IFN-γ), and TNF-α promote classical Kupffer cell differentiation, leading to the production of IL-12, IL-23, and high levels of nitric oxide and ROS. Conversely, IL-4, IL-10, IL-13, and transforming growth factor-beta (TGF-β) drive alternative Kupffer cell activation, resulting in the production of IL-10 and the inhibition of pro-inflammatory cytokines. SSA group exhibited significant suppression of Kupffer cell population and a phenotypical shift towards M2 Kupffer cells. This experiment was the first to investigate effects of SSA in Kupffer cell population. Our findings suggest that SSA exerts immunosuppressive and anti-inflammatory effects in the liver, highlighting its therapeutic potential for obesity-induced hepatic steatosis and inflammation.
To further investigate the impact of SSA on liver gene expression, we examined the mRNA levels of various genes in mouse liver tissues. In HFD control group, we observed upregulation of F4/80, TNF-α, IL-6, NF-κB p65, MGL, and FGF21, while AKT and ATG7 were downregulated compared to the NC group. In the SSA group, the expression of F4/80, a prominent marker for macrophages in mice,22) was significantly suppressed compared to the HFD group, consistent with the flow cytometry findings. SSA treatment led to a substantial downregulation of TNF-α compared to the control group. TNF-α is a key pro-inflammatory cytokine that exacerbates insulin signaling impairment by affecting insulin receptor substrate-1 (IRS-1) and glucose transporter type-4 (GLUT-4).23) Furthermore, the inhibition of TNF-α is associated with a shift towards a less classical-dominant distribution of Kupffer cells, as evidenced by the flow cytometry analysis. TNF-α and IL-6 contribute to low-grade inflammation, insulin resistance, and lipolysis, leading to elevated levels of FFAs. Although not statistically significant, the mRNA level of IL-6 was also reduced in the SSA group. Prior in vitro studies have also shown that SSA has regulatory effects on TNF-α, IL-6, and IL-1, which are major pro-inflammatory cytokines.6,24) NF-κB plays a significant role in regulating inflammation by inducing cytokine production and influencing the differentiation of inflammatory T-cells.25) Treatment with SSA significantly decreased NF-κB levels compared to the control group in our research, while previous in vitro studies have also revealed that SSA decreased phosphorylation of NF-κB.10,26) Collectively, our findings in liver gene expression suggest that SSA attenuates macrophage infiltration and inflammation induced by obesity.
Given the potential therapeutic value of FGF21 and ATG7 modulators for obesity, we conducted exploratory investigations into the impact of SSA on these factors. While the precise mechanisms of FGF21 are not yet fully understood, it is known to have various metabolic roles, including the promotion of autophagy.27) Through in silico analysis, we confirmed a strong molecular affinity between SSA and both ATG7 and FGF21. Based on this finding, we conducted in vivo gene expression analysis for these genes. FGF21 plays a regulatory role in FFA oxidation, glucose metabolism, and the browning of white adipose tissue.28) Paradoxically, our study revealed elevated FGF21 expression in obesity, indicating the presence of FGF21 resistance.29) However, SSA administration significantly increased FGF21 expression, suggesting that it may help overcome FGF21 resistance. Our findings regarding FGF21 align with those of Wu et al.,9) and the beneficial effects of SSA on lipid and glucose metabolism may be attributed to the increased expression of FGF21. Furthermore, our study demonstrated that SSA treatment significantly increased the expression of ATG7, suggesting its effect on enhancing autophagy. Obesity-induced ER stress leads to elevated FFAs through lipolysis, which in turn increases the levels of cytokines such as TNF-α and IL-6 via the protein kinase RNA-like ER kinase (PERK) mechanism.30) Increased inflammation exacerbates ER stress, establishing a detrimental cycle that ultimately leads to insulin resistance. Autophagy, a vital cellular process for recycling components, helps alleviate ER stress31) and maintain glucose homeostasis through autophagic degradation during fasting.32) Suppression of autophagy upregulates pro-inflammatory cytokines, intensifies ER stress, and disrupts organ function and metabolic homeostasis.33) Similarly, reduced ATG7 levels impair insulin signaling in white adipose tissue and the liver, and increase ER stress.34) Thus, our results suggest that the enhancement of ATG7 by SSA in obese mice may improve insulin response by reducing ER stress and cytokine levels. Though our study showed possible effects of SSA on autophagy, further researches on diverse factors of autophagy pathway are needed.
We comprehensively assessed the metabolic improvements achieved by SSA in diet-induced obese mice at multiple levels, including RNA analysis, Kupffer cell evaluation, serum measurements, histology, and organ weights. To the best of our knowledge, our study is the first to investigate the effects of SSA on insulin resistance and glucose metabolism in vivo. These findings highlight the potential of SSA as a therapeutic agent for obesity-related metabolic syndromes, particularly non-alcoholic fatty liver diseases.
Conclusion
Our study demonstrates that administration of SSA in high-fat diet-induced obese mice resulted in improved glucose and lipid metabolism, reduced insulin resistance, and mitigated liver damage. These improvements were attributed to the suppression of Kupffer cell infiltration and inflammation, as well as the upregulation of ATG7 and the novel metabolic regulator FGF21. Our findings indicate that SSA has significant metabolic benefits in the context of obesity-induced non-alcoholic fatty liver diseases, and it shows promise for improving insulin resistance.
Acknowledgments
This research was supported by a Grant from the Korea Health Technology R & D Project through the Korea Health Industry Development Institute (KHIDI), funded by the Ministry of Health & Welfare, Republic of Korea (Grant Number: HF20C0022).
Conflict of Interest
The authors declare no conflict of interest.
Supplementary Materials
This article contains supplementary materials.
References
- 1) Heymsfield S. B., Wadden T. A., N. Engl. J. Med., 376, 254–266 (2017).
- 2) Kaur J., Cardiol. Res. Pract., 2014, 943162 (2014).
- 3) Kahn B. B., Flier J. S., J. Clin. Invest., 106, 473–481 (2000).
- 4) Samuel V. T., Shulman G. I., J. Clin. Invest., 126, 12–22 (2016).
- 5) Yang F., Dong X., Yin X., Wang W., You L., Ni J., BioMed Res. Int., 2017, 7597596 (2017).
- 6) Kim S. O., Park J. Y., Jeon S. Y., Yang C. H., Kim M. R., Int. J. Mol. Med., 35, 1126–1132 (2015).
- 7) Sun Y., Cai T. T., Zhou X. B., Xu Q., Int. Immunopharmacol., 9, 978–983 (2009).
- 8) Wu S. J., Lin Y. H., Chu C. C., Tsai Y. H., Chao J. C., J. Med. Food, 11, 224–229 (2008).
- 9) Wu L., Yan Q., Chen F., Cao C., Wang S., Biomed. Pharmacother., 135, 111187 (2021).
- 10) He D., Wang H., Xu L., Wang X., Peng K., Wang L., Liu P., Qu P., J. Cardiovasc. Pharmacol., 67, 510–518 (2016).
- 11) Mohan R. R., Wilson M., Gorham R. D. Jr., Harrison R. E. S., Morikis V. A., Kieslich C. A., Orr A. A., Coley A. V., Tamamis P., Morikis D., ACS Omega, 3, 6427–6438 (2018).
- 12) Ghaben A. L., Scherer P. E., Nat. Rev. Mol. Cell Biol., 20, 242–258 (2019).
- 13) Xu L., Kitade H., Ni Y., Ota T., Biomolecules, 5, 1563–1579 (2015).
- 14) Li X., Li X., Huang N., Liu R., Sun R., Phytomedicine, 50, 73–87 (2018).
- 15) Lim S. H., Lee H. S., Han H. K., Choi C. I., Int. J. Mol. Sci., 22 11409 (2021).
- 16) Caumo A., Luzi L., Am. J. Physiol. Endocrinol. Metab., 287, E371–E385 (2004).
- 17) Kwiterovich P. O. Jr., Am. J. Cardiol., 86 (12A), 5L–10L (2000).
- 18) Lewis G. F., Rader D. J., Circ. Res., 96, 1221–1232 (2005).
- 19) Paolisso G., Howard B. V., Diabet. Med., 15, 360–366 (1998).
- 20) Sarwar R., Pierce N., Koppe S., Diabetes Metab. Syndr. Obes., 11, 533–542 (2018).
- 21) Nguyen-Lefebvre A. T., Horuzsko A., J. Enzymol. Metab., 1 101 (2015).
- 22) Dos Anjos Cassado A., Results Probl. Cell Differ., 62, 161–179 (2017).
- 23) Lee B. C., Lee J., Biochim. Biophys. Acta Mol. Basis Dis., 1842, 446–462 (2014).
- 24) Zhu J., Luo C., Wang P., He Q., Zhou J., Peng H., Exp. Ther. Med., 5, 1345–1350 (2013).
- 25) Liu T., Zhang L., Joo D., Sun S. C., Signal Transduct. Target. Ther., 2, 17023 (2017).
- 26) Du Z. A., Sun M. N., Hu Z. S., Inflammation, 41, 193–198 (2018).
- 27) Tillman E. J., Rolph T., Front. Endocrinol. (Lausanne), 11, 601290 (2020).
- 28) Fisher F. M., Maratos-Flier E., Annu. Rev. Physiol., 78, 223–241 (2016).
- 29) Fisher F. M., Chui P. C., Antonellis P. J., Bina H. A., Kharitonenkov A., Flier J. S., Maratos-Flier E., Diabetes, 59, 2781–2789 (2010).
- 30) Salvado L., Palomer X., Barroso E., Vazquez-Carrera M., Trends Endocrinol. Metab., 26, 438–448 (2015).
- 31) Rashid H. O., Yadav R. K., Kim H. R., Chae H. J., Autophagy, 11, 1956–1977 (2015).
- 32) Ezaki J., Matsumoto N., Takeda-Ezaki M., Komatsu M., Takahashi K., Hiraoka Y., Taka H., Fujimura T., Takehana K., Yoshida M., Iwata J., Tanida I., Furuya N., Zheng D. M., Tada N., Tanaka K., Kominami E., Ueno T., Autophagy, 7, 727–736 (2011).
- 33) Choi A. M., Ryter S. W., Levine B., N. Engl. J. Med., 368, 651–662 (2013).
- 34) Yang L., Li P., Fu S., Calay E. S., Hotamisligil G. S., Cell Metab., 11, 467–478 (2010).